Research in Higher Education, Vol. 44, No. 2, April 2003 ( 2003)
THE RELATIONSHIP BETWEEN INSTITUTIONAL MISSION AND STUDENTS’ INVOLVEMENT AND EDUCATIONAL OUTCOMES Gary R. Pike,*,** George D. Kuh,* and Robert M. Gonyea*
::::::::::::::::::::::::::::::::::::::::::::::::::::::::::::::::::::::::::::: Although institutional characteristics are assumed to influence student learning and intellectual development, this link has not been confirmed empirically. This study examined whether institutional mission, as represented by Carnegie classification, is related to student learning and development. After controlling for student background characteristics, no meaningful differences were found in students’ perceptions of the college environment, levels of academic and social involvement, integration of information, or educational outcomes by Carnegie classification.
::::::::::::::::::::::::::::::::::::::::::::::::::::::::::::::::::::::::::::::::::::::::::::::::: KEY WORDS: student involvement; educational outcomes; assessment; college effects.
Based on the conventional wisdom that the characteristics of colleges and universities influence students’ learning and intellectual development, the American public, policymakers, and higher-education scholars frequently focus on institutional input measures as proxies for educational quality (Toutkoushian and Smart, 2001). Each year, for example, as many as 400,000 prospective students consult institutional rankings when deciding which college to attend (McDonough, Antonio, Walpole, and Perez, 1998), and many state legislatures and governing boards use performance-indicator systems that are based, in part, on institutional input characteristics (Taylor and Massey, 1996). In addition, several widely used college-effects models include elements representing the relationships between institutional characteristics and student learning (Astin, 1985; Pascarella, 1985; Weidman, 1989). A variety of institutional characteristics, including selectivity of admissions,
*Gary R. Pike, University of Missouri–Columbia. George D. Kuh and Robert M. Gonyea, Indiana University–Bloomington. **Address correspondence to: Gary R. Pike, 72 McReynolds Hall, Columbia, MO 65211. E-mail:
[email protected] 241 0361-0365/03/0400-0241/0 2003 Human Sciences Press, Inc.
242
PIKE, KUH, AND GONYEA
faculty–student ratios, and per-student expenditures, have been used as proxies for educational quality in an effort to account for differences in student learning. Most recently, attention has focused on institutional mission as a factor influencing student learning and intellectual development. This interest in the role of institutional mission stems, at least in part, from several national reports that criticized undergraduate education at research universities and college-ranking systems that tend to favor highly selective liberal arts colleges (Kuh and Hu, 2001a; Pascarella, 2001a). Although institutional characteristics are assumed to influence student learning and intellectual development, this link has not been confirmed empirically. Colleges and universities may differ in terms of students’ learning outcomes, but they certainly also differ in terms of students’ entering characteristics (Astin, 1970; Chickering, 1972). When differences in students’ backgrounds are taken into account, the effects of institutional characteristics on student learning and intellectual development tend to be weak and inconsistent (Pascarella and Terenzini, 1991). For example, early studies by Astin (1968, 1969, 1971), Astin and Panos (1969), and Nichols (1964) found statistically significant zero-order correlations between institutional characteristics (e.g., academic aptitude of the student body, financial resources, and faculty–student ratio) and measures of student learning. After controlling for differences in students’ backgrounds, virtually all of the correlations between institutional characteristics and learning outcomes were trivial and nonsignificant. More recently, Toutkoushian and Smart (2001) examined the relationships between institutional expenditures and student gains in learning. Consistent with previous research, the net effects of college expenditures were quite small and, in some instances, counter to expectations. Research on the relationships between institutional mission and learning outcomes has produced either inconclusive or similar results. Winter, McClelland, and Stewart (1981), for example, found that the magnitude of freshman–senior differences on measures of critical thinking were greater for small, selective liberal arts colleges than for less selective state teachers’ colleges. Using data from the College Student Experiences Questionnaire (CSEQ, 4th edition), Pace (1984, 1990) found that students at liberal arts colleges reported higher levels of involvement and gains in intellectual skills than did students at other types of institutions. The published norms for the third and fourth editions of the CSEQ also indicate that students attending selective liberal arts colleges report higher levels of involvement and greater gains in learning than students attending other types of colleges and universities (Kuh and Siegel, 2000; Kuh, Vesper, Connolly, and Pace, 1997; Pace, 1995). However, none of these studies controlled for differences in students’ backgrounds. In two recent studies, Kuh and Hu (2001a, 2001b) examined the relationships between institutional mission as
INSTITUTIONAL MISSION, STUDENTS’ INVOLVEMENT AND OUTCOMES
243
represented by Carnegie type and students’ reports of involvement and gains on the CSEQ, after controlling for differences in students’ background characteristics. In both studies, they found that differences in involvement and gains by institutional type were largely accounted for by differences in students’ background characteristics. These findings are also consistent with the two national reports from the National Survey of Student Engagement (Indiana University Center for Postsecondary Research and Planning, 2000, 2001). In their review of the research on the relationships between institutional characteristics and student learning, Pascarella and Terenzini (1991) identified two important limitations that may help explain the inability of previous studies to document consistent institutional effects. First, many of the studies relied on homogeneous samples of students and institutions, and this lack of variability may have created restriction-of-range problems that attenuated the strength of the relationships between institutional characteristics and learning outcomes. Second, previous studies relied on correlation and regression techniques that were not sensitive to the joint effects of institutional and student characteristics. As Pascarella and Terenzini noted, the inability to account for these joint effects may have resulted in underestimating institutional effects. The present study examines whether students attending institutions with different types of missions differ in terms of their college experiences and learning outcomes. The methodological limitations of earlier studies were addressed by using data from dozens of colleges and universities that ostensibly differ in mission to overcome problems related to restriction of range and by using multigroup structural equation models to identify the joint effects of institutional and student characteristics. Four questions guided this research: (a) Do students’ levels of involvement and gains in learning differ by institutional mission as represented by Carnegie type? (b) Is it possible to accurately represent the relationships among background characteristics, college experiences, and educational outcomes using Chickering’s (1974) involvement and integration and integration model of student learning? (c) Do the patterns of relationships among background characteristics, college experiences, and educational outcomes vary across different types of institutions? (d) Do levels of involvement, integration, and gains vary across different types of institutions? The first question provides a basic understanding of whether students’ backgrounds, levels of involvement and/or gains differ by types of institution. The second and third questions examine basic assumptions of structural equation modeling—that the model accurately represented the observed data and that the measurement and effect parameters in the model were the same for all groups. The final question focuses on the fundamental concern of the study. Do student self-reported levels of involvement and gains differ by type of institution?
244
PIKE, KUH, AND GONYEA
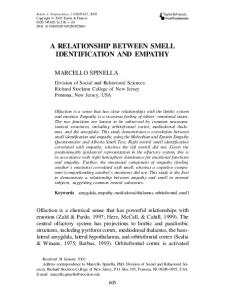
RESEARCH METHODS Conceptual Model The conceptual model used in the present research was based on Astin’s (1970) input-environment-output (I-E-O) model of college effects and Pascarella’s (1985) model of environmental influences on college outcomes. The conceptual model is presented in Fig. 1. Consistent with Astin’s model, inputs (i.e., student background characteristics) were included in the conceptual model to account for possible biases resulting from self-selection into particular types of colleges and universities. Drawing on Pascarella, the conceptual model included constructs representing students’ perceptions of the college environment and their experiences during college. Students’ perceptions and experiences were presumed to affect their learning and intellectual development. The conceptual model also features two key aspects of the college experience: involvement and integration. Chickering (1974) argued that learning requires both active participation in a variety of academic and social activities and the integration of these various experiences, as represented by efforts to apply what one is learning in different settings. A considerable body of research points to the influence of involvement, or student engagement in educationally purposeful activities, on student learning (Astin, 1993; Feldman and Newcomb, 1969; Pascarella and Terenzini, 1991). Research on the importance of integrating diverse curricular and cocurricular experiences is less prevalent. Studies by Davis and
FIG. 1. Structural relationships in the conceptual model.
INSTITUTIONAL MISSION, STUDENTS’ INVOLVEMENT AND OUTCOMES
245
Murrell (1993) and Pike (1995) provided indirect evidence of the importance of integration. These researchers found evidence of strong reciprocal relationships among different types of college experiences. Three recent studies using variations of Chickering’s model suggest that involvement and integration constructs help to represent accurately the relationships among students’ college experiences and learning outcomes (Pike, 1999, 2000; Pike and Killian, 2001). Results from these studies also supported the causal ordering of involvement, integration, and learning outcomes used in the conceptual model. In the conceptual model, students’ perceptions of the college environment are directly related to gains in learning and intellectual development. Consistent with Pascarella’s (1985) model, perceptions of the college environment also are related to academic and social involvement. In contrast to Pascarella’s model, no causal ordering of the environment and involvement constructs is presumed. Rather, it is expected that a positive college environment leads to greater academic and social involvement, recognizing that involvement could lead to positive perceptions of the environment. For this reason, reciprocal relationships between the college environment and the involvement constructs are implied in the model. Although it is reasonable to expect that perceptions of the college environment are related to involvement measures, it is not obvious that positive perceptions of the environment will contribute to greater integration of academic and social experiences. In fact, Chickering (1974) noted that it is the level of student effort, or involvement, that is the most influential factor in integration, not the college environment. Recent research by Pike and Killian (2001) has also shown that integration is not directly related to perceptions of the college environment. Hence, the conceptual model does not hold that the college-environment construct will be related to integration. Consistent with the results of recent research (Pike, 1999, 2000; Pike and Killian, 2001), academic and social involvement are thought to have a direct effect on gains in learning and intellectual development. Involvement is also presumed to have an indirect effect on gains in learning and intellectual development, acting through the direct effect of integration on student learning. Because student background characteristics were included in the model as controls for self-selection, they are assumed to directly influence all other constructs in the model. Sample The participants in this study were a stratified random sample of 1,500 undergraduates from across the nation who completed the College Student Experience Questionnaire (CSEQ), Fourth Edition (Pace and Kuh, 1998). Strata for the sample were the six dominant Carnegie 2000 classifications for 4-year colleges
246
PIKE, KUH, AND GONYEA
and universities: Doctoral/Research-Extensive, Doctoral/Research-Intensive, Master’s I, Master’s II, Baccalaureate Liberal Arts, and Baccalaureate General Colleges (McCormick, 2000). Random samples of 250 participants in each Carnegie group were selected from the population of students who completed the CSEQ. Approximately 63.7% of the participants in this study were female, and 83.3% were white. Students who classified themselves as Mexican American, Puerto Rican, or Other Hispanic comprised 3.4% of the sample; Asian or Pacific Islanders comprised 3.9% of the sample; African Americans comprised 6.6% of the sample; and Native Americans comprised 1.4% of the sample. Students who classified themselves as either Multiracial or Other comprised 5.5% of the sample. Approximately 65.7% of the participants indicated they planned to pursue an advanced degree, and 39.7% were first-generation college students. Of the students included in the study, 53.0% were freshmen, 17.1% were sophomores, 13.4% were juniors, and 16.5% were seniors. Given the nature of the sample, it is not surprising that the participants in this study were generally representative of the populations of CSEQ respondents within each Carnegie classification. Measures All of the measured variables used to represent the latent constructs in the conceptual model were taken from the CSEQ. The CSEQ asks students to report the frequency with which they engage in activities that represent good educational practice and are related to positive learning outcomes (Kuh and Hu, 2001a; Kuh et al., 1997). Self-report data are widely used in research on college effects, and the validity and credibility of these data has been extensively studied (Baird, 1976; Berdie, 1971; Pace, 1985; Pike, 1995; Pohlmann and Beggs, 1974). Research shows that self-reports are likely to be valid under five conditions: “(1) the information requested is known to the respondents; (2) the questions are phrased clearly and unambiguously; (3) the questions refer to recent activities; (4) the respondents think the questions merit a serious and thoughtful response; and (5) answering the questions does not threaten, embarrass, or violate the privacy of the respondent or encourage the respondent to respond in socially desirable ways” (Kuh et al., 2001, p. 9). Studies using the CSEQ indicate that the survey meets these five criteria and provides accurate and appropriate data about students’ college experiences (Kuh and Hu, 2001a). The relationships between the measured variables and latent constructs are shown in Table 1. Also included in the table are means, standard deviations, and reliability estimates for the measured variables. The five background or input variables included in the model were perfectly represented by demographic questions from the CSEQ. Specifically, gender was represented by a dichotomous item indicating whether the participant was female, and ethnicity
INSTITUTIONAL MISSION, STUDENTS’ INVOLVEMENT AND OUTCOMES
247
TABLE 1. Means, Standard Deviations, and Reliability Estimates for the Measured Variables Measure Background Female Minority Pursue advanced degree Parents not graduate from college Freshman Academic involvement Library experiences Active/collaborative learning Writing experiences Interaction with faculty Social involvement Personal experiences Student acquaintances Topics of conversation College environment Academic environment Interpersonal environment Integration of experiences Academic integration Social integration Gains in learning General education Communication Interpersonal development Intellectual development
Mean
Std. Dev.
Alpha
0.64 0.17 0.66 0.40
0.48 0.37 0.47 0.50
2.12 2.36 2.68 2.36
0.58 0.55 0.62 0.67
0.82 0.70 0.79 0.88
2.54 2.58 2.36
0.65 0.68 0.60
0.84 0.91 0.87
5.25 5.29
1.09 1.10
0.78 0.75
2.94 2.52
0.62 0.60
0.78 0.86
2.42 2.92 2.94 2.95
0.65 0.68 0.67 0.68
0.80 0.72 0.82 0.83
was represented by a dichotomous item indicating whether the participant was a member of an ethnic minority group. Although the college experiences of students from different ethnic groups may differ markedly, the proportions of students in the various ethnic minority groups were too small to permit an analysis at this level. Students’ educational aspirations were represented by whether the participants indicated that they intended to enroll for an advanced degree. Participants were classified as first-generation college students if neither their mother nor their father had graduated from college. Class level was represented by a dichotomous variable indicating whether or not the participant was a freshman. Preliminary analyses indicated that first-year students differed significantly
248
PIKE, KUH, AND GONYEA
from all other students in terms of their CSEQ responses, whereas differences among sophomores, juniors, and seniors were relatively small. Academic involvement was represented by four measured variables: library experiences, active and collaborative learning, writing experiences, and interaction with faculty. The library experiences scale consisted of the eight qualityof-effort items dealing with students’ use of the library. Alpha reliability for this scale was 0.82. The active and collaborative learning scale consisted for four quality-of-effort items dealing with course learning and two items about students’ experiences with faculty. The α reliability coefficient for this scale was 0.70. The writing experiences scale included the seven quality-of-effort items focusing on students’ writing experiences and the faculty interaction scale consisted of 8 of the 10 items concerning students’ experiences with faculty. Alpha reliability coefficients for the two scales were 0.79 and 0.88, respectively. Social involvement was represented by three quality-of-effort scales: personal experiences, student acquaintances, and topics of conversations. All of the questions contributing to these three scales were used to construct the scales and produced α reliability coefficients of 0.84, 0.91, and 0.87, respectively. Students’ perceptions of the college environment were represented by two measured variables: perceived quality of the academic environment and perceived quality of the interpersonal environment. Students’ ratings of the scholarly, aesthetic, and analytical environment were included in the academic environment scale, and the α reliability coefficient for the scale was 0.78. Students’ ratings of their relationships with other students, faculty, and administrative personal and offices were included in the interpersonal environment scale. Alpha reliability for this scale was 0.75. The latent variable representing students’ integration of their college experiences was measured using two scales: academic integration and social integration. The academic integration scale consisted of five items from the course learning scale, whereas the social integration scale consisted of the six information in conversations items from the CSEQ. The five items representing integration of academic experiences asked students about the extent to which they synthesized information learned in class and applied that information in other classes or in other areas of their lives. The six items representing integration of information in social experiences focused on the extent to which students used information gathered in class in social settings, the extent to which social experiences led to further academic investigations, and the extent to which students used information to persuade, or be persuaded by, others. Alpha reliability coefficients for the two scales were 0.78 and 0.86, respectively. Students’ gains in learning and intellectual development were represented by four scales: gains in general education (six items, α = 0.80), gains in communication (three items, α = 0.72), gains in interpersonal development (four items, α = 0.82), and gains in intellectual development (four items, α = 0.83).
INSTITUTIONAL MISSION, STUDENTS’ INVOLVEMENT AND OUTCOMES
249
Data Analysis The data analysis was conducted in four phases. First, scores on all measured variables were tested, using analysis of variance (ANOVA) procedures, to determine if there were statistically significant differences among the six Carnegie groups. In addition, effect sizes (i.e., eta-squared coefficients) were calculated to determine if group differences were meaningful. Based on the results of the first phase of the analysis, data for the total sample were analyzed using latent variable models in LISREL 8.3 (Jo¨reskog and So¨rbom, 1999) to determine if the conceptual model provided an acceptable representation of the data. The analysis tested whether the covariance matrix implied by the structural equation model and the measurement model differed significantly from the observed covariance matrix. Maximum likelihood estimation was used because it provided goodness-of-fit measures that were robust against departures from multivariate normality (Hu and Bentler, 1999). Two measures were used to assess model fit: the root mean square error of the approximation (RMSEA) and the standardized root mean square residual (SRMR). In addition to being robust against departures from multivariate normality, both indexes were relatively insensitive to the effects of sample size (Hu and Bentler, 1998, 1999). The RMSEA was sensitive to misspecification of the measurement model and rewarded more parsimonious models. The SRMR was sensitive to misspecification of the structural equation model. Based on their Monte Carlo studies, Hu and Bentler (1999) concluded that acceptable models would produce RMSEA coefficients less than or equal to 0.07 and SRMR coefficients less than or equal to 0.09. The first model tested was an exact representation of the structural equation and measurement models. Based on the results of the goodness-of-fit tests for the initial model, a specification search was planned to identify a model that provided a better representation of the data. Initially, modification indexes for the bivariate relationships among the measured variables were examined to determine if they should be included in the model. A bivariate relationship was included if it was reasonable and substantially improved model fit. Next, t values for the effect parameters in the model were examined to determine if any nonsignificant paths between latent variables could be eliminated. Paths were eliminated from the model if the effect parameters were not statistically significant and if excluding the path from the model did not adversely affect goodness of fit. This process allowed a model to be specified, tested, respecified, and retested until an acceptable model was identified. The final model from the second phase of the analysis provided the starting point for the third phase of the analysis. In the third phase, the stability (i.e., invariance) of the model across the six Carnegie groups was examined. Covariance matrixes for the groups were calculated and analyzed using a multigroup
250
PIKE, KUH, AND GONYEA
structural equation model. Factor loadings in the measurement model and paths in the structural equation model were constrained to be the same for all groups. Model fit was assessed using the RMSEA and the SRMR. Based on the results of the goodness-of-fit tests, a specification search was planned to identify those parameters that should be free to vary across groups. The final phase of the data analysis involved the specification and testing of structural equation models with means and intercepts. Means were calculated for students in the Doctoral/Research-Extensive group and then subtracted from the means of all participants. In this way, the means for students from Doctoral/ Research-Extensive universities were set to zero, and the means for students in all other Carnegie types were expressed as deviations about the means for Doctoral/Research-Extensive universities. Although not required, centering the data about the means of one group greatly simplified interpretation of the results. The starting point in the final phase was the final model from the previous step. In the first submodel, means for the five student background measures were allowed to vary freely across groups, but there were no differences in the intercepts for the college experience and outcome variables. This model represented a scenario in which there were differences among the groups, but the differences were attributable to differences in students’ entering characteristics. Based on the goodness-of-fit results for this submodel, a specification search was planned to determine if freeing any of the intercepts in the structural equation models substantively improved model fit. Freeing an intercept represented a scenario in which there were meaningful differences in educational experiences and/or outcomes among the six Carnegie classifications.
RESULTS Differences Among Measured Variables ANOVA procedures identified several statistically significant differences among scores on the measured variables for the six Carnegie types. Means, F ratios, and eta-squared coefficients for all of the measured variables are presented in Table 2. Statistically significant differences among the groups were found for all five measures of student background characteristics, the four academic involvement measures, two of the three social involvement measures, both environment measures, and reported gains in general education. In general, differences among groups accounted for about 2% of the variance in the measured variables. Group differences in the proportions of freshmen in the groups accounted for more than 12% of the variance for this measure. An examination of the means for students in the six Carnegie classifications revealed that females tended to be overrepresented in the Doctoral/ResearchIntensive group (0.70) and underrepresented in the Baccalaureate General Col-
INSTITUTIONAL MISSION, STUDENTS’ INVOLVEMENT AND OUTCOMES
251
TABLE 2. Means and ANOVA Results for Measures of Background, College Experiences, and Gains by Carnegie Type Measure FEMALE*** MINORITY*** ADV DEGREE*** PAR GRAD*** FRESHMAN*** LIBRARY*** ACT/COLL*** WRITING** FACULTY*** PERSONAL*** STUDENTS*** TOPICS ACAD ENVIR*** INTR ENVIR** ACAD INTEG SOCL INTEG GEN EDUC** COMMUNICAT INTERPERSNL INTELCTUAL
D/R-E
D/R-I
M-I
M-II
BLA
BGC
Eta2
0.62 0.22 0.74 0.28 0.61 2.09 2.31 2.73 2.27 2.62 2.61 2.40 5.35 5.14 2.96 2.53 2.46 2.93 2.94 3.04
0.70 0.24 0.70 0.39 0.60 2.08 2.27 2.65 2.24 2.62 2.61 2.35 5.14 5.19 2.90 2.48 2.39 2.91 2.90 2.89
0.68 0.11 0.64 0.41 0.39 2.06 2.29 2.59 2.25 2.48 2.53 2.34 5.13 5.25 2.90 2.49 2.35 2.88 2.93 2.94
0.60 0.10 0.58 0.46 0.52 2.24 2.45 2.70 2.44 2.46 2.48 2.33 5.15 5.40 2.95 2.53 2.32 2.92 2.93 2.89
0.69 0.18 0.72 0.28 0.84 2.24 2.48 2.78 2.53 2.62 2.73 2.42 5.53 5.32 3.00 2.60 2.62 2.95 2.98 2.98
0.54 0.15 0.57 0.56 0.28 2.00 2.39 2.62 2.40 2.46 2.56 2.34 5.21 5.47 2.92 2.48 2.37 2.97 2.94 2.96
0.02 0.02 0.02 0.04 0.12 0.02 0.02 0.01 0.02 0.01 0.01 0.00 0.02 0.01 0.00 0.00 0.02 0.00 0.00 0.00
Notes: FEMALE = Female Student, MINORITY = Minority Student, ADV DEGREE = Pursue Advanced Degree, PAR GRAD = Parents Did Not Graduate From College, FRESHMAN = Freshman Student, LIBRARY = Library Experiences, ACT/COLL = Active and Collaborative Learning, WRITING = Writing Experiences, FACULTY = Interaction with Faculty, PERSONAL = Personal Experiences, STUDENTS = Interaction with Students, TOPICS = Topics of Conversation, ACAD ENVIR = Perceptions of Academic Environment, INTR ENVIR = Perceptions of Interpersonal Environment, ACAD INTEG = Academic Integration, SOCL INTEG = Social Integration, GEN EDUC = Gains in General Education, COMMUNICAT = Gains in Communication Skills, INTERPERSNL = Gains in Interpersonal Skills, INTELCTUAL = Gains in Intellectual Skills; D/R-E = Doctoral/Research-Extensive Universities, D/R-I = Doctoral/Research-Intensive, M-I = Master’s I Universities, M-II = Master’s II Universities, BLA = Baccalaureate Liberal Arts Colleges, BGC = Baccalaureate General Colleges. *p < 0.05; **p < 0.01; ***p < 0.001
lege group (0.54). Minority students tended to be underrepresented in the Masters’ I group (0.10) and slightly overrepresented in both the Doctoral/ResearchExtensive and the Doctoral/Research-Intensive groups (0.22 and 0.24, respectively). Students intending to pursue advanced degrees tended to be overrepresented in both doctoral/research groups and the Baccalaureate Liberal Arts group (0.74, 0.70, and 0.72, respectively). First-generation students tended to be
252
PIKE, KUH, AND GONYEA
overrepresented among the students at Baccalaureate General Colleges (0.56) and substantially underrepresented among students at Doctoral/Research-Extensive universities (0.28) and Baccalaureate Liberal Arts colleges (0.28). Freshmen were overrepresented in the sample of students from Baccalaureate Liberal Arts colleges (0.84) and underrepresented in the sample of students from Baccalaureate General Colleges (0.28). First-year students also tended to be underrepresented in the sample of students attending Master’s I institutions (0.39). Students in the Baccalaureate Liberal Arts group reported the highest levels of involvement on all four of the measures representing academic involvement and all three measures representing social involvement. These students also held substantially more positive views of the academic environment than did students in any other group. Students attending Baccalaureate Liberal Arts and Baccalaureate General Colleges had positive perceptions of the social environment. Students at Baccalaureate Liberal Arts colleges also reported the greatest gains in general education outcomes. Tests of the Conceptual Model Goodness-of-fit tests indicated that the conceptual model did not provide an acceptable representation of the relationships among the observed variables (χ2 = 1252.20; df = 130; p < 0.001; RMSEA < 0.08; SRMR < 0.05). Because the cutoff value RMSEA was exceeded, modification indexes were examined to determine if the inclusion of bivariate correlations among uniquenesses would improve model fit. T values for the effect coefficients also were examined to determine if it was possible to eliminate nonsignificant relationships between latent constructs. Examination of the modification indexes identified five bivariate relationships that should be included in the model. The relationships between active and collaborative learning and both interaction with faculty members and academic integration, the relationship between interactions with students and academic integration, and the relationships between topics of conversations and both social integration and gains in general education were included in the model. In addition, an examination of the t values for the model indicated that all of the effects of background characteristics on gains could be eliminated from the model. T values also indicated that the effects on integration of all background characteristics, except class level, could be eliminated from the model. The effects of ethnicity on perception of the environment and first-generation status on academic involvement also were removed from the model. Several of the relationships among the college experience and gains constructs also were removed. In the revised model, gains were directly related to perceptions of the college environment and the integration of experiences, but not academic and social involvement. Academic and social involvements were directly related to
INSTITUTIONAL MISSION, STUDENTS’ INVOLVEMENT AND OUTCOMES
253
integration, and thereby were indirectly related to gains in learning and intellectual development. Goodness-of-fit results indicated that the revised model did provide an acceptable representation of the relationships among the measured variables (χ2 = 909.17; df = 147; p < 0.001; RMSEA < 0.06; SRMR < 0.05). This model is shown in Fig. 2. An examination of the factor loadings for the measurement model also indicated that the revised model represented an acceptable representation of latent constructs. All measured variables had significant factor loadings on the latent variables they were intended to represent, and were not related to the other latent variables. In addition, the relationships between latent constructs, shown in Table 3, were consistent with expectations. Estimates of explained variance were also within acceptable tolerances. Squared multiple correlations for the structural equations were 0.06 for academic involvement, 0.05 for social involvement, 0.02 for perceptions of the college environment, 0.95 for integration of diverse college experiences, and 0.62 for reported gains in learning and intellectual development. From the direct and indirect effects displayed in Table 3, gender (being female) appears to positively affect academic involvement, social involvement, and perceptions of the college environment. Gender had positive indirect effects on both integration and reported gains. Similarly, ethnicity (being a member of a minority group) was positively related to both academic and social involvement. Being a minority group member also had positive indirect effects on integration and reported gains. Aspiring to obtain an advanced degree was positively
FIG. 2. Relationships in the final model.
254
PIKE, KUH, AND GONYEA
TABLE 3. Direct and Indirect Effect Parameters for the Relationships Among Background Characteristics, College Experiences, and Gains ACAD_INV SOCL_INV COLL_ENV INTEGRAT FEMALE (Direct) (Indirect) MINORITY
0.09**
0.14***
0.08*
0.12***
0.07*
0.00
EDUC ASPIR
0.17***
0.14***
0.10**
FIRST GEN
0.00
−0.06*
0.00
FRESHMAN
−0.10**
0.00
0.06*
ACAD INVOLVE
0.00 0.11*** 0.00 0.10‡ 0.00 0.16*** 0.00 −0.03** −0.07* −0.05*** 0.53***
SOCL INVOLVE
0.49***
COLL ENVIRON INTEGRATION Squared Multiple Correlation
0.06
0.05
0.02
0.95
GAINS 0.00 0.09*** 0.00 0.05‡ 0.00 0.12*** 0.00 −0.02** 0.00 −0.04** 0.00 0.28*** 0.00 0.26*** 0.40*** 0.53*** 0.62
Notes: FEMALE = Gender of Student, MINORITY = Ethnicity of Student, EDUC ASPIR = Educational Aspirations of Student, FIRST GEN = First-Generation Student, FRESHMAN = Freshman Student, ACAD INVOLVE = Academic Involvement, SOCL INVOLVE = Social Involvement, COLL ENVIRON = Perceptions of the College Environment, INTEGRATION = Integration of Experiences, GAINS = Gains in Learning and Intellectual Development. *p < 0.05; **p < 0.01; ***p < 0.001.
related to academic involvement, social involvement, and perceptions of the college environment. Educational aspirations also had positive indirect effects on integration and gains in learning and intellectual development. Being a firstgeneration college student was negatively related to social involvement and had negative indirect effects on both integration and gains. Being a freshman was negatively related to academic involvement and integration, but positively related to perceptions of the college environment. Being a first-year student also had negative indirect effects on both integration and gains. Consistent with expectations, academic and social involvement had substantial positive direct effects on integration and were indirectly related to gains. Contrary to expectations, academic and social involvement were not directly related to gains. Perceptions of the college environment and integration of academic and social
INSTITUTIONAL MISSION, STUDENTS’ INVOLVEMENT AND OUTCOMES
255
experiences had substantial positive effects on gains in learning and intellectual development. Tests of Invariance Across Groups Goodness-of-fit results for the model in which all measurement and effects parameters were invariant across the six Carnegie groups revealed that this very restrictive model provided an acceptable explanation of the relationships among the measured variables (χ2 = 2174.73; df = 1197; p < 0.001; RMSEA < 0.06; SRMR < 0.08). This finding indicated that there were no significant differences in either the measurement model or the structural equation model across the six Carnegie types and that analysis could proceed to an examination of differences in means and intercepts for the structural equations. Tests of Means and Intercepts Goodness-of-fit results revealed that the model in which student background means were free to vary across Carnegie types, but intercepts were invariant across the Carnegie groups, provided an acceptable representation of the observed data (χ2 = 2441.14; df = 1272; p < 0.001; RMSEA < 0.07; SRMR < 0.08). Therefore, no additional modifications were made to the model. The fact that intercepts were invariant across groups indicated that differences in institutional missions were not related to differences in students’ college experiences and gains in learning and intellectual development when controlling for differences in the background characteristics of students. DISCUSSION Three sets of findings emerged from this study. First, students attending different types of colleges and universities reported having significantly different patterns of experiences in college. Students differed in terms of their academic involvement, social involvement, and perceptions of the college environment. They did not differ in their integration of diverse experiences and, with the exception of general education, did not differ in gains made during college. Students attending different types of institutions also had very different backgrounds. Moreover, the results of the final phase of this research indicated that differences in students’ backgrounds were responsible for the observed differences in reported college experiences. The second set of findings to emerge from the present research underscored the utility of the conceptual model of student experiences and gains. The model accurately represented the relationships among the components of involvement, perceptions of the college environment, integration, and gains. In addition, these
256
PIKE, KUH, AND GONYEA
relationships were stable across different types of institutions. Results also supported the presumed causal ordering of components in the model. Gains in learning and intellectual development were directly related to integration of diverse experiences and perceptions of the college environment. Academic and social involvement were indirectly related to gains by virtue of their relationships with integration. That is, the effects of involvement were mediated by integration— the extent to which they brought together diverse experiences from courses and other learning activities in their conversations with peers and others. The strength and direction of the relationships among background characteristics, college experiences, and gains were a third set of findings to emerge from this research. Females, minority students, and students with educational aspirations beyond a baccalaureate degree tended to be more involved and have more positive perceptions of the college environment. As a result, these students reported greater gains in learning and intellectual development. Being a first-generation college student was negatively related to social involvement and indirectly associated with lower levels of integration and gains. Although this finding is not surprising, it does underscore the need for faculty members, student life personnel, and others to be as intentional as possible in creating opportunities for students who lack tacit knowledge and experience with college life to connect with their peers through the formal extracurricular and other institutional structures. First-year students who reported lower levels of involvement had more positive perceptions of the college environment. But these positive perceptions of the campus environment were not sufficient to offset the negative effects on gains of low levels of involvement by first-year students. Limitations Care should be taken not to overgeneralize the results of this research. Although the findings indicated that there are not significant differences by Carnegie type, the full range of Carnegie classifications, including 2-year institutions, was not captured. Research by Strauss and Volkwein (2002) has found important differences between 2- and 4-year institutions. Moreover, Toutkoushian and Smart (2001) found small, but significant, differences among 4-year institutions. Clearly, more research is needed to understand the effects of institutional mission on students’ college experiences and learning outcomes. Although the participants in this study were a stratified random sample of CSEQ respondents, and were generally representative of CSEQ respondents nationally, the participants were not a random sample of students at their respective institutions. It was not possible to assess the extent to which respondent/nonrespondent biases existed in these data. Consequently, it cannot be said with certainty that the findings of this research can be generalized to all college students.
INSTITUTIONAL MISSION, STUDENTS’ INVOLVEMENT AND OUTCOMES
257
A third limitation of this study is using Carnegie institutional type to represent institutional mission. Missions of colleges and universities within Carnegie types vary widely, particularly in the Master’s and General College categories. Thus, there are surely distinctive aspects of institutional mission that are not taken into account in this study that could well affect students in ways that differ from the major findings of this study. Another limitation is the operational definition of ethnicity used in this study. There is ample evidence that the college experiences of different minority groups can vary substantially. Grouping all minority students together obscured those differences in this study. Additional research is needed to determine the extent to which the CSEQ is sensitive to differences in the experiences of students from different ethnic groups. Also, this study relied on self-reports of students’ college experiences and gains in learning and intellectual development. Although there is ample evidence that students’ self-reports of their college experiences tend to be accurate, we must interpret with caution student self-reports about their learning. Specifically, Pascarella (2001b) pointed out that self-reported gains in learning may be influenced by individual differences attributable to students’ entering abilities. Thus, self-reports of gains in learning and intellectual development may overstate the effects of students’ experiences during college. Finally, it is not clear whether this study was entirely successful in overcoming the limitations of previous research identified by Pascarella and Terenzini (1991). The sample institutions used in this research may not have reflected the full variance in institutions across Carnegie classification. In fairness, however, it may also be true that there is relatively little variance in institutions, even colleges and universities with substantially different stated missions. Implications Despite these limitations, the results of the present research do have important implications for scholarship and practice. For example, the results of this research run counter to the conventional wisdom that minority students attending predominantly white institutions are likely to be less involved than majority students. In fact, white males appear to be more at risk of being less involved than minority students, in that white males are less involved in educationally purposeful activities than any other group. It is somewhat ironic that though colleges were designed with white males in mind and that for decades the experiences of men dominated the college student development literature (Heath, 1968; Katz and Associates, 1968; Perry, 1970; Sanford, 1962), white men today on many campuses appear to be among the higher risk groups, making their experiences a potentially fruitful area for future research. The negative effects on involvement of being a first-generation student again
258
PIKE, KUH, AND GONYEA
confirm that these students deserve special attention, both in educational practice and in institutional research. The much lower levels of social involvement for first-generation students may be the results of these students’ concerns about succeeding academically (Terenzini et al., 1994). Low levels of social involvement may reflect first-generation students focusing a disproportionate amount of their energy on academic matters. Institutional researchers and practitioners should investigate whether greater emphasis on the social involvement of firstgeneration students is warranted. It is also a challenge to develop ways to engage first-year students in educationally purposeful activities at levels that promote success in college. The results of this research are generally consistent with recent national surveys of college student engagement that show first-year students are less engaged, but more positive in their perceptions of the environment, than students in their second and subsequent years of college (Indiana University Center for Postsecondary Research and Planning, 2001). Scholars and practitioners should continue to seek ways to structure anticipatory socialization experiences and firstyear learning communities and related programs (e.g., freshman interest groups) to intentionally engage first-year students at higher levels from their first days on campus. As Terenzini and Pascarella (1994) noted, a recurring myth of undergraduate education is that academic involvement is more strongly related to learning and intellectual development than social involvement. That academic and social involvements have virtually the same positive effects on integration and gains provides additional support for Terenzini and Pascarella’s argument and underscores the importance of balance in students’ educational experiences. Even more important than the levels of academic and social involvement is the integration of these diverse experiences in ways that increase learning and intellectual development. This finding is consistent with previous research using Chickering’s model (Pike and Killian, 2001) and suggests that, rather than trying to increase involvement, scholars and practitioners should seek to identify ways in which the integration of experiences can be improved. This will not be a simple task. Research has also shown that levels of integration tend to be unaffected by a variety of academic and social contexts. Even academic interventions, such as residential learning communities, and the powerful contexts of academic disciplines, have relatively little effect on integration. CONCLUSION Does the mission of an institution influence the nature of students’ college experiences, as well as their learning and intellectual development? The results of the present research indicate that even institutional differences as fundamental as Carnegie type are not directly related to differences in students’ college expe-
INSTITUTIONAL MISSION, STUDENTS’ INVOLVEMENT AND OUTCOMES
259
riences and gains in learning. Differences in reported college experiences and gains in learning across Carnegie classifications are the result of differences in the characteristics of students attending the various types of institutions. In the end, broad institutional effects on student experiences and self-reported learning gains appear to be minimal. Thus, institutional effects on student experiences and learning gains—to the extent they exist—may be more a function of the background characteristics of students who enroll (and perhaps influenced by institutional reputation and admissions policies) than institutional policies and practices. This is not to say that colleges and universities do not affect students’ learning and intellectual development. The direct and indirect effects of students’ college experiences on their gains provide convincing evidence that what happens in college does make a difference. Instead, what these findings suggest is that the nature of students’ educational experiences varies substantially from campus to campus. Broad descriptors of institutional mission, such as the Carnegie classifications, are not sufficiently rich to capture the varied ways in which colleges affect students. ACKNOWLEDGMENTS This article was originally presented at the annual meeting of the Association for Institutional Research, Toronto, Canada, June 2002. REFERENCES Astin, A. (1968). Undergraduate achievement and institutional “excellence.” Science 161: 661–668. Astin, A. (1969). What goes into academic planning? New research has implications for academic planning and the quest for “excellence. Coll. Univ. Bus. 47(2): 31–33. Astin, A. (1970). The methodology of research on college impact (I). Sociol. Educ. 43: 223–254. Astin, A. (1971). Open admission and programs for the disadvantaged. J. Higher Educ. 42: 629–647. Astin, A. (1985). Achieving Educational Excellence: A Critical Assessment of Priorities and Practices in Higher Education, Jossey-Bass, San Francisco. Astin, A. (1993). What Matters in College? Four Critical Years Revisited, Jossey-Bass, San Francisco. Astin, A., and Panos, R. (1969). The Educational and Vocational Development of College Students, American Council on Education, Washington, DC. Baird, L. (1976). Using Self-Reports to Predict Student Performance, The College Board, New York. Berdie, R. (1971). Self-claimed and tested knowledge. Educ. Psychol. Meas. 31: 629– 636. Chickering, A. (1972). Undergraduate educational experience. J. Educ. Psychol. 63: 134– 143.
260
PIKE, KUH, AND GONYEA
Chickering, A. (1974). Commuting Versus Residential Students: Overcoming Educational Inequities of Living off Campus, Jossey-Bass, San Francisco. Davis, T. M., and Murrell, P. H. (1993). A structural model of perceived academic, personal, and vocational gains related to college student responsibility. Res. Higher Educ. 34: 267–290. Feldman, K. A., and Newcomb, T. (1969). The Impact of College on Students, JosseyBass, San Francisco. Heath, D. (1968). Growing Up in College, Jossey-Bass, San Francisco. Hu, L., and Bentler, P. M. (1998). Fit indices for covariance structure modeling: Sensitivity to underparameterized model misspecification. Psychol. Methods 3: 424–453. Hu, L., and Bentler, P. M. (1999). Cutoff criteria for fit indexes in covariance structure analysis: Conventional criteria versus new alternatives. Struct. Equ. Model. 6: 1–55. Indiana University Center for Postsecondary Research and Planning (2000). The NSSE 2000 Report: National Benchmarks of Effective Educational Practice, Author, Bloomington, IN. Indiana University Center for Postsecondary Research and Planning (2001). Improving the College Experience: National Benchmarks of Effective Educational Practice, Author, Bloomington. Jo¨reskog, K. G., and So¨rbom, D. (1999). LISREL 8.3, Scientific Software, Chicago. Katz, J., Korn, H., Ellis, V., Madison, P., Singer, S., Lozoff, M., et al. (1968). No Time for Youth: Growth and Constraint in College Students, Jossey-Bass, San Francisco. Kuh, G., Hayek, J., Carini, R., Ouimet, J., Gonyea, R., and Kennedy, J. (2001). NSSE Technical and Norms Report, Indiana University Center for Postsecondary Research and Planning, Bloomington. Kuh, G., and Hu, S. (2001a). Learning productivity at research universities. J. Higher Educ. 72: 1–28. Kuh, G., and Hu, S. (2001b). The effects of student-faculty interaction in the 1990s. Rev. Higher Educ. 24: 309–332. Kuh, G., and Siegel, M. (2000). College Student Experiences Questionnaire: Tentative Norms for the Fourth Edition, Center for Postsecondary Research and Planning, Indiana University, Bloomington. Kuh, G. D., Vesper, N., Connolly, M. R., and Pace, C. R. (1997). College Student Experiences Questionnaire: Revised Norms for the 3rd Edition, Center for Postsecondary Research and Planning, Indiana University, Bloomington. McCormick, A. (2000). Bringing the Carnegie classification into the 21st century. AAHE Bull. 52(5): 3–6. McDonough, P., Antonio, A., Walpole, M., and Perez, L. (1998). College rankings: Democratized college knowledge for whom? Res. Higher Educ. 39: 513–537. Nichols, R. (1964). Effects of various college characteristics on student aptitude test scores. J. Educ. Psychol. 55: 45–54. Pace, C. R. (1984). Measuring the Quality of College Student Experiences, University of California Center for the Study of Evaluation, Los Angeles. Pace, C. R. (1985). The Credibility of Student Self-Reports, Center for the Study of Evaluation, University of California Los Angeles, Los Angeles. Pace, C. R. (1990). The Undergraduates: A Report of Their Activities and Progress in the 1980s, Center for the Study of Evaluation, University of California Los Angeles, Los Angeles. Pace, C. R. (1995). College Student Experiences Questionnaire: Norms for the Third Edition, 1990, Center for Postsecondary Research and Planning, Indiana University, Bloomington.
INSTITUTIONAL MISSION, STUDENTS’ INVOLVEMENT AND OUTCOMES
261
Pace, C. R., and Kuh, G. (1998). College Student Experiences Questionnaire, Fourth Edition, Center for Postsecondary Research and Planning, Indiana University, Bloomington. Pascarella, E. (1985). College environmental influences on learning and cognitive development: A critical review and synthesis. In: Smart, J. (ed.), Higher Education: Handbook of Theory and Research (Vol. 1). Agathon, New York, pp. 1–61. Pascarella, E. (2001a). Identifying excellence in undergraduate education: Are we even close? Change 33(3): 18–23. Pascarella, E. (2001b). Using student self-reported gains to estimate college impact: A cautionary tale. J. Coll. Stud. Dev. 42: 488–492. Pascarella, E., and Terenzini, P. (1991). How College Affects Students: Findings and Insights from Twenty Years of Research, Jossey-Bass, San Francisco. Perry, W. G., Jr. (1970). Forms of Intellectual and Ethical Development in the College Years: A Scheme, Holt, Rinehart & Winston, New York. Pike, G. (1995). The relationship between self reports of college experiences and achievement test scores. Res. Higher Educ. 36: 1–21. Pike, G. (1999). The effects of residential learning communities and traditional residential living arrangements on educational gains during the first year of college. J. Coll. Stud. Dev. 38: 609–621. Pike, G. (2000). The influence of fraternity or sorority membership on students’ college experiences and cognitive development. Res. Higher Educ. 41: 117–139. Pike, G., and Killian, T. (2001). Reported gains in student learning: Do academic disciplines make a difference? Res. Higher Educ. 42: 429–454. Pohlmann, J., and Beggs, D. (1974). A study of the validity of self-reported measures of academic growth. J. Educ. Meas. 11: 115–119. Sanford, N. (ed.) (1962). The American College. A Psychological and Social Interpretation of the Higher Learning, Wiley, New York. Strauss, L. C., and Volkwein, J. F. (2002). Comparing student performance and growth in 2- and 4-year institutions. Res. Higher Educ. 43: 133–162. Taylor, B., and Massey, W. (1996). Strategic Indicators for Higher Education, Peterson’s, Princeton, NJ. Terenzini, P., and Pascarella, E. (1994). Living with myths: Undergraduate education in America. Change 26: 28–32. Terenzini, P., Rendon, L., Upcraft, M. L., Millar, S., Allison, K., Gregg, P., et al. (1994). The transition to college: Diverse students, diverse stories. Res. Higher Educ. 35: 57–74. Toutkoushian, R., and Smart, J. (2001). Do institutional characteristics affect student gains from college? Rev. Higher Educ. 25: 39–62. Weidman, J. (1989). Undergraduate socialization: A conceptual approach. In: Smart, J. (ed.), Higher Education: Handbook of Theory and Research (Vol. 5), Agathon, New York, pp. 289–322. Winter, D., McClelland, D., and Stewart, A. (1981). A New Case for the Liberal Arts: Assessing Institutional Goals and Student Development, Jossey-Bass, San Francisco.