Soil-Test Biological Activity Relevance and Guidance for Nitrogen Management in Corn 2018-01
Alan Franzluebbers USDA-Agricultural Research Service 3218 Williams Hall NCSU Campus Box 7620 Raleigh NC 27695 Tel: 919-515-1973 Email:
[email protected]
The nitrogen (N) dilemma
Plant-available N
Nitrogen (N) is the most limiting nutrient for the production of corn. Without sufficient N, yield potential suffers. However, too much N can unnecessarily raise production costs and reduce profit, as well as become a pollutant to the environment. At either extreme, farmers lose out on economic opportunities and may even lose money.
Yield of corn (or any other non-leguminous grain crop) is a non-linear function of the amount of N available to that crop. Sources of available N are from inorganic N [i.e. nitrate (NO3-) or ammonium (NH4+)] and organic N (i.e. N bound to organic matter through chemical bonds). Inorganic N of surface soil (e.g. 0-6” depth) is easily measured through traditional soil testing. Inorganic N deep in the profile is more laborious to obtain due to physical extraction of a representative portion of the field at these lower depths.
How are N management decisions made? The current assumption is that corn grain requires 1.2 pounds of N for every bushel of grain to be produced. This assumption works for some soils and regions, but data from a recent study conducted on farms throughout North Carolina and Virginia suggests that this assumption of 1.2 lb of N is most applicable for soils pulverized to near death with tillage. It essentially ignores N from organic matter. Is there a better way? Knowing the potential of soil to mineralize N from organic matter would be a step in the right direction to improve N fertilizer recommendations. Traditionally, estimating this pool of mineralizable N was laboriously accomplished with incubation of soil under ideal temperature and moisture conditions in the laboratory. A result might be expected within a couple of months to almost a year. New research has shown that this pool of mineralizable N can be accurately predicted within a week of sampling soil from the field.
Organic N can now be estimated with soiltest biological activity, which is primarily associated with decomposition of relatively recent organic matter inputs. Biologically active organic matter comes from recent plant residues decomposing slowly at the surface of soils managed with no-till, from animal manures, and from roots exploring the surface soil such as from cover crops.
What is soil-test biological activity?
Are some soil types relevant and others not?
Soil-test biological activity is a short-term test of soils’ ability to decompose recent organic matter inputs. It is estimated from capturing carbon dioxide (CO2) from a sample during a 3-day period. Soil is first dried and sieved so that a representative and standardized condition can be given to all samples tested. The flush of CO2 that is captured during the first 3 days of incubation relates to soil microbial biomass and to recent organic matter resources present within a soil.
Soil texture is often a key consideration when making nutrient recommendations. Research has shown that clayey soils are more likely to contain greater soil N mineralization than sandy soils. The predictive relationship between soil-test biological activity and soil N availability is not altered by soil texture. This means that soiltest biological activity can be used in sandy to clayey soils without adjustment.
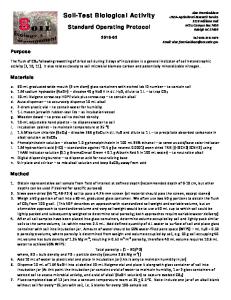
How is soil-test biological activity related to N availability? Soil is living! Just like carbon (C) is a part of all living things, so too is N. If enough C accumulates, soil organisms will cycle sufficient N from decaying organic materials into plant-available form. Soil is healthy when microorganisms contained within it are working and not exhausted from lack of food – soil needs continual C inputs to be healthy. Biologically active soil has high N mineralization, i.e. the conversion of organic matter into inorganic N. We can predict the ability of soil to supply N to a crop by determining soil-test biological activity. 120 PNU = 13.8 + 0.125 * STBA 2 r = 0.76
90
Plant Nitrogen 60 Uptake . -1 (mg kg soil) 30
0 0
200
400
600
Soil-Test Biological Activity (mg CO2-C . kg-1 soil)0-3 d
800
How do I get greater soil-test biological activity? Conservation agricultural practices that follow soil health principles will lead to greater soil-test biological activity over time. Several years of some practices will be needed to change soil to a more healthy state. If you haven’t started, the best time is now. Soil health principles include: (1) minimize soil disturbance, (2) keep soil covered, (3) maximize living roots, and (4) energize with diversity. Some key practices include no tillage or other conservation tillage, cover cropping, diverse crop rotations, manure application, and systematic integration of crops and livestock. Can I really save money when aiming for optimum yield? Assuming a realistic yield goal of 150 bu/acre, N fertilizer of 180 lb N/acre might be recommended with a traditional approach. If soil-test biological activity were high (>300 mg/kg/3d), then N fertilizer would be reduced to only 90 lb N/acre. Field testing has shown that this scenario often yields the same as the traditional approach. This would be a savings of $45/acre if cost of N fertilizer were $0.50/lb N.
Show me the data… From 2014 to 2016, corn yield response trials to applied N were conducted on 47 fields. The hypothesis was that if N were limiting, then applied N would result in a large increase in corn yield. Alternatively, if N were not limiting, then applied N would not affect yield. Soil-test biological activity (and other indicators of N availability) were measured on each field to indicate inherent N supply from soil, as influenced by historical management of the field. The results are shown below when field sites were sorted by similar soil-test biological activity. STBA Sites NMIN RY YEONR EONR 0-100 3 34 0.63 107 91 101-200 7 46 0.55 210 153 201-300 5 61 0.50 215 178 301-400 12 98 0.80 174 77 401-500 7 119 0.90 184 70 >500 2 127 0.98 108 0 STBA = Soil-test biological activity (mg C/kg/3 d) Sites = Grain sites (11 silage sites not included) NMIN = Nitrogen mineralization (mg N/kg/24 d) RY = Relative yield (without N/with N) YEONR = Grain yield (bu/acre) at EONR EONR = Economically optimum N rate
Sites were distributed throughout the Coastal Plain or NC, Piedmont of NC and VA, and Shenandoah Valley of VA.
Viewed in another way, only soils that had low soil-test biological activity behaved like the traditional model of requiring 1.2 lb N/bu grain. Soils with increasingly greater soil-test biological activity had N factor values that approached zero. 1.2 Cost-to-value threshold of 5 lb grain lb-1 N (NF = 1.32 - 0.0023 * STBA)
1.0
Nitrogen Factor for Economically 0.6 Optimum Production 0.4 . -1 (lb N bu grain) 0.8
0.2 0
100
200
300
400
500
0.0 600
Soil-Test Biological Activity (mg CO2-C . kg-1 soil . 3 d-1)0-4 inch depth
Summary The greater the supply of soil mineralizable N, the lower the corn yield response to N application. Supply of N in the surface foot of soil was only partially derived from residual inorganic N and most dominantly from mineralization of biologically active organic matter, which was especially concentrated in the surface 4” of most soils due to history of conservation management. Soil N supply was positively associated with relative grain and silage yield without sidedress N as compared with non-limiting N supply. As a rapid, reliable, and robust surrogate of soil N supply, soil-test biological activity from the flush of CO2 effectively indicated relative yield, yield response to N fertilizer input, and economically optimum N fertilizer requirement. Additional field studies are being conducted to validate the approach. This field calibration set with a soil biological indicator of N availability will be an important step towards more efficient natural resource utilization in agricultural landscapes.
Practical guidance for soil-test biological activity sampling Which fields? Many fields are appropriate – dryland or irrigated, lowland or upland, without cover or with cover crop, and most any soil texture. Crop rotations can be diverse or simple. Theoretically, testing will work with any tillage management, but it has been calibrated primarily for fields under no-till. When to sample? Sample soil in spring just prior to or soon after planting corn. Ideally, manure applications will have been made several weeks prior to sampling and only minimal starter N applied at or prior to planting. All N applications after sampling should be accounted in the total N recommendation package going forward, but manure, fertilizer, and legume prior to sampling should be considered embedded in the soiltest biological activity estimate of N availability. Management details and timing should be recorded, if at all possible. How to sample? Soil depth matters, so only the 0-4” sampling depth should be collected. A preferable sampling device is a 1” or greater diameter core. Surface residue should be pushed aside prior to coring, but don’t remove any mineral soil. Well-decomposed surface litter should be considered a part of the soil. Particles greater than the size of your fingernail can be considered surface residue and should not be part of the sample. Multiple cores should be composited to represent a field. A zig-zag pattern of ~20 cores across a field may be appropriate. Composite up to a pound of soil in a bucket. Transfer soil to a labeled sampling box, paper bag, or plastic bag.
How to handle soil samples? Multiple samples collected during the day should be protected from sunlight exposure to avoid overheating. On the day of sample collection, soils should be dried at 60 to 90 °F. Protect samples from excessive dust and contamination from animals. Ideally, samples will be transferred to a paper plate to allow the sample to dry fast with the aid of a fan blowing over samples (up to a day or two). There is no need to break apart soil clods. Once samples are reasonably dry, transfer soil into labeled cardboard box, paper bag, or plastic bag. Ship samples to analytical laboratory in small box. In the laboratory Unpack and transfer labeled information to a spreadsheet. Samples in cardboard boxes or paper bags should be placed in forced-air oven at 55 °C overnight to ensure complete dryness of the sample. Samples in plastic bags must be transferred to a paper bag or wide open-top container to dry completely. After dried, soil should be hand-sieved to <4.75 mm or rolled to <2 mm to obtain homogenous sample for subsampling. Soil incubation Wet soil to 50% water-filled pore space and incubate at 77 °F (25 + 1 °C) for 3 days. Determine CO2-C evolved according to standard methods, which can be found at: 1. Franzluebbers (2016) Agric. Environ. Lett. 1:150009, doi:10.2134/ael2015.11.0009. 2. https://www.wardlab.com/haneyinfo.php 3. https://soilhealth.cals.cornell.edu/trainin g-manual/