AMERICAN JOURNAL OF HUMAN BIOLOGY 10:747–756 (1998)
Second Metacarpal Cross-Sectional Geometry: Rehabilitating a Circular Argument RICHARD A. LAZENBY* Anthropology Program, University of Northern British Columbia, Prince George, British Columbia, Canada
ABSTRACT Radiogrammetry of the second metacarpal has long served as a measure of normal and abnormal bone growth and aging, functional asymmetry, and fracture risk in osteoporosis. The method relies on algebraic interpretation (circular or elliptical models) of uni- or biplanar radiographic images. This paper tests the conformance of these models with actual measures of metacarpal geometric variation in a sample of 356 bones from an historic archaeological sample. Both the circular and elliptical models significantly over-estimate actual values for all variables (e.g., total area (3.05% and 9.42%, respectively) and cortical area (7.25% and 12.25%), bending rigidity about the mediolateral (13.88% and 20.92%) and anteroposterior axes (17.35% for the elliptical model). The greater degree of systematic bias found for the elliptical model is contrary to results of an earlier study (Lazenby, 1997), and suggests that sample composition can influence the method error associated with a particular approach. The import of radiogrammetric bias will depend on the degree of shape variation among samples compared (e.g., left vs right, male vs female, etc.), which in most cases cannot be predetermined. Consequently, reduced major axis equations were derived from regressing actual on estimated values for total area (TA), cortical area (CA) and two measures of bending rigidity (Ix, Iy) in order to permit adjustment for radiogrammetric error associated with these algebraic models. Application of these formulae to a hold-out sample showed no significant differences between actual and predicted values. Am. J. Hum. Biol. 10:747–756, 1998. © 1998 Wiley-Liss, Inc.
Cross-sectional geometric properties for tubular bones such as the second metacarpal, radius, femur and others serve as gauges of bone mass (e.g., total area, cortical area, combined cortical thickness, and percent cortical thickness and area) and strength (bending and torsional moments of area). Over the past four decades, estimates of these properties using radiogrammetric methods have proven useful in a wide variety of investigative contexts, including the study of bone growth (Himes and Huang, 1993; Plato et al., 1984) and aging (Aguado et al., 1997; Garn et al., 1992; Kusec et al., 1988); functional and pathophysiological analysis of bilateral asymmetry and lateral hand dominance (Plato et al., 1980; Fox et al., 1995; Roy et al., 1994; Trinkaus et al., 1990, 1994); ontogenetic and phylogenetic
© 1998 Wiley-Liss, Inc.
PROD #770
interpretations of bone size and shape (Ruff et al., 1993, 1994; Runestad et al., 1993); and as reliable and cost-effective indicators of fracture risk in osteoporosis (Meema and Meindok, 1992; Wishart et al., 1993). For a variety of purposes, bones of the distal forearm and hand (i.e., radius and metacarpals) have proven to be a popular site for evaluating bone mass, reflecting the facility with which radiographic images can be obtained for this region while exposing subjects to a minimal radiation load, as well as
Contract grant sponsor: UNBC, Natural Sciences and Engineering Research Council of Canada, Contract grant number: OGP 0183660. *Correspondence to: Richard A. Lazenby Ph.D., University of Northern British Columbia, Prince George, British Columbia, Canada, V2N 4Z9. E-mail:
[email protected] Received 19 August 1997; Accepted 27 November 1997
748
R.A. LAZENBY
providing clearer images as a result of less soft-tissue interference. Although some studies of living peoples choose to measure multiple bones from this region (e.g., Kusec et al., 1988), this may not be necessary. Garn et al. (1991) have shown that data from the second metacarpal alone can be representative of the hand in general, thus disputing the necessity of the added time and expense of collecting what may be essentially ‘redundant’ information from additional sites. Historically, the study of geometric variation from standard posteroanterior hand-wrist radiographs has involved estimation of geometric properties such as areas and moments of area from an effectively one-dimensional image of the diaphysis. This has been achieved by applying an algebraic model reflecting an assumed1 cylindrical shape of the diaphysis and a circular cross-sectional geometry (Garn, 1970). Cortical area, for example, can be determined as 0.785* (Total Width2 − Medullary Width2). Although fundamentally applicable to the study of living individuals, the uniplanar cylindrical model has been perceived as overly simplistic for comparative analyses of different bones and/or locations within single skeletal elements of varying cross-sectional shape. As a result, biplanar elliptical models employing orthogonal posteroanterior and mediolateral views have been proposed to accommodate this variability (Demes et al., 1991; Biknevikius and Ruff, 1992; Ohman, 1993), and are particularly relevant for the study of skeletonized remains amenable to radiography in multiple planes. In such models, geometric properties may be calculated assuming either an eccentric or concentric position for the medullary cavity as appropriate for the element/location examined. Recently, invasive study of the second metacarpal midshaft in a small sample of historically known archaeological skeletons, which provides direct observation of bone mass and geometry rather than algebraically determined estimates thereof, demonstrated in-
1 Garn (1970: 7) states ‘‘. . . the cylindrical model assumes that all or most of the tissue bone is contained within the boundaries set by T and M. This is true for most long tubular bones at midshaft and has been verified experimentally for the 2nd metacarpal, using dried bones before and after sectioning.’’ T and M refer to Total and Medullary cavity width measured radiographically. No reference is provided for the experimental verification of 2nd metacarpal midshaft circularity.
adequacies in the circular and elliptical radiogrammetric models (Lazenby, 1997). Although the biplanar models exhibited less bias (i.e., mean difference between methods) and somewhat more precise limits of agreement (i.e., defined as ± 2 SD about the mean difference; Bland and Altman, 1986) than the uniplanar estimates, both radiogrammetric approaches significantly overestimated actual values, reflecting the existence of significant variation in crosssectional geometric shape in the second metacarpal midshaft (Fig. 1). The presence of such variation, and the bias it entails, is problematic for researchers unable to apply invasive methods in data collection. In such cases it would be useful to know what magnitude of method error to expect and, if possible, to be able to correct for this error. This paper addresses these concerns, revisiting the hypothesis that radiogrammetric approaches to evaluating bone mass provide equivalent results to those obtained through direct invasive measurement (c.f. Lazenby, 1997). It also provides a series of reduced major axis regression models permitting prediction of actual values from radiogrammetric estimates. MATERIALS AND METHODS Sample The study sample consists of 356 unilateral (n ⳱ 40) or paired (n ⳱ 316) adult second metacarpals from the 19th century St. Thomas’ Anglican Church cemetery, Belleville, Ontario, active between 1821 and 1874. A total of 198 individuals are represented (116 males and 82 females), ranging in age from 17–88 years (mean ± SD: males ⳱ 46.1 ± 13.9 years; females ⳱ 42.3 ± 14.0 years; t ⳱ 1.92, ns). Individuals interred in the cemetery are primarily Caucasian of western Europe heritage, with the majority originating from the British Isles (Saunders et al., 1992).
Radiogrammetry Radiogrammetric data were collected from perpendicular anteroposterior (AP) and mediolateral (ML) views taken with a Philips Diagnost 66, Triple Phase machine using a Lanex Fine Screen Kodak Cassette. Tube - film distance was held constant at 94 cm with exposure set at 45 kV and 2.5 mA/ sec. The midshaft of each metacarpal was located at one-half interarticular length (IAL, c.f. Plato et al., 1980, and others), and
SECOND METACARPAL CROSS-SECTIONAL GEOMETRY
749
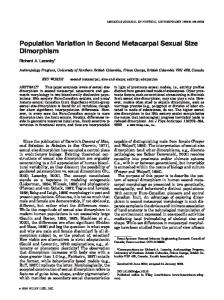
Fig. 1. Selected tracings showing variability in cross-sectional geometry at the second metacarpal midshaft. Sections are aligned along the medial anatomical axis (horizontal line; the vertical line locates the anterior anatomical axis). Text lines denote element and burial identification; the Ix/Iy ratio, which indicates deviation from circularity; and age and sex.
marked with an indelible pen on the bone surface. For AP views, bones were placed with the medial surface adjacent to the film cassette; for ML views, the posterior surface contacted the cassette. Plasticine was used as necessary to replicate positioning among elements. A wood frame with wire filaments situated over the midshaft mark aided in identification of this location for subsequent measurement in the radiographic image. Magnification was determined from a comparison of external widths from radiographs vs those measured directly from the corresponding bone; it was minimal (ⱕ3.0%). Total width (TW) and medullary cavity width (MW) were measured from the radiographs, with all measurements made to 0.05 mm using a Helios dial caliper (Fig. 2). Intraobservor error was under 2.0% for TW and ca. 4.0% for MW, agreeing with results generally obtained with this approach (Andresen and Nielsen, 1986). Geometric variables evaluated in this study include total area (TA), cortical area (CA), medullary area (MA), percent cortical area (PCA), bending rigidity about the mediolateral axis (Iy) and torsional rigidity (J), estimated using algebraic models described in Garn (1970), Roy et al. (1994), and Ohman (1993).
Cross-sectional Geometry Direct measurement of 2nd metacarpal midshaft geometry was undertaken from ca.
200 micron thick sections obtained at onehalf IAL, AP and ML axes were located with reference to landmarks of the posterior and medial surfaces and marked with an indelible ink pen. An approximately 2 cm. portion of bone spanning the midshaft was removed, cleaned, and embedded in a clear epoxy resin, following which plane parallel sections were cut at midshaft on a diamond slow-speed saw. Each section was oriented with respect to the AP and ML axes, and taped to a record sheet preprinted with a 10 mm scale. Each section with accompanying scale was then scanned at 400 pixels per inch with 400 percent magnification, and stored on disk. These digital images were subsequently edited in the program Photoshop威 to highlight the endosteal and periosteal margins, and each edited image and scale was printed on a laser printer at 600 dpi with a further 250% magnification to expedite digitization using the program SLCOMM (Eschman, 1989). SLCOMM provides direct quantification of the relevant geometric properties. Percentage mean difference values between sets of replicate images and measurements made for 25 randomly selected sections ranged from −0.22% for CA to −1.24% for Iy. Although it is widely recognized that bone cross-sectional geometric variation is correlated with body and hence bone size (Ruff et
750
R.A. LAZENBY
Fig. 2. Anteroposterior and mediolateral views of the second metacarpal, showing interarticular length (IAL), and the midshaft site for radiogrammetry of Total Width (TW) and Medullary Width (MW).
al., 1993), no correction for body size variation was undertaken in this investigation. The primary hypothesis being tested is essentially size-free; that is, it is concerned with whether different methods provide equivalent results irrespective of the degree to which the bones in the sample vary in size. By the same token, the predictive models are meant to provide estimates of actual geometric property values, which might subsequently be adjusted for variation in body size. This reasoning also permits setting aside consideration of age, sex, or side in the present study, although each is an important contributor to variation in bone mass (e.g., Stini, 1990), and significant differences exist for these descriptors in the present sample (Lazenby, submitted). Although it is possible that bone size (whether originating as sexual or side dimorphism, or as an age effect) might influence the magnitude of bias among estimators, this cannot be specified a priori, but may be subject to testing in subsequent analyses. Method comparisons for bias were undertaken using correlation analysis and paired t-tests. Regression coefficients and confidence intervals for the primary variables2, TA, CA, Ix, and Iy were generated using
model II regression (reduced major axis, RMA). The theoretical and practical arguments favouring RMA have been articulated elsewhere (e.g., Aiello, 1992; Ruff et al., 1993); the fundamental considerations are that RMA accommodates measurement error in both x and y, and is independent of the value of the correlation coefficient (Aiello, 1992). A 10% holdout sample (n ⳱ 36) was randomly selected prior to deriving the regression models for subsequent evaluation of their predictive efficacy using paired t-tests. Prior to analysis, distribution plots indicated slight positive skewness for a number of variables in the dataset with the exception of PCA, which exhibited slight negative skewness. Natural log or square root transforms (PCA) were used as appropriate (Kirkwood, 1988). All statistical analyses were carried out using Systat 5.1 for the Macintosh (Wilkinson, 1989), with alpha set at 0.05.
2 Other variables of interest examined in this study, such as medullary area (MA), percent cortical area (PCA), and torsional rigidity (J) can be derived from these primary variables. Thus, separate regressions for these were not developed.
751
SECOND METACARPAL CROSS-SECTIONAL GEOMETRY
TABLE 1. Descriptive statistics for observed (SLCOMM) and algebraic radiogrammetric estimates of metacarpal size and strength variables (n = 356). PCA reported as a square root transform; all others natural log transformed data
Variable TA CA MA PCA Ix Iy J
SLCOMM M SD 3.98 0.18 3.66 0.21 2.61 0.42 8.54 0.53 5.43 0.40 5.29 0.37 6.06 0.37
Circular M SD 4.01 0.20 3.73 0.22 2.53 0.47 8.68 0.52 2 na 5.42 0.41 6.12 0.41
Elliptical Concentric Eccentric M 4.07 3.78 2.60 8.68 5.59 5.48 6.23
SD 0.18 0.21 0.44 0.50 0.39 0.38 0.37
M
SD na na na na
5.58 5.48 6.23
0.39 0.38 0.37
% Difference1 SLCOMMCircular 3.05 7.25 −7.69 4.28 13.88 6.18
SLCOMMElliptical 9.42 12.75 −1.00 4.28 17.35 20.92 18.53
1
Calculated as (Radiometric-SLCOMM)/SLCOMM * 100, using back-transformed means. 2 The circular model cannot estimate Ix, which requires a mediolateral view of bone dimensions. TA, CA, MA in mm2; Ix, Iy and J in mm4.
RESULTS Table 1 provides descriptive statistics for actual and radiogrammetrically estimated geometric variation in the second metacarpal midshaft. Deviation from actual values for the circular model ranges from 3.05% for TA, to 13.88% for Iy, and for the elliptical model, from 4.28% for PCA to 20.92% for Iy. Because the anteroposterior radiographic image provides information from the mediolateral plane alone, the circular model cannot provide an estimate of bending rigidity about the mediolateral axis, Ix. This would require the perpendicular view of the anteroposterior cortical and medullary dimensions. However, the presumption of circularity assumes the equivalence of Ix and Iy. As well, measures of cortical and medullary areas are equivalent for the two elliptical models, since these properties do not depend on distributional variation in bone substance within the cross-section. There is effectively no difference in estimates of bending and torsional rigidity (Ix, Iy, and J) for the concentric and eccentric elliptical models, indicating the presence of little ‘eccentricity’ in placement of the medullary cavity within the metacarpal midshaft diaphysis. Thus, subsequent results are reported only for the concentric elliptical estimates. Although correlations are invariably larger for actual vs elliptical estimates as opposed to actual vs circular, the mean difference values are greater for the elliptical model (Table 2). In all cases except MA, the radiogrammetric models significantly overestimate actual values; the circular model significantly under-estimates MA. These results indicate that, although there is less dispersion for the biplanar estimates, there
TABLE 2. Correlation coefficients (r) and t-tests for the mean difference (md) between invasive (SLCOMM) vs uniplanar (Circular) and biplanar (Elliptical) radiogrammetric estimates of metacarpal size and strength variables (n = 356) Variable TA CA MA PCA Ix Iy J
SLCOMM - Circular r ⳱ 0.78 md ⳱ −0.034 t ⳱ −4.89* r ⳱ 0.80 md ⳱ −0.068 t ⳱ −9.23* r ⳱ 0.88 md ⳱ 0.076 t ⳱ 6.38* r ⳱ 0.90 md ⳱ −0.146 t ⳱ −11.84* na1 r ⳱ 0.87 md ⳱ −0.137 t ⳱ −12.91* r ⳱ 0.77 md ⳱ −0.058 t ⳱ −4.06*
SLCOMM - Elliptical r ⳱ 0.94 md ⳱ −0.090 t ⳱ −26.53* r ⳱ 0.92 md ⳱ −0.123 t ⳱ −27.83* r ⳱ 0.95 md ⳱ 0.009 t ⳱ 1.31 r ⳱ 0.93 md ⳱ −0.141 t ⳱ −13.55* r ⳱ 0.94 md ⳱ −0.159 t ⳱ −22.03* r ⳱ 0.93 md ⳱ −0.193 t ⳱ −25.08* r ⳱ 0.94 md ⳱ −0.175 t ⳱ −25.47*
*P ⱕ 0.05. 1 The circular model cannot estimate Ix, which requires a mediolateral view of bone dimensions. TA, CA, MA in mm2; Ix, Iy and J in mm4
are a greater number of cases in which overestimation occurs. Indeed, for TA, CA, and Iy respectively, there are 333 (93.5%), 332 (93.3%), and 336 (94.4%) instances in which the elliptical value exceeds the actual value, while the corresponding numbers for the circular model are 216 (59.8%), 251 (70.5%), and 274 (80.0%) cases (Fig. 3). This finding stands in contrast to that reported earlier from a substantially smaller subset of the present dataset (Lazenby, 1997; n ⳱ 46), in which the elliptical models exhibited lower bias (mean difference) relative to the uniplanar estimates. One possible reason
752
R.A. LAZENBY
Fig. 3. Plots of radiogrammetric estimates for total area (TA) showing differences in dispersion and bias; SLCOMM vs circular (3a) and SLCOMM vs elliptical (3b) models.
753
SECOND METACARPAL CROSS-SECTIONAL GEOMETRY
TABLE 3. Reduced major axis regression models for predicting actual from radiogrammetric estimates of bone mass and bending strength (n = 320) 95% Confidence intervals Intercept Slope Model UNIPLANAR Ln actual TA ⳱ 0.346 + 0.906 * ln Circular TA Ln actual CA ⳱ 0.040 + 0.971 * ln Circular CA Ln actual Iy ⳱ 0.315 + 0.917 * ln Circular Iy BIPLANAR Ln actual TA ⳱ −0.101 + 1.003 * ln Elliptical TA Ln actual CA ⳱ −0.253 + 1.034 * ln Elliptical CA Ln actual Ix ⳱ −0.280 + 1.022 * ln Concentric Elliptical Ix Ln actual Iy ⳱ −0.143 + 0.991 * ln Concentric Elliptical Iy
for this result is the inclusion of the palmar ridge, formed by the medial and lateral interosseous muscles, in the M-L image of the anteoposterior cortices (see Fig. 1). The inclusion of this morphological feature in the elliptical model will contribute disproportionately to anteroposterior breadths relative to areas (MA excepted) and bending properties, exaggerating the resulting estimates. At the same time, the added dimension in the elliptical model decreases the random error by including more ‘shape’ information than available from the uniplanar circular model, as evident in Figure 3. Table 3 provides reduced major axis regression models derived from 320 cases, in which actual values (y) were regressed on the radiogrammetric estimates (x). Table 4 gives the results of paired t-tests on a holdout sample of 36 individuals. In all cases the benefit of employing the regression model to estimate actual values is evident. The mean differences between actual and radiometric estimates are invariably significant; however, none of the predictive models generates significantly different values from the actual values measured by SLCOMM. This pattern holds up when the predicted values are back-transformed and compared to the raw data (not shown).3 DISCUSSION Radiogrammetry has been a widely used approach to obtaining geometric property data principally because the method is comparatively inexpensive and non-invasive, and can be employed with considerable efficacy in large-scale surveys of living populations (e.g., Garn et al., 1976) or for analyses
3
The back-transform is carried out as 2.71828predicted
value
.
Lower
Upper
Lower
Upper
0.081 −0.209 0.043
0.611 0.289 0.588
0.840 0.904 0.867
0.972 1.038 0.967
−0.258 −0.421 −0.498 −0.371
0.056 −0.085 −0.062 0.085
0.964 0.990 0.983 0.949
1.041 1.079 1.061 1.033
of rare or fragile archaeological and fossil specimens (e.g., Trinkaus and Ruff, 1989). Radiographic facilities and technical expertise are generally more widely available than alternatives such as computed tomography, though the latter can provide comparable, if not unique, images of complex geometric shapes (Ruff and Leo, 1986, e.g., in the mandibular arch, Daegling, 1989; Swartz and Conroy, 1996). In recent years, densitometric image analysis of radiographic grey levels (Maggio et al, 1995; Derisquebourg et al., 1994; Fukunaga et al., 1990) has been developed as a refinement on the classic caliper method pioneered by Barnett and Nordin (1961) and Garn (1970), although the latter remains the method of choice for some; see, or example, Wishart et al. (1993) and Fox et al. (1995). Both techniques have been shown to provide good correspondence with other methods of bone mass measurement, such as single or dual photon absorptiometry (Aguado et al., 1996; Meema and Meindok, 1992; Derisquebourg et al., 1994). Interpretation of patterns of variation among samples under study (e.g., left vs right, male vs female; old vs young; normal vs malnourished) is grounded in the magnitude of differences observed, their statistical significance and variability. These may all be impacted by biased estimators. At the same time, although radiogrammetric approaches have been shown to be biased in their estimation of bone mass and strength, it is not unreasonable to ask what import such bias might have for comparative study of bone growth, aging, asymmetry, and other questions to which data so acquired have been applied. It is well known that bone geometry is responsive to functional input, and will remodel its configuration ac-
754
R.A. LAZENBY
TABLE 4. Paired t-tests for actual vs estimated algebraic and actual vs predicted values of bone mass and bending strength (n = 36 cases) Variable and model TA Circular TA Elliptical CA Circular CA Elliptical Ix Concentric Elliptical Iy Circular Iy Concentric Elliptical
Contrast
md
t⳱
P⳱
Actual-estimated Actual-predicted Actual-estimated Actual-predicted Actual-estimated Actual-predicted Actual-estimated Actual-predicted Actual-estimated Actual-predicted Actual-estimated Actual-predicted Actual-estimated Actual-predicted
−0.047 −0.012 −0.093 −0.004 −0.075 −0.006 −0.127 −0.004 −0.157 −0.001 −0.152 −0.009 −0.199 −0.006
−2.135 −0.570 −10.095 −0.436 −2.741 −0.220 −8.338 −0.250 −7.407 −0.069 −4.086 −0.270 −7.588 −0.214
0.040 0.572 0.000 0.665 0.010 0.827 0.000 0.804 0.000 0.946 0.000 0.789 0.000 0.832
cording to changes in its biomechanical environment (Lanyon, 1993). Indeed, it is this relationship which permits biobehavioral interpretation from bone geometry (e.g., Ruff [1987] and the association of sexual dimorphism in lower limb geometry, subsistence and division of labour). Thus, in the case of longitudinal growth or aging studies (e.g., van Hemert et al., 1990), a bone’s shape may change during one’s lifetime independently of change in the amount of bone present. Radiographically, TW and MW may differ between initial and subsequent observations, and consequently derived measures such as PCA will change, even though no significant modification may have occurred in actual bone mass over time. Alternatively, shape change may mask the true magnitude of size change. Similarly, in studies of side asymmetry (e.g., Plato et al., 1982; Roy et al., 1994) differences in the shape of the left and right metacarpal mid-diaphysis (Lazenby, 1995) will confound derived measures such as TA, CA, and PCA. Although radiogrammetric approaches exhibit significant bias in their overestimation of actual geometric properties, this study makes clear that sample composition can influence which method (uni- or biplanar) is the least effective model. In a selection of 46 male and female left metacarpals from this dataset, the biplanar method was clearly less biased than that employing the cylindrical model (Lazenby, 1997); yet, in the present study (in which both sides are represented) the converse holds true. Pragmatically, this belies any recommendation as to which may be the radiogrammetric method of choice. Indeed, re-
searchers studying second metacarpal morphometry in living populations might take solace in knowing that the only radiogrammetric approach available to them (uniplanar posteroanterior views) can be effective. At the same time, those investigating skeletal samples might reasonably forego the added costs associated with obtaining mediolateral radiographic images required of elliptical models. The impact of bias will be most significant if it can be shown that the pattern of overestimation, although systematic, differs between age and/or sex and/or side groups, or between different populations. Such variation was not investigated in this study, but preliminary results for the circular model comparing males and females in this sample suggest the existence of differences for both slope and intercept for TA and Iy (but not for CA). This may be a consequence of size dimorphism and/or degree of palmar muscularity and its potential effect in measuring TW and (especially) MW. If such withinor between group differences are found to be significant, it will be necessary to derive more specific equations to correct for radiogrammetric bias. It would be useful to compare the regression models developed from this 19th century skeletal sample with those obtained from other samples, including a more sedentary modern (e.g., autopsy) sample, to assess effects on predictive accuracy. In the interim, this study documents a high degree of shape variation in metacarpal midshaft geometry contributing to significant bias in assessing bone properties, and the reduced major axis models reported provide closer approximations to actual values for bone mass and strength.
SECOND METACARPAL CROSS-SECTIONAL GEOMETRY
ACKNOWLEDGMENTS This research was supported in part by a UNBC Research Seed Grant; a Natural Sciences and Engineering Research Council of Canada (NSERC) postdoctoral fellowship and NSERC research grant (OGP 0183660). Staff at the Small Animal Clinic, College of Veterinary Medicine, University of Guelph, and in particular Alice Daw, kindly shared their radiographic facilities and expertise. Comments from the external review process proved most helpful and improved the final manuscript. LITERATURE CITED Aguado, F, Revilla, M, Hernandez, ER, Villa, LF, Rico, H (1996) Behavior of bone mass measurements: Duel energy x-ray absorptiometry total body bone mass mineral content, ultrasound bone velocity, and computed metacarpal radiogrammetry, with age, gonadal status, and weight in healthy women. Invest. Radiol. 31:218–222. Aguado, F, Revilla, M, Villa, LF, Rico, H (1997) Cortical bone resorption in osteoporosis. Calcif. Tissue Int. 60:323–326. Aiello, LC (1992) Allometry and the analysis of size and shape in human evolution. J. Hum. Evol. 22:127–147. Andresen, J Nielsen, HE (1986) Assessment of bone mineral content and bone mass by non-invasive radiologic methods. Acta Radiolog. 27:609–617. Barnett, E, Nordin, BEC (1961) Radiological assessment of bone density. I. The clinical and radiological problem of thin bones. Brit. J. Radiol. 34:683–692. Biknevicius, AR, Ruff, CB (1992) Use of biplanar radiographs for estimating cross-sectional geometric properties of mandibles. Anat. Rec. 232:157–163. Bland, JM and Altman, DG (1986) Statistical methods for assessing agreement between two methods of clinical measurement. Lancet I:307–310. Daegling, DJ (1989) Biomechanics of cross-sectional size and shape in the hominoid mandibular corpus. Am. J. Phys. Anthropol. 80:91–106. Demes, B, Jungers, WL, Selpien, K (1991) Body size, locomotion, and long bone cross-sectional geometry in Indriid primates. Am. J. Phys. Anthropol. 86:537– 547. Derisquebourg, T, Dubois, P, Devogelaer, JP, Meys, E, Duquesnoy, B, Nagant de Deuxchaisnes, C, Delcambre, B, Marchandise, X (1994) Automated computerized radiogrammetry of the second metacarpal and its correlation with absorptiometry of the forearm and spine. Calcif. Tissu. Int. 54:461–465. Eschman, P (1990). In: SLCOMM: A user supported real-time digitizing package. Alberquerque, NM. Eschman Archaeological Services. Fox, KM, Kimura, S, Powell-Threets, K, Plato, CC (1995) Radial and ulnar cortical thickness of the second metacarpal. J. Bone Min. Res. 10:1930–1934. Fukunaga, M, Tomomitsu, T, Otsuka, N, Imai, H, Morita, R, Nishii, Y (1990) Indexes of bone mineral content on second metacarpal bone roentgenogram analyzed by digital image processing: A comparison with other bone mass quantifying methods. Rad. Med. 8:230–235.
755
Garn, SM (1970) The Earlier Gain and Later Loss of Cortical Bone. Springfield, IL. Charles C Thomas. Garn, SM, Poznanski, AK, Larson, K (1976) Metacarpal lengths, cortical diameters and areas from the 10state nutritional survey. In: Jaworski, ZFG. (ed.) Proceedings of the First Workshop on Bone Morphometry. Ottawa. University of Ottawa Press, pp. 367–391. Garn, S, Sullivan, T, Decker, S, Hawthorne, V (1991) Brief Communication: On the optimum number of metacarpals for roentgenogrammetric measurement. Am. J. Phys. Anthropol. 85:229–232. Garn, SM, Sullivan, TV, Decker, SA, Larkin, FA, Hawthorne, VM (1992) Continuing bone expansion and increasing bone loss over a two-decade period in men and women from a total community sample. Am. J. Hum. Biol. 4:57–67. Himes, JH, Huang, Z (1993) Menarcheal status and bone development in Guatemalan girls. Am. J. Hum. Biol. 5:515–521. Kirkwood, BR (1988). Essential of Medical Statistics. Oxford. Blackwell Scientific Publications. Kusec, V, Simic, D, Chaventre, A, Tobin, JD, Plato, CC, Rudan, P (1988) Age, sex, and bone measurements of the second, third, and fourth metacarpal (Island of Pag, SR Croatia, Yugoslavia). Coll. Antropol. 12:309– 322. Lanyon, LE (1993) Skeletal responses to physical loading. In: Mundy, GR and Martin, TJ (eds.) Physiology and Pharmacology of Bone. Berlin. Springer-Verlag, pp. 485–505. Lazenby, RA (submitted) Second metacarpal midshaft geometry in an historic cemetery sample. Am. J. Phys. Anthropol. Lazenby, RA (1995) Non-circular geometry and radiogrammetry of the second metacarpal. Am. J. Phys. Anthropol. 97:323–327. Lazenby, RA (1997) Bias and agreement for radiogrammetric estimates of cortical bone geometry. Invest. Radiol. 32:12–18. Maggio, D, Pacifici, R, Cherubini, A, Aisa, MC, Santucci, C, Cucinotta, D, Senin, U (1995) Appendicular cortical bone loss after age 65: Sex-dependent event? Calcif. Tissue Int. 56:410–414. Meema, HE, Meindok, H (1992) Advantages of peripheral radiogrammetry over dual-photon absorptiometry of the spine in the assessment of prevalence of osteoporotic vertebral fractures in women. J. Bone Miner. Res. 7:897–903. Ohman, JC (1993) Computer software for estimating cross-sectional geometric properties of long bones with concentric and eccentric elliptical models. J. Hum. Evol. 25:217–227. Plato, CC, Wood, JL, Norris, AH (1980) Bilateral asymmetry in bone measurements of the hand and lateral hand dominance. Am. J. Phys. Anthropol. 52:27–31. Plato, CC, Purifoy, FE (1982) Age, sex, and bilateral variability in cortical bone loss and measurements of the second metacarpal. Growth 46:100–112. Plato, CC, Greulich, WW, Garruto, RM, Yanagihara, R (1984) Cortical bone loss and measurements of the second metacarpal bone: II. Hypodense bone in postwar Guamian children. Am. J. Phys. Anthropol. 63:57–63. Roy, TA, Ruff, CB, Plato, CC (1994) Hand dominance and bilateral asymmetry in the structure of the second metacarpal. Am. J. Phys. Anthropol. 94:203–211. Ruff, CB (1987) Sexual dimorphism in human lower limb bone structure: Relationship to subsistence
756
R.A. LAZENBY
strategy and sexual division of labor. J. Hum. Evol. 16: 391–416. Ruff, CB, Leo, FP (1986) Use of computed tomography in skeletal structure research. Yrbk. Phys. Anthropol. 29:181–196. Ruff, CB, Trinkaus, E, Walker A, Larsen, CS (1993) Postcranial robusticity in Homo. I: Temporal trends and mechanical interpretation. Am. J. Phys. Anthropol. 91:21–53. Ruff, C, Walker, A, Trinkaus, E (1994) Postcranial robusticity in Homo. III. Ontogeny. Am. J. Phys. Anthropol. 93:35–54. Runestad, JA, Ruff, CB, Nieh, JC, Thorington, RW, Jr, Teaford, MF (1993) Radiographic estimation of long bone cross-sectional geometric properties. Am. J. Phys. Anthropol. 90:207–213. Saunders, S, Fitzgerald, C, Rogers, T, Dudar, C, McKillop, H (1992) A test of several methods of skeletal age estimation using a documented archaeological sample. Can. Soc. Forens. Sci. J. 25:97–118. Stini, WA (1990) ‘Osteoporosis’: Etiologies, prevention and treatment. Yrbk. Phys. Anthropol. 33:151–194. Swartz, GT, Conroy, GC (1996) Cross-sectional geometric properties of the Otavipithecus mandible. Am. J. Phys. Anthropol. 99:613–623.
Trinkaus, E, Ruff, CB (1989) Diaphyseal cross-sectional morphology and biomechanics of the Fond-de-Foret 1 femur and the Spy 2 femur and tibia. Bull. Soc. Roy. Belg. Anth. Preh. 100:33–42. Trinkaus, E, Churchill, SE, Ruff, CB (1990) Neandertal post-traumatic humeral asymmetry and the interpretation of fossil diaphyseal morphology. Am. J. Phys. Anthropol. 90:308–309. Trinkaus, E, Churchill, SE, Ruff, C (1994) Postcranial robusticity in Homo. II: Humeral bilateral asymmetry and bone plasticity. Am. J. Phys. Anthropol. 93:1–34. van Hemert, AM, Vandenbroucke, JP, Hofman, A, Valkenburg, HA (1990) Metacarpal bone loss in middle-aged women: ‘‘Horse racing’’ in a 9-year population based follow-up study. J. Clin. Epidemiol. 43:579–588. Wilkinson, L (1989). SYSTAT: The System for Statistics. Evanston, IL. SYSTAT, Inc. Wishart, JM, Horowitz, M, Bochner, M, Need, AG, Nordin, BEC (1993) Relationships between metacarpal morphometry, forearm, and vertebral bone density and fractures in postmenopausal women. Brit. J. Radiol. 66:435–440.