Thailand
Thaicom
Neutral Upgrade Price as of 1 Nov 2017
13.10
12M target price (Bt/shr)
19.00
Unchanged / Revised up (down) (%)
Unchanged
Upside/downside (%)
45.0
Key messages
กำไรสุ ทธิของ THCOM ใน 3Q60 อยูท่ ี่ 65 ล้ำนบำท (-70% QoQ, -85% YoY) กำไรที่ลดลง QoQ มำจำกค่ำใช้จ่ำยใน กำรขำยและบริ หำร ที่เพิ่มขึ้น ในขณะที่กำไรที่ลดลง YoY มำจำกกำรที่รำยได้ลดลง ทั้งนี้เรำคำดว่ำบริ ษทั จะขำยธุ รกิจ อินเตอร์เน็ต (CS Loxinfo, CSL.BK/CSL TB) ได้เสร็ จ เรี ยบร้อยในปี 2561 ซึ่ งจะทำให้กำไรสุ ทธิในปี 2561 โตกว่ำ ปกติ โดยรำคำเป้ ำหมำยที่ปรับใช้สำหรับปี 2561 อยูท่ ี่ 19 บำท มี upside อีก 45% แต่เรำปรับเพิ่มคำแนะนำจำก “ขำย” เป็ นเพียง “ถือ” เพรำะแนวโน้มกำไรปกติในปี หน้ำยังดู อ่อนแอ บวกกับเชื่อว่ำประเด็นกรณีพิพำทกับกระทรวงฯ ที่ จะให้ดำวเทียมที่มีอยูป่ ัจจุบนั (ไทยคม 7 –8) กลับไปอยู่ ภำยใต้สัมปทำน และควำมล่ำช้ำในกำรขออนุญำตยิง ดำวเทียมดวงใหม่ ซึ่ งจะยังคงเป็ นปัจจัยกดดันรำคำหุ ้น ต่อไป Trading data Mkt cap (Btbn/US$mn)
14.4/359
Outstanding shares (mn)
1,096
Foreign ownership (mn)
182
3M avg. daily trading
7
(mn) 52-week trading range
13.10 – 22.90
(Bt) Performance (%)
3M
6M
12M
Absolute
-20.1
-30.3
-35.8
Relative
-26.4
-36.2
-43.9
Quarterly EPS Bt
1Q
2Q
3Q
4Q
2015
0.49
0.52
0.24
0.68
2016
0.64
0.54
0.40
(0.10)
2017
0.24
0.20
0.06
NA
Share price chart 24
20
22
10 0
20
(10) 18 (20)
16
(30)
14 12 Nov-16
(40)
Jan-17
Mar-17
Share Price
Jun-17
Aug-17
(50) Oct-17
Price performance relative to SET
Piyathida Sonthisombat Source: SET 66.2658.8888 Ext.8852
[email protected]
November 2, 2017
*The Company may be issuer of Derivative Warrants on these securities. http://research.kgi.com; Bloomberg: KGIT
Please see back page for disclaimer
1
Thailand COMPANY
Thaicom UPDATE Thailand กำรกำไรปี 2560-61 เอำไว้ที่ 700 ล้ำนบำท และ 1.8 พันล้ำนบำทตำมลำดับ เนื่ องจำกเรำมองว่ำมี upside จำกประมำณกำรของเรำเพียงแค่ 4-5% เท่ำนั้น ทั้งนี้ เรำคำดว่ำบริ ษทั จะขำยธุรกิจอินเตอร์ เน็ต (CS Loxinfo, CSL.BK/CSL TB) ได้เสร็ จในช่วงต้นปี 2561 ซึ่งจะทำให้กำไรสุ ทธิ ในปี 2561 โตผิดปกติ เพรำะคำดว่ำจะมีกำรบันทึกกำไรจำกกำรขำย CSL ประมำณ 1.6 พันล้ำนบำทใน 1Q61
Thaicom
Valuation and action TB)* เรำขยั(THCOM.BK/THCOM บไปใช้รำคำเป้ ำหมำยปี 2561 ที่ 19 บำท (DCF, WACC 11.7%) ซึ่งยังเหลือ upside อีก 45% แต่เรำ ปรับเพิ่มคำแนะนำจำก “ขำย” เป็ นเพียง “ถือ” เพรำะแนวโน้มกำไรปกติในปี หน้ำยังดูอ่อนแอ บวกกับ 3Q17 earnings review: กำไรตำ่ กว่ ำคำด เชื่ อว่ำประเด็นเรื่ องกรณี พิพำทกับกระทรวงฯ ที่จะให้ดำวเทียมที่มีอยูป่ ัจจุบนั (ไทยคม 7 –8) กลับไปอยู่ ภำยใต้สมั ปทำน และควำมล่ำช้ำในกำรขออนุญำตยิงดำวเทียมดวงใหม่ ซึ่ งจะยังคงเป็ นปั จจัยกดดันรำคำ Event หุ้นต่อไป จนกว่ำจะมีควำมชัดเจน กำไรสุทธิของ THCOM ใน 3Q60 อยูท่ ี่ 65 ล้ำนบำท (-70% QoQ, -85% YoY) ต่ำกว่ำประมำณกำรของ Risks เรำที่ 90 ล้ำนบำท แต่สูงกว่ำที่ตลำดคำดกำรณ์ที่ 34 ล้ำนบำทควำมไม่แน่นอนของกฎเกณฑ์ทำงกำรเกี่ยวกับกำรยิงดำวเทียมดวงใหม่ และกำรที่บริ ษทั อำจจะต้องรับรู ้ ผลขำดทุนจำกกำรด้อยค่ำของดำวเทียมในปั จจุบนั เนื่ องจำกอำยุกำรใช้งำนใกล้จะหมดลง lmpact ผลประกอบกำร 3Q60 แง่ QoQ ถูกกดดันจำกค่ ำใช้ จ่ำยขำยและบริ หำรที่สูงขึand น้ valuations Key financials สำเหตุสำคัญที่ทำให้กำไรสุทธิออกมำต่ำกว่ำที่เรำคำดไว้คือค่ำใช้จ่ำยในกำรขำยและบริ หำรสูงเกินคำดDec-14A Dec-15A Dec-16A Dec-17F Dec-18F Reve n) พันล้ำนบำท (+1.1% QoQ)11,893 12,453 11,517 9,523 6,608 โดยประเด็นสำคัญในงวด 3Q60 คือ รำยได้จำกกำรขำยและบริ กnue ำรอยู(Bท่ tm ี่ 2.3 Gross Profit (Btmn) 4,852 5,099 4,163 2,493 1,747 จำกรำยได้ที่เพิ่มขึ้นจำกดำวเทียมแบบบรอดแบนด์ (ไอพีสตำร์ ) และธุ ร กิ จ อิ น เตอร์ เ น็ ต อั ต รำก ำไรขั น ต้ น ้ EBIT (Btmn) 2,548 2,981 1,937 664 438 2,122 1,612 670 1,826 เพิ่มขึ้นจำก 23.1% ใน 2Q59 เป็ น 26.5% ตำมฐำนรำยได้ทNe ี่เพิt่มPขึrofit ย่ำn)งไรก็ตำมกำไรสุ ทธิ ใน 3Q60 1,601 ้ น แต่(Bอtm Normalized Profit (Btmn) 1,529 2,717 1,694 291 177 ถูกกดดันจำกสัดส่ วน ค่ำใช้จ่ำยในกำรขำยและบริ หำร/ยอดขำย ทีt)่เพิ่มขึ้นจำก 17.7% ใน 2Q60 เป็ น 1.46 EPS(B 1.94 1.47 0.61 1.67 DPS 0.65 0.70 0.30 0.83 19.8% เนื่องจำกมีกำรตั้งสำรองหนี้ สงสัยจะสูญเพิ่มขึ้น ขณะที ่เมื(B่อt)เทียบกับ 3Q59 พบว่ำกำไรใน 3Q60 0.65 EPSgrowth (%) 42.0 32.6 (24.1) (58.4) 172.5 ยังถูกกดดันจำกรำยได้ที่ลดลง 17% YoY ด้วย P/E(x) 23.8 15.0 13.2 21.4 7.9 P/B (x)
EV/EBITDA (x) คำดว่ำกำไรผ่ ำนจุดต่ำสุ ดไปแล้ ว และจะดีขนึ้ 4Q60 Net debt/Equity (x) เรำเชื่อว่ำกำไรใน 3Q60 จะเป็ นจุดต่ำสุดของปี นี้ และน่ำจะดี ข้ ึนnd ตั้งแต่ Divide yield4Q60 (%) เป็ นต้นไป จำกรำยได้ที่ R e turn on Ave ge Equity (%) ้ งเดิ ม รำยใหม่ เพิ่มขึ้นจำก i) ลูกค้ำดำวเทียมไอพีสตำร์ รำยใหม่ในอินโดนีเซีย ii) ลูกค้ำraดำวเที ยมแบบดั Source: Company KGI Research ในตลำด CLMV (ซึ่งจะใช้บริ กำรดำวเทียมไทยคม 8) และตลำดแอฟริ กำ data, (ซึ่งจะใช้ บริ กำรดำวเทียมไทย คม 6) iii) 4Q60 น่ำจะเป็ นไตรมำสแรกที่ THCOM เริ่ มรับรู้รำยได้ค่ำนำยหน้ำจำกกำรจัดซื้อดำวเทียม ให้กบั พันธมิตรในประเทศจีน
2.2 7.4 0.5 1.9 9.3
1.8 5.5 0.5 2.2 12.0
1.1 4.4 0.4 3.6 8.7
0.8 3.9 0.3 2.3 3.5
0.7 4.1 0.1 6.4 9.3
คงประมำณกำรกำไรสุ ทธิปี 2560-61 เอำไว้เท่ ำเดิม กำไรสุทธิงวด 9M60 คิดเป็ น 80% ของประมำณกำรกำไรสุทธิ ท้ งั ปี 2560 ของเรำ แต่เรำยังคงประมำณ Figure 1: 3Q17 earnings review Bt mn Revenue Cost of Goods Sold Gross Profit Operating Expenses Operating Profit Other incomes/expenses Net Investment Income/(Loss) Interest Expense Pre-tax Profit F/X gain (loss) and extra items Current taxation Minorities Net Profit EPS(Bt) Percent Gross margin SG&A/Sales Net profit margin
3Q17 2,312 (1,699) 612 (484) 128 68 59 (103) 153 32 (73) (47) 65 0.06 3Q17 26.5 20.9 2.8
3Q16 YoY (%) 2,791 (17.2) (1,757) (3.3) 1,034 (40.8) (525) (7.8) 509 (74.8) 39 77.6 51 17.1 (108) (4.3) 490 (68.8) 88 (63.4) (101) (28.0) (44) 8.3 434 (85.0) 0.40 (85.0) 3Q16 YoY (ppts) 37.1 (10.6) 18.8 2.1 15.5 (12.7)
2Q17 QoQ (%) 2,286 1.1 (1,758) (3.4) 528 16.1 (427) 13.5 101 27.0 66 3.6 67 (11.0) (104) (0.6) 130 17.7 191 (83.2) (64) 12.7 (40) 17.2 216 (69.8) 0.20 (69.8) 2Q17 QoQ (ppts) 23.1 3.4 18.7 2.3 9.5 (6.6)
9M17 7,329 (5,327) 2,002 (1,454) 548 185 150 (312) 571 318 (212) (137) 540 0.49 9M17 27.3 19.8 7.4
9M16 YoY (%) Comments 8,903 (17.7) Revenue dropped sharply YoY due to loss of key customers in Thailand and Australia (5,285) 0.8 3,618 (44.7) (1,579) (7.9) 2,039 (73.1) 128 44.3 154 (2.3) (250) 24.9 2,071 (72.4) 207 54.0 (414) (48.7) (138) (1.2) 1,725 (68.7) YoY net profit pressured by declining revenue, while QoQ pressured by larger SG&A 1.57 (68.7) 9M16 YoY (ppts) 40.6 (13.3) 17.7 2.1 19.4 (12.0)
Source: Company data
Figure 2: Operational statistics
November 2, 2017
*The Company may be issuer of Derivative Warrants on these securities. http://research.kgi.com; Bloomberg: KGIT
Please see back page for disclaimer
2
Thailand
Thaicom 3Q16 2,791
4Q16 2,614
1Q17 2,731
2Q17 2,286
3Q17 2,312
1,067 965 780
993 864 772
981 975 807
949 606 745
927 644 768
(3.3) (37.8) (7.7)
(12.3) (42.2) (6.1)
(1,757)
(2,069)
(1,870)
(1,758)
(1,699)
(6.0)
1.4
(663) (654) (504)
(693) (620) (496)
(670) (904) (488)
(663) (713) (514)
(663) (621) (488)
(1.0) (21.1) 5.3
10.7 0.1 (3.2)
Gross margin (percent)
37.1
20.8
31.5
23.1
26.5
(8.5)
(17.2)
SG&A
(525)
(646)
(543)
(427)
(484)
(21.5)
(6.9)
Operating profit
509
(102)
318
101
128
(68.2)
(85.8)
Satellite transponders Conventional satellites Broadband satellite (Mbps)
110 38
110 38
110 38
110 38
110 38
-
-
Satellite Utilization (%) Conventional satellites Broadband satellite
60 56
57 55
57 54
NA NA
NA NA
NA NA
NA NA
Revenue (Bt bn) 1.Satellite business - Coventional satellites - Broadband satellites 2.Internet & media business Cost (Bt bn) 1.Satellite business - Coventional satellites - Broadband satellites 2.Internet & media business
QoQ 1.1
YoY (17.2)
Source: Company data, KGI Research estimates
November 2, 2017
*The Company may be issuer of Derivative Warrants on these securities. http://research.kgi.com; Bloomberg: KGIT
Please see back page for disclaimer
3
Thailand
Thaicom
Figure 4: Satellites in portfolio
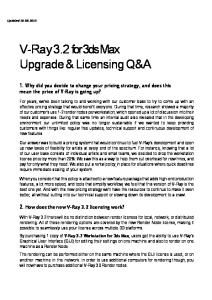
Figure 3: Company profile
Thaicom4 (iPSTAR) Broadband 119.5 Aug-05 15 years
Thaicom Public Company Limited (THCOM) was founded in 1991. Its satellite services operate under both MDES’s concession (Thaicom 4, Thaicom 5 and Thaicom 6) that will be terminated in 2021 and NBTC’s license (Thaicom 7 and Thaicom 8). The company also provides internet & media services and invests in telecom business in Laos. In 9M17, the company’s core revenue comes from conventional satellites (Thaicom 5, Thaicom 6, Thaicom 7 and Thaicom 8), which represents 38% of total revenue while revenue from broadband satellite
Satellite type Orbital slot Launched date Designed life Capacity C-band Ku-band Others
84 Ku-Spot Beams 8 Ku-Spot Beams (Augment) 3 Ku-Shape Beams 7 Ku-Broadcast Beams Coverage area 14 countries in Asia Pacific
(Thaicom 4) stood at 32%.
Thaicom5
Thaicom6
Thaicom7
Thaicom8
Conventional 78.5 May-06 14 years
Conventional 78.5 Jan-14 15 years
Conventional 120.0 Sep-14 18 years
Conventional 78.5 May-16 16 years
25 transponders 15 transponders Indochina Asia South Asia Europe Africa Australia
24 transponders 9 transponders Southeast Asia Africa
14 transponders Indochina Asia
24 transponders Indochina South Asia Africa
Source: Company data
Source: Company data
Figure 5: Breakdown revenue
Figure 6: Conventional satellite revenue
Sales and service revenue, percent
Conventional satellite revenue, Bt bn
37.0
37.8
25.1
Media business
35.0
35.9
34.3
32.6
35.7
26.3
27.5
41.2
39.6
37.0
37.9
37.4
35.9
41.3
39.6 3Q17
Broadband satellite
5.0
32.8
2Q17
39.3
32.4
1Q17
38.6
28.4
30.0
4Q16
41.4
27.7
3Q16
33.7
27.1
2Q16
33.5
25.4
1Q16
34.5
3Q15
33.3
27.2
2Q15
34.5
26.9
1Q15
37.8
4Q14
25.3
3Q14
27.7
4Q15
25.2
4.5
4.4 3.4
3.4
2.9
2.9
2012A
2013A
2014A
2015A
2016A
9M16
9M17
Conventional satellite
Source: Company data
Source: Company data
Figure 7: Broadband satellite revenue
Figure 8: Quarterly earnings
Broadband satellite revenue, Bt bn
Sales & service revenue, Bt bn (LHS); net profit, Bt mn (RHS)
Sales & service revenue
Source: Company data
Source: Company data
Figure 9: Company’s PER
Figure 10: Company’s PBV
PER, times
PBV, times
160.0
Net profit
4.0 +2.0 sd = 104.4x
120.0
+2.0 sd = 3.0x
3.0
+1.0 sd = 69.7x
80.0
+1.0 sd = 2.4x Average = 35.1x
40.0
Average = 1.8x
2.0
0.0
-1.0 sd = 1.1x
-1.0 sd = 0.5x 1.0
(40.0) (80.0) �
3Q17
9M17
2Q17
9M16
1Q17
2016A
4Q16
2015A
(0.1)
3Q16
2014A
0.1
2Q16
2013A
0.3
1Q16
2012A
0.5
4Q15
2.2
0.7
3Q15
3.1
2Q15
3.6
0.9
1Q15
4.0
4Q14
3.4
4.2
3Q14
4.3
3.4 3.2 3.0 2.8 2.6 2.4 2.2 2.0 1.8 1.6
-2.0 sd = 0.5x
-2.0 sd = -34.2x �
�
�
Source: Bloomberg, KGI Research
November 2, 2017
�
�
2017F
2018F
0.0 �
�
�
�
�
�
2017F
2018F
Source: Bloomberg, KGI Research
*The Company may be issuer of Derivative Warrants on these securities. http://research.kgi.com; Bloomberg: KGIT
Please see back page for disclaimer
4
Thailand
Thaicom
Quarterly income statement Income Statement (Bt mn) Revenue Cost of Goods Sold Gross Profit Operating Expenses Other incomes Operating Profit Depreciation of fixed assets Operating EBITDA Non-Operating Income Interest Income Other Non-op Income Non-Operating Expenses Interest Expense Other Non-op Expenses Net investment Income/(Loss) Pre-tax Profit Current taxation Minorities Extraordinary items Net Profit EPS(Bt) Margins (%) Gross profit margin Operating margin Operating EBITDA margin Net profit margin Growth (%) Revenue growth Operating growth Operating EBITDA growth Net profit growth
Mar-15A
Jun-15A
Sep-15A
Dec-15A Mar-16A
Jun-16A
Sep-16A
3,074 (1,859) 1,214 (561)
2,939 (1,757) 1,181 (529)
3,147 (1,824) 1,323 (507)
3,294 (1,914) 1,380 (521)
653 (698) 1,351 117
652 (704) 1,356 288
816 (705) 1,521 117
117 (82) (82) 46 735 (147) (48) 540 0.49
288 (284) (82) (202) 77 733 (115) (46) 572 0.52
39.5 21.3 44.0 17.6 8.0 18.4 15.3 35.4
Dec-16A Mar-17A
Jun-17A
Sep-17A
3,210 (1,794) 1,416 (596)
2,902 (1,734) 1,168 (458)
2,791 (1,757) 1,034 (525)
2,614 (2,069) 545 (646)
2,731 (1,870) 862 (543)
2,286 (1,758) 528 (427)
2,312 (1,699) 612 (484)
860 (695) 1,555 42
820 (683) 1,503 161
710 (685) 1,395 48
509 (780) 1,289 126
(102) (776) 675 74
319 (759) 1,078 146
101 (763) 864 87
128 (769) 898 101
117 (539) (86) (454) (13) 381 (66) (50) 265 0.24
42 (70) (56) (14) 83 915 (131) (39) 745 0.68
161 (70) (70) 41 952 (203) (49) 700 0.64
48 (73) (73) 62 748 (110) (46) 591 0.54
126 (108) (108) 51 578 (101) (44) 434 0.40
74 (163) (109) (55) 44 (147) 66 (33) (114) (0.10)
146 (106) (106) 24 383 (75) (49) 259 0.24
87 (104) (104) 67 151 (64) (40) 170 216 0.20
101 (103) (103) 59 185 (73) (47) 65 0.06
40.2 22.2 46.1 19.5
42.0 25.9 48.3 8.4
41.9 26.1 47.2 22.6
44.1 25.5 46.8 21.8
40.3 24.5 48.1 20.4
37.1 18.2 46.2 15.5
20.8 (3.9) 25.8 (4.3)
31.5 11.7 39.5 9.5
23.1 4.4 37.8 9.5
26.5 5.5 38.8 2.8
(0.9) (9.9) (3.3) 14.9
3.8 25.8 14.2 (4.9)
8.0 37.8 18.1 75.1
4.4 25.5 11.2 29.7
(1.3) 8.9 2.9 3.3
(11.3) (37.6) (15.3) 63.5
(20.6) (111.8) (56.6) (115.3)
(14.9) (61.1) (28.3) (63.1)
(21.2) (85.8) (38.1) (63.4)
(17.2) (74.8) (30.4) (85.0)
Source: Company data
Peer comparison – Key valuation stats
ADVANC* DTAC* TRUE* THCOM* INTUCH* SAMART SAMTEL Sector
Rating OP N N N OP N OP Underweight
Target price (Bt) 209.00 59.00 6.90 19.00 68.00 14.30 15.10
Current price (Bt) 193.00 51.00 6.15 13.10 57.50 12.10 15.00
Upside (%) 8.3 15.7 12.2 45.0 18.3 18.2 0.7
16 EPS (Bt) 10.3 0.9 (0.1) 1.5 5.1 0.1 0.3 18.0
17F EPS (Bt) 10.3 0.9 (0.1) 0.6 3.8 (0.1) 0.4 15.7
18F EPS 17F EPS 18F EPS (Bt) growth (%) growth (%) 11.4 (0.1) 10.5 (0.8) 4.5 NM (0.0) 3.4 (63.8) 1.7 (58.4) 172.5 4.4 (25.6) 14.9 0.1 NM NM 0.5 27.6 19.6 17.1 (12.6) 8.9
17F PER (x) 18.7 55.4 NM 21.4 15.1 NM 39.5 27.4
18F PER (x) 17.0 NM NM 7.9 13.2 90.4 33.0 25.2
17F PBV (X) 13.4 4.5 1.6 0.8 5.0 1.5 2.6 4.2
18F PBV (X) 11.4 4.9 1.6 0.8 5.2 1.6 2.6 4.0
17F Div Yield (%) 3.7 0.9 2.3 7.3 1.7 2.3
17F ROAE (%) 66.0 7.7 (3.4) 3.5 33.7 (0.6) 6.5 16.2
Source: KGI Research
November 2, 2017
*The Company may be issuer of Derivative Warrants on these securities. http://research.kgi.com; Bloomberg: KGIT
Please see back page for disclaimer
5
Thailand
Thaicom
Balance Sheet As of 31 Dec (Bt mn) Total Assets Current Assets Cash & ST Investments Inventories Accounts Receivable Others Non-current Assets LT Investments Net fixed Assets Others Total Liabilities Current Liabilities Accounts Payable ST Borrowings Others Long-term Liabilities Long-term Debts Others Shareholders' Equity Common Stock Capital Surplus Retained Earnings Preferred Stock
Profit & Loss 2014A 31,888 7,072 4,505 236 2,017 312 24,816 1,083 8,353 15,381 14,603 3,986 1,234 1,511 1,241 10,617 9,590 1,027 17,285 5,480 4,302 6,014 1,489
2015A 33,592 8,005 5,046 230 2,500 229 25,587 1,210 9,032 15,344 15,481 4,380 1,319 1,720 1,342 11,101 10,030 1,071 18,111 5,480 4,302 7,265 1,064
2016A 32,840 9,127 6,222 324 2,552 30 23,712 1,417 9,347 12,948 13,919 3,612 1,417 959 1,236 10,306 9,266 1,040 18,921 5,480 4,305 8,164 971
2017F 31,574 9,874 7,218 286 2,343 28 21,699 1,389 9,423 10,888 12,588 3,244 1,223 792 1,229 9,344 8,324 1,020 18,985 5,480 4,302 8,067 1,137
2018F 32,037 12,607 10,760 165 1,655 27 19,430 1,361 9,303 8,766 11,554 2,843 1,002 762 1,079 8,711 7,712 999 20,483 5,480 4,302 9,564 1,136
Year to 31 Dec (Bt mn) Revenue Cost of Goods Sold Gross Profit Operating Expenses Other incomes Operating Profit Depreciation of fixed assets Operating EBITDA Non-Operating Income Interest Income Other Non-op Income Non-Operating Expenses Interest Expense Other Non-op Expenses Equity Income/(Loss) Pre-tax Profit Current taxation Minorities Extraordinary items Net Profit EPS (Bt)
2016A 11,517 (7,354) 4,163 (2,226) 1,937 2,925 4,862 354 354 (359) (359) 198 2,131 (348) (171) 1,612 1.5
2017F 9,523 (7,030) 2,493 (1,829) 664 2,979 3,643 409 409 (399) (399) 200 874 (209) (165) 170 670 0.6
2018F 6,608 (4,861) 1,747 (1,310) 438 3,045 3,483 200 200 (306) (306) 220 551 (374) 0 1,649 1,826 1.7
Source: KGI Research
Year to 31 Dec (Bt mn)
2014A
2015A
2016A
2017F
2018F
4,831
4,729
4,711
3,822
5,269
Net Profit
1,514
2,305
1,783
835
1,826
Depreciation & Amortization
2,572
2,802
2,925
2,979
3,045
8
398
Operating Cash Flow
Key Ratios
Source: KGI Research
2015A 12,453 (7,354) 5,099 (2,118) 2,981 2,802 5,783 489 489 (901) (306) (595) 194 2,763 (458) (183) 2,122 1.9
Cash Flow
Source: KGI Research
Year to 31 Dec (Bt mn) Forecast Drivers Utilization (%) -Conventional satellites Utilization (%) -Broadband satellite Growth (% YoY) Sales OP EBITDA NP EPS Profitability (%) Gross Margin Operating Margin EBITDA Margin Net Profit Margin ROAA ROAE Stability Gross Debt/Equity (%) Net Debt/Equity (%) Interest Coverage (x) Interest & ST Debt Coverage (x) Cash Flow Interest Coverage (x) Cash Flow/Interest & ST Debt (x) Current Ratio (x) Quick Ratio (x) Net Debt (Bt mn) Per Share Data (Bt) EPS CFPS BVPS SPS EBITDA/Share DPS Activity Asset Turnover (x) Days Receivables Days Inventory Days Payable Cash Cycle
2014A 11,893 (7,041) 4,852 (2,304) 2,548 2,572 5,120 245 245 (384) (384) 154 2,562 (498) 87 (550) 1,601 1.5
2014A
2015A
2016A
2017F
2018F
Change in Working Capital NA 57.5
88.0 57.5
57.0 55.0
58.2 46.0
59.1 46.0
50.6 53.3 36.9 42.0 42.0
4.7 17.0 12.9 32.6 32.6
(7.5) (35.0) (15.9) (24.0) (24.0)
(17.3) (65.7) (25.1) (58.4) (58.4)
(30.6) (34.1) (4.4) 172.5 172.5
Others Investment Cash Flow Net CAPEX
40.9 23.9 46.4 17.0 6.5 12.0
36.1 16.8 42.2 14.0 4.9 8.7
26.2 7.0 38.3 7.0 2.1 3.5
26.4 6.6 52.7 27.6 5.7 9.3
64.2 48.2 6.6 1.3 (12.6) 4.3 1.8 1.7 8,332
64.9 46.1 9.7 1.5 (15.5) 3.3 1.8 1.8 8,349
54.0 39.9 5.4 1.5 (13.1) 7.9 2.5 2.4 7,541
48.0 29.0 1.7 0.6 (9.6) 9.7 3.0 3.0 5,507
41.4 7.3 1.4 0.4 (17.2) 11.6 4.4 4.4 1,503
1.5 4.4 15.8 10.9 4.7 0.7
1.9 4.3 16.5 11.4 5.3 0.7
1.5 4.3 17.3 10.5 4.4 0.7
0.6 3.5 17.3 8.7 3.3 0.3
1.7 4.8 18.7 6.0 3.2 0.8
0.4 55.5 12.6 57.3 10.8
0.4 66.2 11.6 63.4 14.4
0.3 80.1 13.7 67.9 25.9
0.3 93.8 15.8 68.5 41.1
0.2 110.4 16.9 83.5 43.8
(490)
110
1,045
112
(107)
-
-
(5,913)
(3,378)
(2,694)
(1,017)
(937) (891)
(6,336)
(1,242)
(1,060)
(1,019)
Change in LT Investment
(174)
-
-
28
28
Change in Other Assets
598
(2,136)
(1,634)
(26)
(74)
Free Cash Flow
(1,081)
1,351
Financing Cash Flow
1,567
Change in Share Capital 40.8 21.4 43.1 13.5 5.4 9.7
(301)
Net Change in Debt Change in Other LT Liab. Net Cash Flow
-
2,017
2,805
4,332
(719)
(2,734)
(1,880)
(971)
-
-
(0)
(30)
2,322
134
(1,836)
(167)
(755)
(853)
(899)
(1,713)
(941)
486
632
(717)
925
3,361
Source: KGI Research
Rates of Return on Invested Capital COGS Depreciation Operating Exp. Operating + + = Revenue Revenue Revenue Margin Dec-14A 59.2% 21.6% 19.4% -0.2% Dec-15A 59.1% 22.5% 17.0% 1.4% Dec-16A 63.9% 25.4% 19.3% -8.6% Dec-17F 73.8% 31.3% 19.2% 1.4% Dec-18F 73.6% 46.1% 19.8% -24.3% Working Capital Net PPE Other Assets Capital Year 1/ + + = Revenue Revenue Revenue Turnover Dec-14A 0.00 0.70 1.32 3.61 Dec-15A -0.02 0.73 1.25 0.49 Dec-16A -0.04 0.81 1.13 0.51 Dec-17F 0.01 0.99 1.15 0.53 Dec-18F 0.00 1.41 1.33 0.47 Operating Capital Cash After-tax Return Year x x = Margin Turnover Tax Rate on Inv. Capital Dec-14A 3.7% 3.6 79.7 10.7 Dec-15A -0.2% 0.5 80.6 -0.1 Dec-16A 1.4% 0.5 83.4 0.6 Dec-17F -8.6% 0.5 83.7 -3.8 Dec-18F -24.3% 0.5 80.0 -9.1 Year 1-
Source: KGI Research
November 2, 2017
*The Company may be issuer of Derivative Warrants on these securities. http://research.kgi.com; Bloomberg: KGIT
Please see back page for disclaimer
6
Thailand
Thaicom
Thaicom Plc – Recommendation & target price history Date
Rating
Target
Price
5-Oct-17 7-Aug-17 15-May-17 14-Feb-17 8-Dec-16
Underperform Underperform Underperform Underperform Underperform
18.70 18.10 17.90 19.00 20.70
17.30 15.70 17.50 19.50 20.00
24 22 20
18 16 14 12 Nov-16
Dec-16
Jan-17
Jan-17
Mar-17
Apr-17
Share price
May-17
May-17
Target price lowered
Jun-17
Jul-17
Aug-17
Sep-17
Oct-17
Target price raised
Source: KGI Research
KGI Locations
China
Shanghai
Room 1907-1909, Tower A, No. 100 Zunyi Road, Shanghai, PRC 200051 Room 24D1, 24/F, A Unit, Zhen Ye Building,2014 Bao’annan Road,
Shenzhen
Taiwan
Shenzhen, PRC 518008 Taipei
700 Mingshui Road, Taipei, Taiwan Telephone886.2.2181.8888 ‧
Hong Kong
Facsimile886.2.8501.1691
41/F Central Plaza, 18 Harbour Road, Wanchai, Hong Kong Telephone 852.2878.6888
Thailand Bangkok
Facsimile 852.2878.6800
8th - 11th floors, AsiaCentreBuilding 173 South Sathorn Road, Bangkok10120, Thailand Telephone 66.2658.8888
KGI's Ratings
Facsimile 66.2658.8014
Rating
Definition
Outperform (OP)
The stock's excess return* over the next twelve months is ranked in the top 40% of KGI's coverage universe in the related market (e.g. Taiwan).
Neutral (N)
The stock's excess return* over the next twelve months is ranked in the range between the top 40% and the bottom 40% of KGI's coverage universe in the related market (e.g. Taiwan).1.3
Under perform (U)
The stock's excess return* over the next twelve months is ranked in the bottom 40% of KGI's coverage universe in the related market (e.g. Taiwan).
Not Rated (NR)
The stock is not rated by KGI Securities.
Restricted (R)
KGI policy and/or applicable law regulations preclude certain types of communications, including an investment recommendation, during the course of KGI's engagement in an investment banking transaction and in certain other circumstances.
Excess return = 12M target price/current priceNote
Disclaimer
November 2, 2017
KGI Securities no event shall profits, arising to buy or sell
When an analyst publishes a new report on a covered stock, we rank the stock's excess return with those of other stocks in KGI's coverage universe in the related market. We will assign a rating based on its ranking. If an analyst does not publish a new report on a covered stock, its rating will not be changed automatically. (Thailand) Plc. (“The Company”) disclaims all warranties with regards to all information contained herein. In the Company be liable for any direct, indirect or any damages whatsoever resulting from loss of income or by utilization and reliance on the information herein. All information hereunder does not constitute a solicitation any securities but constitutes our sole judgment as of this date and are subject to change without notice.
*The Company may be issuer of Derivative Warrants on these securities. http://research.kgi.com; Bloomberg: KGIT
Please see back page for disclaimer
7