Molecular Ecology (2008) 17, 902–915
doi: 10.1111/j.1365-294X.2007.03615.x
Native range genetic variation in Arabidopsis thaliana is strongly geographically structured and reflects Pleistocene glacial dynamics Blackwell Publishing Ltd
J A M E S B . B E C K ,*† H E I K E S C H M U T H S ‡¶ and B A R B A R A A . S C H A A L * *Department of Biology, Washington University, St Louis, MO 63130, USA, †Missouri Botanical Garden, St Louis, MO 63166, USA, ‡Department of Agricultural and Environmental Sciences, School of BioSciences, University of Nottingham, Nottingham LE12 5RD, UK
Abstract Despite Arabidopsis thaliana’s pre-eminence as a model organism, major questions remain regarding the geographic structure of its genetic variation due to the geographically incomplete sample set available for previous studies. Many of these questions are addressed here with an analysis of genome-wide variation at 10 loci in 475 individuals from 167 globally distributed populations, including many from critical but previously un-sampled regions. Rooted haplotype networks at three loci suggest that A. thaliana arose in the Caucasus region. Identification of large-scale metapopulations indicates clear east–west genetic structure, both within proposed Pleistocene refugia and post-Pleistocene colonized regions. The refugia themselves are genetically differentiated from one another and display elevated levels of within-population genetic diversity relative to recolonized areas. The timing of an inferred demographic expansion coincides with the Eemian interglacial (approximately 120 000 years ago). Taken together, these patterns are strongly suggestive of Pleistocene range dynamics. Spatial autocorrelation analyses indicate that isolation by distance is pervasive at all hierarchical levels, but that it is reduced in portions of Europe. Keywords: Arabidopsis suecica, Arabidopsis thaliana, Eemian interglacial, Eurasia, Pleistocene refugia, trnL-trnF intergenic spacer Received 3 August 2007; revision accepted 26 October 2007
Introduction Like many model organisms, Arabidopsis thaliana (L.) Heynh. is frequently found in areas of human disturbance. These situations (roadsides, pastures, etc.) often support large A. thaliana populations (J. Beck personal observation), and its tiny seeds are viewed as easily transported by humans. This potential for frequent, long distance dispersal has led some researchers to assume that little or no genetic structure exists at large geographic scales in A. thaliana (Maloof et al. 2001), an idea at odds with the null hypothesis for Eurasian species with similar distributions. What we refer to as the ‘Pleistocene Paradigm’ describes the genetic structure Correspondence: James B. Beck, Department of Biology, Duke University, Durham, NC 27708, USA. Fax: (1) (919) 660–7293; Email:
[email protected] ¶Present address: Saaten-Union Resistenzlabor GmbH, Biopark Gatersleben, Am Schwabeplan 6, 06466 Gatersleben, Germany.
resulting from periodic north/south movements in response to the expansion and contraction of available habitat during the Pleistocene glacial cycles. During glacial advance and particularly during glacial maxima, genetic drift acted to alter allele frequencies in individual refugia, eventually leading to genetic divergence among them. As glaciers retreated, areas of now suitable habitat to the north were colonized by individuals from adjacent southern refugia, leading to an east–west pattern, or one in which zones of differing allele frequencies are encountered as one moves from east to west across the range (Marmi et al. 2006; Skrede et al. 2006; Zink et al. 2006). The recolonization process itself is thought to produce a second gradient, one of decreased genetic diversity in the recently colonized northern portion of the range relative to the southern refugia (Comes & Kadereit 1998). Human-mediated long distance dispersal can also impact the correlation between the geographic and genetic distances between populations, or isolation by distance © 2007 The Authors Journal compilation © 2007 Blackwell Publishing Ltd
A R A B I D O P S I S T H A L I A N A G E N E T I C S T R U C T U R E 903 (IBD). This pattern is driven by frequent gene flow between neighbouring populations relative to that between distant ones (Kimura & Weiss 1964), and is the result of both this ‘stepping-stone’ model of gene flow and drift/gene-flow equilibrium (Kimura & Weiss 1964; Hutchinson & Templeton 1999). Since A. thaliana primarily undergoes self-fertilization (Abbott & Gomes 1989), the potential for gene flow via pollen is extremely limited and violation of the stepping-stone model would be due to long distance seed dispersal. An intriguing possibility is that higher levels of human activity (Sanderson et al. 2002) in the European portion of A. thaliana’s range could lead to more frequent episodes of long distance dispersal, and therefore reduced levels of IBD. Intentional human dispersal has been implicated in previous population genetic studies of European taxa such as wild cherry (Prunus avium, Mohanty et al. 2001), the brown hare (Lepus europaeus, Kasapidis et al. 2005), and perennial ryegrass (Lolium perenne, -Warren et al. 1998). Such human dispersal would be almost assuredly unintentional in an organism such as A. thaliana, which was until recently of little human interest. Although over 30 population genetic studies have been carried out in A. thaliana, only eight (Sharbel et al. 2000; Symonds & Lloyd 2003; Schmuths et al. 2004; Nordborg et al. 2005; Bakker et al. 2006; Jakobsson et al. 2006a; Ostrowski et al. 2006; Schmid et al. 2006) included the geographic sampling necessary for range-wide population genetic analysis. This lack of sampling is due to the frequent use of stock centre accessions, which are often single-individual population samples primarily from Central or Western Europe, with few or no representatives from Eastern Europe, European Russia, the Caucasus, or Central Asia. This sampling bias has consistently limited insight into A. thaliana population genetics, and a call for expanded sampling has been echoed by many in the Arabidopsis field (Mitchell-Olds 2001; Hoffmann et al. 2003; Bakker et al. 2006; Ostrowski et al. 2006). Although east–west genetic structure is apparent in certain prior studies, most included notable sampling in only one potential refugial area, the Iberian Peninsula. Lack of samples from Italy, the Balkans, and the Caucasus seriously limits the ability to evaluate Pleistocene influences (Hoffmann et al. 2003; Bakker et al. 2006). No study to date has evaluated the expected diversity gradient, due primarily to the lack of samples in many potential southern refugia. Results of range-wide tests for IBD have been mixed, as three studies (Sharbel et al. 2000; Schmuths et al. 2004; Schmid et al. 2006) have indicated significant overall IBD, while others (Bakker et al. 2006; Ostrowski et al. 2006) failed to detect such a pattern. These divergent results could be due in part to the differing sample sets, markers, and analytical methods employed in these studies, and further work is needed to build a consensus regarding IBD in A. thaliana. Important population genetic questions remain beyond basic issues of genetic structure, including identifying the © 2007 The Authors Journal compilation © 2007 Blackwell Publishing Ltd
area and timing of A. thaliana’s origin and identifying genotypes involved in the origin of the hybrid species Arabidopsis suecica (Fries) Norrlin. Older, more inclusive definitions of Arabidopsis included many Central Asian species, leading some to hypothesize a Central Asian origin for A. thaliana (Hoffmann 2002). However, a recent molecular phylogenetic study (O’Kane & Al-Shehbaz 2003) demonstrated that historical definitions of Arabidopsis were nonmonophyletic, and the genus was redefined to include eight species, six of which are European endemics. This raises the alternative hypothesis that the common ancestor of Arabidopsis resided in Europe, and that A. thaliana arose there along with its close relatives. Haplotype network approaches provide a potential test for these alternative hypotheses. If ancestral A. thaliana haplotypes identified through outgroup rooting are geographically restricted, then their current geographic location will suggest an ancestral area for the species. Although the allopolyploid A. suecica has been shown to be a recently derived hybrid (Jakobsson et al. 2006a, b) between A. thaliana and a member of the Arabidopsis arenosa (L.) Lawalrée species complex (Beck et al. 2007), the geographic location of this hybridization event remains unclear. If the alleles present in the maternal (A. thaliana) component of this hybrid taxon are geographically restricted in the context of A. thaliana’s range, this would provide insights into the site of the hybridization event. Identifying this location would allow researchers to prospect for extant A. thaliana individuals carrying the genome most similar to the one that participated in the hybridization event, enhancing the value of the A. thaliana/A. suecica system as a model for investigating hybridization. These considerations lead to several research questions. Where did A. thaliana arise? Do proposed Pleistocene refugia exhibit genetic divergence relative to one another? Is genetic diversity higher in refugial areas relative to recently colonized areas? Is there a significant pattern of IBD across the native range? Are levels of IBD similar in areas of both high and low human activity? Where did the hybrid A. suecica arise? We investigate these questions with an analysis of genetic variation at 10 loci in 475 individuals from 167 populations. The 10 loci are genome-wide, taken from both the chloroplast and all five A. thaliana chromosomes. Critically, the sample set includes 313 individuals from 46 populations never before analysed, many of which are from previously undersampled portions of A. thaliana’s range, greatly enhancing our ability to understand global population genetic structure in this model species.
Materials and methods Sample information appears in Table S1, Supplementary material. The sample set comprised 475 individuals from 167 populations sampled across both the native and
904 B . B E C K , H . S C H M U T H S and B . A . S C H A A L J
introduced range of Arabidopsis thaliana. Three of these were single-individual Arabidopsis suecica populations, and the 472 A thaliana populations ranged from one to 16 individuals (mean 2.9). All individuals grouped into a population were separated by less than 5 km. This set included 402 samples recently collected by the authors or their collaborators, with the remaining samples obtained from either the Nottingham Arabidopsis Stock Center or the Arabidopsis Biological Resource Center (ABRC). Approximately 70% of these recently obtained individuals were collected as seed in the field. Bulk seed via self-fertilization was obtained for 261 of these samples, and is available through the ABRC. Although only three samples of A. suecica were analysed, this species is the result of a single, recent hybridization event (Jakobsson et al. 2006b), and displays low levels of genetic variability (Lind-Halldén et al. 2002). Our three samples thus are exemplars for this species.
PCR amplification, sequencing, and genotyping The primary data set comprised two DNA sequence regions (one chloroplast, one nuclear) and eight microsatellite loci, which together included a marker from the chloroplast genome and at least one from each of the five A. thaliana chromosomes. The chloroplast trnL-trnF intergenic spacer was amplified with the primers ‘trn e’ (Taberlet et al. 1991) and ‘trn f.1’ (5′-CAGTCCTCTGCTCTACCAAC-3′), which was designed to avoid double priming. Since A. thaliana is the maternal parent of the hybrid A. suecica (Säll et al. 2003), the chloroplast haplotype we observed in this sample is in effect one of A. thaliana. A portion of the 5′ flanking region of the nuclear Atmyb2 gene (Kamiya et al. 2002) was amplified with the primers ‘ATM 1’ (5′-CCCTAAACTCGCCTAACTCC-3′) and ‘ATM 4’ (5′-ATTCGCTCGTAATCTTCC-3′), both designed for this study. Using cloning, both the paternal and maternal alleles from A. suecica were previously isolated at this locus (Beck et al. 2007), and only the A. thaliana alleles in our A. suecica samples were analysed. For the ancestral haplotype analysis a third locus, approximately 700 bp of the IVS 1 intron of the nuclear MADS-box gene PISTILLATA, was amplified with the primers ‘pi504’ and ‘pi 1254R’ (Bailey & Doyle 1999). Although we did not sequence this region in all samples, an attempt was made to maximize the number of populations represented (204 individuals from 160 populations). All regions were amplified through polymerase chain reaction (PCR) under standard conditions. Products were dye-labelled using a Big Dye Terminator Kit (Applied Biosystems), and analysed on an Applied Biosystems 3700. Sequences were aligned manually with se-al 2.0 (Rambaut 1996), and alignments are available upon request to the first author. Length variation at eight microsatellite loci (nga151, nga162, nga172, nga225, nga229 — Bell & Ecker 1994; ZFPG — Symonds & Lloyd 2003; athDET1, ICE10 — Clauss et al.
2002) was determined. Twenty-microlitre reactions contained 2.5 mm MgCl2, 0.2 mm deoxyribonucleotides, 4 pmoles fluorescently labelled (6FAM, HEX, NED, VIC, Applied Biosystems) forward primer, 4 pmoles reverse primer, 2 μL Promega buffer, and 0.5 U of Promega Taq polymerase. Reactions involved denaturing at 94 °C (3 min), 35 cycles of 94 °C denaturing (20 s), 55 °C annealing (30 s), and 72 °C extension (2 s), followed by a final extension step at 72 °C (20 s). Amplicons were sized using 400HD ROX on an Applied Biosystems 3700. Allele sizes were determined using genemapper 3.7 (Applied Biosystems). Although we did not attempt to amplify Arabidopsis arenosa samples as positive controls, and the potential therefore existed for recovering paternal (not maternal A. thaliana) microsatellite alleles in the A. suecica samples, two of the three A. suecica samples were completely homozygous for alleles observed in A. thaliana. The third was heterozygous at three loci, but in each case one of the alleles was outside of the size range of alleles observed in A. thaliana. These divergent alleles were presumed to be paternal and were not considered. The mistaken scoring of A. arenosa alleles at A. suecica loci would therefore involve an unlikely scenario where null alleles were present at the A. thaliana (maternal) loci and alleles exactly matching those already observed in A. thaliana were present at the A. arenosa (paternal) loci.
Data analysis Haplotype networks for each DNA sequence locus were generated using tcs 1.18 (Clement et al. 2000). The Tajima’s D (Tajima 1989) statistic (for all three loci) and the mismatch distribution of the chloroplast trnL-trnF region were evaluated in arlequin 3.0 (Excoffier et al. 2005). Both demographic events and recombination can affect the shape of the mismatch distribution (Rogers & Harpending 1992), and the nonrecombining chloroplast locus was therefore chosen as the most reliable indicator of demographic events. The fit of the mismatch distribution to one modelled under a hypothesis of historical demographic expansion was evaluated with the ‘raggedness statistic’ of Harpending (1994). The value ‘tau’, which estimates the timing in mutational units of the inferred expansion event (Rogers & Harpending 1992), was also estimated. The approach outlined in Bartish et al. (2006) was used to combine prior estimates of mutation rate at the trnL-trnF spacer with values of tau to estimate the onset of any inferred historical demographic expansion. In order to identify ancestral haplotypes, sequences from Arabidopsis lyrata (L.) O’Kane & Al-Shehbaz ssp. petraea (L.) O’Kane and & Al-Shehbaz were used to root the trnL-trnF, PISTILLATA, and Atmyb2 haplotype networks in tcs 1.18. Sequences from multiple Arabidopsis species were used in preliminary attempts to root the Atmyb2 and PISTILLATA networks, and this taxon displayed minimal divergence © 2007 The Authors Journal compilation © 2007 Blackwell Publishing Ltd
A R A B I D O P S I S T H A L I A N A G E N E T I C S T R U C T U R E 905 from A. thaliana haplotypes in both cases (data not shown). To minimize the branch connecting the ingroup to the outgroup, sites involved in insertion/deletion events were not analysed. Unless otherwise specified, the multilocus analyses below incorporated all 10 loci scored in all 475 individuals. Unless otherwise noted, the loci were treated as unphased, diploid loci with the chloroplast spacer assumed to be a completely homozygous diploid locus. Range-wide population structure was inferred using structure (Pritchard et al. 2000). Due to the high rate of selfing in A. thaliana, many loci were expected to be homozygous, and therefore nonindependent, violating one of the fundamental assumptions of structure. As recommended by Falush et al. (2003), the data were therefore treated as haploid, with one of the alleles at each heterozygous position selected at random. Variants at each of the two DNA sequence loci were considered as haplotypes, since considering each individual (and tightly linked) variable position at a locus would also violate the data independence assumption. The admixture and correlated allele frequency options were used, and a strategy of a 30 000 iteration burn-in period followed by a 100 000 iteration data collection phase was used. Twenty replicate runs each were performed at K = 1 to K = 9. The parameter ‘ΔK’ (Evanno et al. 2005) was evaluated to determine the optimal K value. It should be noted that the A. thaliana ‘populations’ inferred by structure are not populations in the conventional sense. Rather, the large-scale groups inferred by structure should be viewed as metapopulations, or networks of local populations connected by patterns of gene flow over long timescales. An analysis of molecular variance (amova) was performed using arlequin 3.0. In the first amova, the haploid chloroplast marker was excluded, and the between-population, within-population, and within-individual variance components were assessed in the remaining diploid nuclear data set. A second amova assessed the between- and within-population variance components using the haploid chloroplast locus. Significance was assessed through permutation analysis (10 000 replications). In order to evaluate the hypothesis of genetic differentiation between proposed refugia, the significance of allelic differentiation and pairwise FST between pairs of refugia was assessed in arlequin 3.0. Proposed refugia included the Iberian, Italian, and Balkan Peninsulas, the Caucasus region, and Central Asia (samples from modern day Tajikistan, Uzbekistan, and southern Kazakhstan). The first four have been inferred from genetic data in a broad array of organisms, and the Central Asian refugium was included due to the isolating potential of the Caspian Sea and the arid regions of modern day Turkmenistan, western Kazakstan, and western Uzbekistan. The test of allelic differentiation evaluates the null hypothesis that alleles are randomly distributed between pairs of refugia through permutation © 2007 The Authors Journal compilation © 2007 Blackwell Publishing Ltd
testing, and rejection of the null hypothesis indicates significant genetic differentiation between the refugia in question. In order to test the prediction of higher genetic variation in proposed refugia, average within-population allelic richness in northern vs. southern Eurasia was compared. We used 47°N latitude as an approximation of the boundary between potential refugial areas and uninhabitable areas to the north (either glacial ice or permafrost) (Williams et al. 1993). Average within-population allelic richness of multiple-individual populations either north or south of 47°N latitude was computed and the significance of the difference between the two averages was assessed with permutation testing (15 000 replications) in fstat 2.9.3 (Goudet 1995). Isolation by distance was assessed with a spatial autocorrelation analysis on the 10-locus data set in genalex 6.0 (Peakall & Smouse 2006). genalex calculates an autocorrelation coefficient ‘r’ for individuals in multiple geographic distance classes, and assesses the significance of r values with bootstrapping (Smouse & Peakall 1999). A significantly positive r value indicates that individuals separated by distances within that distance class are more similar to one another than would be expected under a random geographic distribution of individuals; a significantly negative r value indicates the converse. Six analyses were conducted: (i) all 445 Eurasian individuals (excluding samples from the Canary and Cape Verde Islands and the A. suecica samples); (ii) the 19 North American individuals; (iii) all 262 European individuals; (iv) the 132 European individuals north of 47°N latitude; (v) the 80 Asian individuals; and (vi) the 57 Asian individuals north of 47°N latitude. Isolation by distance depends on both stepping-stone population structure and drift/gene-flow equilibrium, and areas recently recolonized following glacial retreat are likely in a state of nonequilibrium (Hutchinson & Templeton 1999). Evaluating violation of the stepping stone model (due to human-mediated long distance dispersal) should therefore involve comparisons among either refugial or recolonized areas, and not those between these groups. Given the small sample size (23 individuals) available in the Central Asia refugium, only the comparison between the two recolonized areas was considered.
Results The 10-locus haplotypes for all 475 individuals are presented in Table S1. Chloroplast trnL-trnF sequences varied in length from 447 to 662 bp. The aligned data matrix was 679 bp, including a 232-bp region (positions 238–470) which exhibited extensive length variation due to the presence of pseudogenized copies of the adjacent trnF coding region (Koch et al. 2005, 2007). The number and structure of such copies rendered alignment uncertain, and this region was excluded from the analysis. The remaining alignment exhibited four insertion/deletion polymorphisms, all of
906 B . B E C K , H . S C H M U T H S and B . A . S C H A A L J
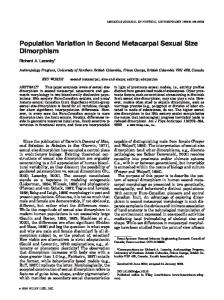
Fig. 1 Chloroplast trnL-trnF haplotype network and geographic array of haplotypes. In the network, box colour/size indicates frequency (small, no colour = singleton; small, coloured = 1–10 samples; medium, coloured = 10–49 samples; large, coloured = 50 or more samples). Haplotypes one, two, 10, and 15 are inferred as ancestral (see text). The grey shaded area is A. thaliana’s contiguous native range, with grey points representing isolated occurrences (adapted from Hoffmann 2002). Circles indicate population locations, a lone circle represents a single-individual population, associated boxes represent multiple individuals sampled in that population. Circles below the map represent samples from western North America (left), eastern North America (centre), and East Asia (right). Sample numbers correspond to Table S1.
which were analysed as single events. The full haplotype network comprised 16 haplotypes (Fig. 1). PISTILLATA sequences varied in length from 642 to 679 bp. The aligned data matrix was 683 bp, including seven insertion/ deletion polymorphisms, six of which were analysed. One polymorphism was excluded due to length variation at a dinucleotide repeat, which was considered potentially homoplastic. The full haplotype network comprised 24 haplotypes (Fig. 2). Atmyb2 flanking region sequences varied in length from 695 to 712 bp. The aligned data matrix was 713 bp, including five insertion/deletion polymorphisms, four of which were analysed. The polymorphism not considered was due to length variation at a multinucleotide repeat, which was considered potentially homoplastic. The full haplotype network comprised 21 haplotypes (Fig. 3).
Tajima’s D-values for all three regions were negative, although only significantly so at trnL-trnF (trnL-trnF = –1.6931, P = 0.0122; Atmyb2 = –1.2992, P = 0.068; PISTILLATA = –1.0506, P = 0.14). A significantly negative Tajima’s D value is a general feature of the Arabidopsis thaliana genome (Schmid et al. 2005), and is consistent with demographic forces, such as population growth (Aris-Brosou & Excoffier 1996), rather than non-neutral forces such as selection. The results of the mismatch analysis were also consistent with this interpretation, as the distribution at trnL-trnF fails to reject the sudden demographic expansion model both if indels are included (sum of squared deviations = 0.000205, P = 0.72; raggedness index = 0.098, P = 0.69) or excluded (sum of squared deviations = 0.000321, P = 0.28; raggedness index = 0.116, P = 0.46). Säll et al. (2003) estimated a rate of © 2007 The Authors Journal compilation © 2007 Blackwell Publishing Ltd
A R A B I D O P S I S T H A L I A N A G E N E T I C S T R U C T U R E 907
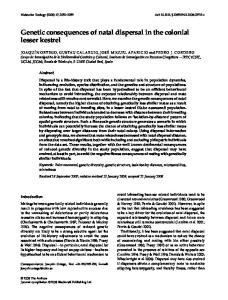
Fig. 2 Nuclear PISTILLATA IVS 1 haplotype network and geographic array of haplotypes. In the network, box colour/size indicates frequency (small, no colour = singleton; small, coloured = 1–10 samples; medium, coloured = 10–49 samples; large, coloured = 50 or more samples). Haplotypes eight and 22 are inferred as ancestral (see text). The grey shaded area is Arabidopsis thaliana’s contiguous native range, with grey points representing isolated occurrences (adapted from Hoffmann 2002). Circles indicate population locations, a lone circle represents a single-individual population, associated boxes represent multiple individuals sampled in that population. Circles below the map represent samples from western North America (left), eastern North America (centre), and East Asia (right). Sample numbers correspond to Table S1.
2.9 × 10⁻⁹ changes per site per year for noncoding sequence in the single-copy region of the A. thaliana chloroplast genome (indels excluded), a set of sequences which includes the trnL-trnF spacer. This rate and the estimates of tau (indels excluded) indicate that the demographic expansion began approximately 122 000 years ago, with lower and upper bounds at 74 000 and 156 000 years ago.
Ancestral haplotype identification With indels removed, the rooted trnL-trnF network comprised 10 haplotypes, and the Arabidopsis lyrata ssp. petraea sequence was connected to the ingroup by 12 steps. This branch length was beyond the 95% statistical parsimony confidence limit (8 steps), but within the 90% confidence © 2007 The Authors Journal compilation © 2007 Blackwell Publishing Ltd
limit (12 steps). The inferred ancestral haplotype comprised haplotypes one, two, 10, and 15 in the full network. These four haplotypes were geographically widespread, primarily due to the ubiquity of haplotype one (Fig. 1). The rooted PISTILLATA network comprised 21 haplotypes, and the outgroup sequence was connected to the ingroup by 39 steps. This branch length was beyond both the 95% and 90% statistical parsimony limits (10 and 14 steps, respectively). The inferred ancestral haplotype comprised haplotypes eight and 22 in the full network, and these haplotypes were found in Europe and the Caucasus (Fig. 2). The rooted Atmyb2 network comprised 15 haplotypes, and the outgroup sequence was connected to the ingroup by 18 steps. This branch length was beyond both the 95% and 90% statistical parsimony limits (10 and 14 steps, respectively). The inferred
908 B . B E C K , H . S C H M U T H S and B . A . S C H A A L J
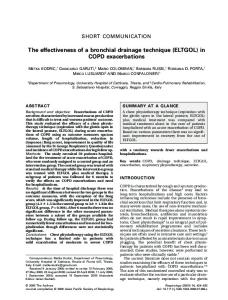
Fig. 3 Nuclear Atmyb2 haplotype network and geographic array of haplotypes. In the network, box colour/size indicates frequency (small, no colour = singleton; small, coloured = 1–10 samples; medium, coloured = 10–49 samples; large, coloured = 50 or more samples). Haplotypes 4 and 15 are inferred as ancestral (see text). The grey shaded area is Arabidopsis thaliana’s contiguous native range, with grey points representing isolated occurrences (adapted from Hoffmann 2002). Circles indicate population locations, a lone circle represents a singleindividual population, associated boxes represent multiple individuals sampled in that population. Circles below the map represent samples from western North America (left), eastern North America (centre), and East Asia (right). Sample numbers correspond to Table S1.
ancestral haplotype comprised haplotypes four and 15 in the full network. These haplotypes were restricted to the Caucasus, observed in three populations from Georgia and Azerbaijan (Fig. 3).
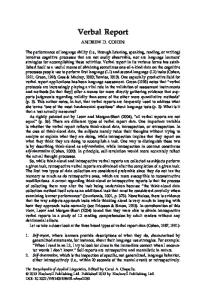
Evaluation of range-wide genetic structure The structure results (Fig. 4) clearly demonstrated genetic structure across the Eurasian range. The parameter ΔK was maximized at K = 2, and group assignments for all 475 individuals are shown for both K = 2 and K = 3. At K = 2, the range was divided between largely European and largely Asian metapopulations, and at K = 3, the European metapopulation was divided into largely eastern and
western metapopulations. In the K = 2 analysis, the 25 nonnative samples from North America and East Asia were assigned to the European metapopulation, with the exception of sample 815 (Kyoto, Japan), which exhibited a genome partially (34%) assigned to the Asian metapopulation, and sample 896 (Anhui Province, China), which was largely (97%) assigned to the Asian metapopulation (Fig. 4). The maternal components of the three A. suecica samples (800, 894, and 895) were almost entirely assigned (94%, 99% and 97%, respectively) to the Asian metapopulation. Interestingly, two of these samples displayed a strikingly high similarity to samples from China. Arabidopsis suecica sample 894 shared alleles with the A. suecica sample from Anhui Province, China at nine of the 10 loci, and A. suecica sample © 2007 The Authors Journal compilation © 2007 Blackwell Publishing Ltd
A R A B I D O P S I S T H A L I A N A G E N E T I C S T R U C T U R E 909
Fig. 4 Results of the structure analysis. The grey shaded area is Arabidopsis thaliana’s contiguous native range, with grey points representing isolated occurrences (adapted from Hoffmann 2002). Circles indicate population locations, a lone circle represents a single-individual population, associated small circles represent multiple individuals sampled in that population. Circles below the map represent samples from western North America (left), eastern North America (centre), and East Asia (right). Sample numbers correspond to Table S1. Asterisks indicate individuals heterozygous at one or more of the nine nuclear loci. Colours indicate assignment to one of two or three inferred groups. Circles exhibiting multiple colours indicate notable variation from multiple groups, with the percentage of the individual’s genome originating from each group indicated in the inset. (A) K = 2; (B) K = 3. © 2007 The Authors Journal compilation © 2007 Blackwell Publishing Ltd
910 B . B E C K , H . S C H M U T H S and B . A . S C H A A L J
Fig. 5 Results of the spatial autocorrelation analysis. Each box details the results for a particular geographic region. Within each box the number of samples included in that region is indicated in parentheses. Geographic distance classes are plotted against the autocorrelation value ‘r’ for samples included in that class. Individual r values are connected with a bold line. Asterisks indicate that the 95% confidence interval (obtained via bootstrapping) for the r value at that distance does not include zero; asterisks above the distance class number indicated positive r-values, those below the distance class number indicate negative r-values. The broken lines denote the upper and lower bounds of r under the null hypothesis of a random distribution of genotypes (Smouse & Peakall 1999).
895 shared nine of 10 alleles with the A. thaliana sample from Xinjiang Province, China. The amova framework indicated significant genetic structure at all hierarchical levels (Table 1). Overall FST values for the two genomes were qualitatively similar (nuclear 0.53, chloroplast 0.61). The allelic differentiation and FST analyses indicated significant genetic differentiation between all hypothesized refugial pairs. Alleles were nonrandomly distributed between all pairs of refugia except for the Balkans and Italy, and all refugial comparisons exhibited significant pairwise FST values (Table 2). Consistent with recent colonization of northern Eurasia, the test of allelic richness indicated that populations in the southern part of the range contained more within-population variation than the north (P = 0.02567). Consistent with the structure and amova results, the spatial autocorrelation analyses indicated significant genetic
Table 1 amova results
Data
Between populations*
Within populations*
Within individuals*
trnL-trnF 9 nuclear loci
61% 53.07%
39% 45.75%
NA 1.17%
*Per cent variance attributed to different components is indicated, all values were highly significant (P ≤ 0.00001).
structure at all hierarchical levels in Eurasia (Fig. 5). The total Eurasian data set displayed significantly positive r values at distances of up to 2000 km, and significantly negative r values at greater distances. Both the Europe, Asia, and recolonized Asia data sets generally displayed significantly positive r values up to 1000 km, and significantly negative © 2007 The Authors Journal compilation © 2007 Blackwell Publishing Ltd
A R A B I D O P S I S T H A L I A N A G E N E T I C S T R U C T U R E 911
Refugium
Iberia
Italy
Balkans
Caucasus
Central Asia
Iberia Italy Balkans Caucasus Central Asia
— *** *** *** ***
0.1494** — 0.182 n.s. ** ***
0.09398*** 0.07903* — *** ***
0.08896*** 0.1443*** 0.09424*** — ***
0.2897*** 0.3542*** 0.281*** 0.2822*** —
Table 2 Allelic differentiation and pairwise FST results
Values above the diagonal are pairwise FST values (*P < 0.05; **P < 0.01; ***P < 0.001). Asterisks below diagonal indicate significance of pairwise allelic differentiation. One nonsignificant P value (Balkans/Italy comparison) is shown.
values at greater distances. In contrast, although the recolonized Europe data set displayed significant r values at certain distance classes, a departure from the general Eurasian trend was evident, including a significantly negative r at the 11–25 km distance class, and nonsignificant values at the 101–250, 501–1000, and 3001–4110 (maximum) km classes. The 19 North American samples displayed positive r values at certain low distance classes (0–10, 11–25, 26–50, and 101–250 km), a significantly negative value at 501–1000 km, and nonsignificant values at remaining distance classes.
Discussion The results of all analyses designed to evaluate the effects of glacial isolation and recolonization strongly suggest that Arabidopsis thaliana is no exception to the Pleistocene Paradigm. Both the significantly negative Tajima’s D value at the trnL-trnF region and the results of the mismatch analyses are consistent with demographic expansion. Interestingly, the estimated onset of the inferred expansion at 122 000 years ago lies directly within the Eemian interglacial, an approximately 10 000-year warm period during which estimated temperatures across much of Europe were at or above present values (Kaspar et al. 2005). It should be noted that the inferred demographic expansion is likely not the only such event that has occurred in A. thaliana’s history. Demographic expansions and contractions are to be expected during each glacial cycle, events that A. thaliana has assuredly participated in multiple times. It is presently unclear if such inferences drawn from mismatch distributions represent the most influential or the most recent of these events. The structure analysis infers large-scale metapopulations with clear east–west structure, particularly evident in the K = 3 diagram (Fig. 4B), where the source of each of the three major metapopulations found in glaciated areas can be traced to adjacent southern refugia. Although our sampling precludes a precise identification of the longitude at which the Asian and European metapopulations meet (Fig. 4A), the contact zone lies between 30° and 50°E © 2007 The Authors Journal compilation © 2007 Blackwell Publishing Ltd
longitude, approximately north of the Black and Caspian Seas. These bodies of water served as dispersal barriers themselves, and during glacial maxima permafrost extended south to or near the northern borders of both seas (Williams et al. 1993). Additionally, the Caspian Sea level rose to as much as 30 m above its present-day depth during recent interglacials, filling the Caspian Depression to the north, potentially as far as 50°N latitude (Mamedov 1997). These ‘Caspian Transgressions’ limited the dispersal corridor made available during glacial retreat, exacerbating the isolating effects of the glacial periods. There are several other examples of east–west phylogeographic discontinuities in this area (Marmi et al. 2006; Skrede et al. 2006; Zink et al. 2006), suggesting that these biogeographic forces have affected a broad array of organisms. With regards to the refugia themselves, both the pairwise FST and allelic differentiation tests indicate significant genetic differentiation between all pairs of refugia. Differentiation is particularly strong between the Central Asian refugium and all others, suggesting that either small historical population sizes in Central Asia, relatively limited gene flow between Central Asia and other areas, or a combination of the two have produced relatively strong genetic drift in this region. The expected latitudinal diversity gradient is also evident, with populations in the north exhibiting reduced withinpopulation diversity relative to populations in the south.
The extent of isolation by distance The observation of significantly positive r values at local and regional scales, which in turn give way to significantly negative r values at higher spatial scales (Fig. 5), is convincing evidence of pervasive IBD in A. thaliana. These conclusions are consistent with similar analyses of genetic structure at both local (Berge et al. 1998) and range-wide (Sharbel et al. 2000; Schmuths et al. 2004; Schmid et al. 2006) scales. The recolonized Europe range in general displays a reduced signal of IBD relative to the recolonized Asia sample, exhibiting a lower absolute r value at all but the smallest (0–5 km) distance class. These results are a novel demonstration of a departure from the stepping-stone model
912 B . B E C K , H . S C H M U T H S and B . A . S C H A A L J
of population structure in A. thaliana’s recolonized European range, potentially via human-mediated dispersal. The leading alternative explanation is that of greater A. thaliana population density in Europe, which would lead to potentially higher gene flow relative to that in Asia. Indeed, during our fieldwork, we encountered a substantially higher population density in Europe relative to Central Asia, although it should be noted that European populations were almost always found in areas of heavy human influence (fields, roadsides, etc.). The influences of human activity and plant population density on IBD may therefore be difficult to disentangle.
Where did A. thaliana arise? The geographic locations of inferred ancestral haplotypes suggest that the Caucasus is the leading candidate for A. thaliana’s ancestral area. Although the branch length between A. thaliana and the outgroup at PISTILLATA and Atmyb2 exceed the limits of statistical parsimony, the single most parsimonious tree resulting from a parsimony search in paup* 4.0b10 (Swofford 2002) for either locus exhibits a consistency index of one, indicating a complete lack of homoplasy at both loci (Hillis et al. 1996). It is therefore unlikely that, for example, the Atmyb2 symplesiomorphy shared by haplotypes four, 15, and the Arabidopsis lyrata ssp. petraea sequence arose in parallel. Furthermore, the results of the K = 3 structure analysis (Fig. 4B) indicate that all three major metapopulations are present in the Caucasus, consistent with an early diversification in this region. From a macro-evolutionary standpoint, the Caucasus forms part of the Irano-Turanian floristic region and is adjacent to the Mediterranean floristic region (Takhtajan 1986), which combined exhibit 78% of the total genera and 44% of the total species in the family Brassicaceae (Koch & Kiefer 2006). These two regions are traditionally viewed as containing the ancestral area for the family (Hedge 1976), and have been implicated in the origin of other Brassicaceae species (Koch et al. 2006). The suggestion of the Caucasus as the ancestral area, however, must be considered tentative given alternative scenarios that could produce such a pattern. The most likely alternative scenario is one in which A. thaliana arose elsewhere, with ancestral alleles later becoming fixed in the Caucasus due to relatively high effective population sizes in this region. Additionally, the geographic array of haplotypes at PISTILLATA and Atmyb2 represent the outcomes of the coalescent process at only two loci, and similar analyses at many loci are needed to determine if A. thaliana carries the genomic signature of a Caucasian origin.
Origin of the hybrid A. suecica The structure analysis strongly assigns the maternal genome of all three Arabidopsis suecica samples to the Asian
metapopulation, and the striking similarity of two of the A. suecica maternal genomes to A. thaliana genomes from China is in conflict with prevailing hypotheses regarding the site of A. suecica’s origin. A. suecica is currently known from Fennoscandinavia and the Baltic (Hoffmann 2005), and its paternal parent is a member of the Arabidopsis arenosa species complex (Beck et al. 2007), a group largely restricted to Central and Eastern Europe (Hoffmann 2005). In addition, A. suecica maternal genomes are most similar to those from Eastern European A. thaliana individuals in previous studies (Säll et al. 2003; Jakobsson et al. 2006a, b), although these included limited sampling outside of Europe. These observations have led to the prevailing view (Clauss & Koch 2006; Jakobsson et al. 2006a, b) that the origin of A. suecica occurred in Europe. The similarity between the A. suecica and Chinese A. thaliana samples in this study suggests additional scenarios, including the long distance dispersal of A. suecica or the A. thaliana Chinese genotypes from the site of hybridization, or the extinction of either group at this site and intervening areas. We also cannot exclude the possibility that we failed to sample A. thaliana individuals which exhibit these genotypes closer to A. suecica’s extant range. If A. suecica did arise in Asia, far from its extant range and that of its paternal parent, it would be another case in which the current ranges of hybrids and/or parental species are poor predictors of the site of hybridization (Cronn & Wendel 2003; James & Abbott 2005). Future research using A. suecica as a model for the genomic consequences of hybridization will require the analysis of A. thaliana genomes most similar to those participating in the original hybridization event. Our results strongly indicate that corresponding collecting efforts should be focused on the eastern edge of A. thaliana’s range.
Origin of non-native populations The results of the structure analysis (Fig. 4) clearly demonstrate that all North American and three of the five East Asian samples are part of the European metapopulation, indicating that Europe was the source area for the bulk of non-native samples worldwide. However, the presence of East Asian individuals carrying genomes either partially or largely assigned to the Asian metapopulation raises interesting questions. Although there is a large gap in the contiguous distribution of A. thaliana between western China (approximately 90°E longitude) and the Korean peninsula and Japan, scattered records do exist from this area (Hoffmann 2002). It is therefore possible that individuals in East Asia are: (i) recent introductions from the European metapopulation; (ii) recent introductions from the Asian metapopulation; (ii) part of an under-sampled extension of the Asian metapopulation; or (iv) the result of recent admixture between these groups. Expanded collection and © 2007 The Authors Journal compilation © 2007 Blackwell Publishing Ltd
A R A B I D O P S I S T H A L I A N A G E N E T I C S T R U C T U R E 913 analysis of populations from East Asia are needed to evaluate these hypotheses.
Conclusions Our analysis of genome-wide variation in an expansive Arabidopsis thaliana sample set indicates that the array of genetic variation in A. thaliana is highly geographically structured. This structure is strongly suggestive of Pleistocene glacial dynamics, and ongoing analyses will allow explicit hypotheses regarding the number of refugia and the timing of isolating events to be tested. Of particular interest is the timing of divergence between the European and Asian metapopulations, which could be the result of relatively recent isolation in alternative refugia, or the remnant of a relatively old fragmentation event. Isolation by distance, while pervasive across A. thaliana’s range, is reduced in Europe, potentially due to recent human-mediated gene flow. This pattern is particularly important for researchers wishing to link phenotypic and genotypic trends with changing environments across A. thaliana’s range (Caicedo et al. 2004; Edwards et al. 2005), relationships that would be complicated by such elevated gene flow. These and other insights have major implications for the design and interpretation of future A. thaliana studies, particularly those searching for the genetic basis of adaptation. While the genetic tools needed for identifying the loci responsible for phenotypes are readily available (Mitchell-Olds 2001; Jackson et al. 2002), linking naturally occurring alleles at these loci with adaptive phenotypes requires explicit knowledge of A. thaliana’s background population genetic structure (MitchellOlds & Schmitt 2006), a subject we hope to have illuminated in this study.
Acknowledgements We thank the following for their gracious assistance with fieldwork: Ali Dönmez and Birol Mutlu (Turkey); Valida Ali-Zade, Vahid Hajiyev, and Hadjiaga Safarov (Azerbaijan); Kamilla Tamanian and George Fayvush (Armenia); Manana Khutsishvili (Georgia); Sergei Mosyakin, Andriy Yena, and Olga Korniyenko (Ukraine); Mauricio Parra and Juan Martínez Laborde (Spain); Manzura Agzamova (Uzbekistan); Mikhail Danilov and Isa Baitulin (Kazakhstan); Spassimir Tonkov and Asen Asenov (Bulgaria); Olja Vasic, Boris Ivancevic, and Aleksandar Veljkovic (Serbia); Vanja Stamenkovic and Sanja Kovacic (Croatia); Nicolai Ermakov (Russia). Doug Schemske and Marck Menke (USA); Hongya Gu (China); Frieda Billiet (Belgium); Kai Larsen (Denmark); and Heather McHaffie (Scotland) generously provided seeds. The authors would also like to thank Ihsan Al-Shehbaz, Tatyana Shulkina, and Peter Raven for scientific and logistic support, the Schaal Laboratory for helpful discussions, and the Jeanette Goldfarb Plant Growth Facility (WU) for greenhouse assistance. J. B. B. was supported by a National Science Foundation Graduate Research Fellowship DGE-0202737, a National Science Foundation DDIG grant DEB-0411875, and the Division of Biology and Biomedical Sciences (WU). © 2007 The Authors Journal compilation © 2007 Blackwell Publishing Ltd
References Abbott RJ, Gomes MF (1989) Population genetic structure and outcrossing rate of Arabidopsis thaliana (L.) Heynh. Heredity, 62, 411–418. Aris-Brosou S, Excoffier L (1996) The impact of population expansion and mutation rate heterogeneity on DNA sequence polymorphism. Molecular Biology and Evolution, 13, 494–504. Bailey CD, Doyle JJ (1999) Potential phylogenetic utility of the low-copy nuclear gene pistillata in dicotyledonous plants: comparison to nrDNA ITS and trnL intron in Sphaerocardamum and other Brassicaceae. Molecular Phylogenetics and Evolution, 13, 20–30. Bakker EG, Stahl EA, Toomajain C et al. (2006) Distribution of genetic variation within and among local populations of Arabidopsis thaliana over its species range. Molecular Ecology, 15, 1405–1418. Bartish IV, Kadereit JW, Comes HP (2006) Late Quaternary history of Hippophaë rhamnoides L. (Elaeagnaceae) inferred from chalcone synthase intron (Chsi) sequences and chloroplast DNA variation. Molecular Ecology, 15, 4065–4083. Beck JB, Al-Shehbaz IA, O’Kane SL, Schaal BA (2007) Further insights into the phylogeny of Arabidopsis (Brassicaceae) from nuclear Atmyb2 flanking sequence. Molecular Phylogenetics and Evolution, 42, 122–130. Bell CJ, Ecker JR (1994) Assignment of 30 microsatellite loci to the linkage map of Arabidopsis. Genomics, 19, 137–144. Berge G, Nordal I, Hestmark G (1998) The effect of breeding systems and pollination vectors on the genetic variation of small plant populations within an agricultural landscape. Oikos, 81, 17–29. Caicedo AL, Stinchcombe JR, Olsen KM, Schmitt J, Purugganan M (2004) Epistatic interaction between Arabidopsis FRI and FLC flowering time genes generates a latitudinal cline in a life history trait. Proceedings of the National Academy of Sciences, USA, 101, 15670–15675. Clauss MJ, Cobban H, Mitchell-Olds T (2002) Cross-species microsatellite markers for elucidating population genetic structure in Arabidopsis and Arabis (Brassicaeae). Molecular Ecology, 11, 591–601. Clauss MJ, Koch MA (2006) Poorly known relatives of Arabidopsis thaliana. Trends in Plant Science, 11, 449–459. Clement M, Posada D, Crandall KA (2000) tcs: a computer program to estimate gene genealogies. Molecular Ecology, 9, 1657–1659. Comes HP, Kadereit JW (1998) The effect of Quaternary climatic changes on plant distribution and evolution. Trends in Plant Science, 3, 432–438. Cronn RC, Wendel JF (2003) Cryptic trysts, genomic mergers, and plant speciation. New Phytologist, 161, 133–142. Edwards KD, Lynn JR, Gyula P, Nagy F, Millar AJ (2005) Natural allelic variation in the temperature-compensation mechanism of the Arabidopsis thaliana circadian clock. Genetics, 170, 387– 400. Evanno G, Regnaut S, Goudet J (2005) Detecting the number of clusters of individuals using the software structure: a simulation study. Molecular Ecology, 14, 2611–2620. Excoffier L, Laval G, Schneider S (2005) arlequin (version 3.0): an integrated software package for population genetics data analysis. Evolutionary Bioinformatics Online, 1, 47–50. Falush D, Stephens M, Pritchard JK (2003) Inference of population structure using multilocus genotype data: linked loci and correlated allele frequencies. Genetics, 164, 1567–1587.
914 B . B E C K , H . S C H M U T H S and B . A . S C H A A L J
Goudet J (1995) fstat (version 1.2): a computer program to calculate F-statistics. Journal of Heredity, 86, 485–486. Harpending HC (1994) Signature of ancient population-growth in a low-resolution mitochondrial-DNA mismatch distribution. Human Biology, 66, 591–600. Hedge IC (1976) A systematic and geographical survey of the Old World Cruciferae. In: The Biology and Chemistry of the Cruciferae (eds Vaughan JG, MacLeod AJ, Jones BMG), pp. 1–45. Academic Press, London. Hillis DM, Moritz C, Mable BK (1996) Molecular Systematics. Sinauer Associates, Sunderland, Massachusetts. Hoffmann MH (2002) Biogeography of Arabidopsis thaliana (L.) Heynh. (Brassicaceae). Journal of Biogeography, 29, 125–134. Hoffmann MH (2005) Evolution of the realized climate niche in the genus Arabidopsis (Brassicaceae). Evolution, 59, 1425–1436. Hoffmann MH, Glas AS, Tomiuk J et al. (2003) Analysis of molecular data of Arabidopsis thaliana (L.) Heynh. (Brassicaceae) with Geographical Information Systems (GIS). Molecular Ecology, 12, 1007–1019. Hutchinson DW, Templeton AR (1999) Correlation of pairwise genetic and geographic distance measures: inferring the relative influences of gene flow and drift on the distribution of genetic variability. Evolution, 53, 1898–1914. Jackson RB, Linder CR, Lynch M et al. (2002) Linking molecular insight and ecological research. Trends in Ecology & Evolution, 17, 409–414. Jakobsson M, Säll T, Lind-Halldén C, Halldén C (2006a) The evolutionary history of the common chloroplast genome of Arabidopsis thaliana and A. suecica. Journal of Evolutionary Biology, 20, 104–121. Jakobsson M, Hagenblad J, Tavare S et al. (2006b) A unique recent origin of the allotetraploid species Arabidopsis suecica: evidence from nuclear DNA markers. Molecular Biology and Evolution, 23, 1217–1231. James JK, Abbott RJ (2005) Recent, allopatric, homoploid hybrid speciation: the origin of Senecio squalidus (Asteraceae) in the British Isles from a hybrid zone on Mount Etna, Sicily. Evolution, 59, 2533–2546. Kamiya T, Kawabe A, Miyashita NT (2002) Nucleotide polymorphism at the Atmyb2 locus of the wild plant Arabidopsis thaliana. Genetical Research, 80, 89–98. Kasapidis P, Suchentrunk F, Magoulas A, Kotoulas G (2005) The shaping of mitochondrial DNA phylogeographic patterns of the brown hare (Lepus europaeus) under the combined influence of Late Pleistocene climatic fluctuations and anthropogenic translocations. Molecular Phylogenetics and Evolution, 34, 55–66. Kaspar F, Kühl N, Cubasch U, Litt T (2005) A model-data comparison of European temperatures in the Eemian interglacial. Geophysical Research Letters, 32, 1–5. Kimura M, Weiss GH (1964) The stepping stone model of population structure and the decrease of genetic correlation with distance. Genetics, 49, 561–576. Koch MA, Kiefer C (2006) Molecules and migration: biogeographical studies in cruciferous plants. Plant Systematics and Evolution, 259, 121–142. Koch MA, Dobeš C, Matschinger M et al. (2005) Evolution of the trnF (GAA) gene in Arabidopsis relatives and the Brassicaceae family: monophyletic origin and subsequent diversification of a plastidic pseudogene. Molecular Biology and Evolution, 22, 1032– 1043.
Koch MA, Kiefer C, Ehrich D et al. (2006) Three times out of Asia Minor: the phylogeography of Arabis alpina L. (Brassicaceae). Molecular Ecology, 15, 825–839. Koch MA, Dobeš C, Kiefer C et al. (2007) Supernetwork identifies multiple events of plastid trnF (GAA) pseudogene evolution in the Brassicaceae. Molecular Biology and Evolution, 24, 63–73. Lind-Halldén C, Halldén C, Säll T (2002) Genetic variation in Arabidopsis suecica and its parental species A. arenosa and A. thaliana. Hereditas, 136, 45–50. Maloof JN, Borevitz JO, Dabi T et al. (2001) Natural variation in light sensitivity of Arabidopsis. Nature Genetics, 29, 441–446. Mamedov AV (1997) The late Pleistocene–Holocene history of the Caspian Sea. Quaternary International, 41–2, 161–166. Marmi J, López-Giráldez F, Macdonald DW et al. (2006) Mitochondrial DNA reveals a strong phylogeographic structure in the badger across Eurasia. Molecular Ecology, 15, 1007–1020. Mitchell-Olds T (2001) Arabidopsis thaliana and its wild relatives: a model system for ecology and evolution. Trends in Ecology & Evolution, 16, 693–700. Mitchell-Olds T, Schmitt J (2006) Genetic mechanisms and evolutionary significance of natural variation in Arabidopsis. Nature, 441, 947–952. Mohanty A, Martín JP, Aguinagalde I (2001) A population genetic analysis of chloroplast DNA in wild populations of Prunus avium L. in Europe. Heredity, 87, 421–427. Nordborg M, Hu TT, Ishino Y et al. (2005) The pattern of polymorphism in Arabidopsis thaliana. Plos Biology, 3, 1289–1299. O’Kane SL, Al-Shehbaz IA (2003) Phylogenetic position and generic limits of Arabidopsis (Brassicaceae) based on sequences of nuclear ribosomal DNA. Annals of the Missouri Botanical Garden, 90, 603–612. Ostrowski MF, David J, Santoni S et al. (2006) Evidence for a large-scale population structure among accessions of Arabidopsis thaliana: possible causes and consequences for the distribution of linkage disequilibrium. Molecular Ecology, 15, 1507–1517. Peakall R, Smouse PE (2006) genalex 6: genetic analysis in Excel. Population genetic software for teaching and research. Molecular Ecology Notes, 6, 288–295. Pritchard JK, Stephens M, Donnelly P (2000) Inference of population structure using multilocus genotype data. Genetics, 155, 943– 959. Rambaut A (1996) SE-AL: Sequence Alignment Editor, version 2.0a11. Available at: http://tree.bio.edsac.uk/software/seal/. Rogers AR, Harpending H (1992) Population growth makes waves in the distribution of pairwise genetic differences. Molecular Biology and Evolution, 9, 552–569. Säll T, Jakobsson M, Lind-Halldén C, Halldén C (2003) Chloroplast DNA indicates a single origin of the allotetraploid Arabidopsis suecica. Journal of Evolutionary Biology, 16, 1019–1029. Sanderson EW, Jaiteh M, Levy MA et al. (2002) The human footprint and the last of the wild. Bioscience, 52, 891–904. Schmid K, Törjék O, Meyer R et al. (2006) Evidence for a large-scale population structure of Arabidopsis thaliana from genome-wide single nucleotide polymorphism markers. Theoretical and Applied Genetics, 112, 1104–1114. Schmid KJ, Ramos-Onsins S, Ringys-Beckstein H, Weisshaar B, Mitchell-Olds T (2005) A multilocus sequence survey in Arabidopsis thaliana reveals a genome-wide departure from a neutral model of DNA sequence polymorphism. Genetics, 169, 1601–1615. Schmuths H, Hoffmann HM, Bachmann K (2004) Geographic
© 2007 The Authors Journal compilation © 2007 Blackwell Publishing Ltd
A R A B I D O P S I S T H A L I A N A G E N E T I C S T R U C T U R E 915 distribution and recombination of genomic fragments on the short arm of chromosome 2 of Arabidopsis thaliana. Plant Biology, 6, 128–139. Sharbel TF, Haubold B, Mitchell-Olds T (2000) Genetic isolation by distance in Arabidopsis thaliana: biogeography and postglacial colonization of Europe. Molecular Ecology, 9, 2109–2118. Skrede I, Eidesen PB, Portela RP, Brochmann C (2006) Refugia, differentiation and postglacial migration in arctic–alpine Eurasia, exemplified by the mountain avens (Dryas octopetala L.). Molecular Ecology, 15, 1827–1840. Smouse PE, Peakall R (1999) Spatial autocorrelation analysis of individual multiallele and multilocus genetic structure. Heredity, 82, 561–573. Swofford DL (2002) PAUP* Phylogenetic Analysis Using Parsimony (*and Other Methods), Version 4. Sinauer Associates, Sunderland, Massachusetts. Symonds VV, Lloyd AM (2003) An analysis of microsatellite loci in Arabidopsis thaliana: mutational dynamics and application. Genetics, 165, 1475–1488. Taberlet P, Gielly L, Pautou G, Bouvet J (1991) Universal primers for amplification of three non-coding regions of chloroplast DNA. Plant Molecular Biology, 17, 1105–1109. Tajima F (1989) Statistical-method for testing the neutral mutation hypothesis by DNA polymorphism. Genetics, 123, 585–595. Takhtajan A (1986) Floristic Regions of the World. University of California Press, Berkeley, California. Warren JM, Raybould AF, Ball T, Gray AJ, Hayward MD (1998) Genetic structure in the perennial grasses Lolium perenne and Agrostis curtisii. Heredity, 87, 556–562. Williams MAJ, Dunkerley DL, De Deckker P, Kershaw AP, Stokes T (1993) Quaternary Environments. Edward Arnold, London. Zink RM, Drovetski SV, Rohwer S (2006) Selective neutrality of mitochondrial ND2 sequences, phylogeography and species limits in Sitta europaea. Molecular Phylogenetics and Evolution, 40, 679–686.
© 2007 The Authors Journal compilation © 2007 Blackwell Publishing Ltd
James Beck is a postdoctoral researcher in Kathleen Pryer’s laboratory at Duke University. His interests focus on evolutionary patterns at low levels of divergence, particularly within species complexes. Heike Schmuths is group leader in the Saaten-Union Resistenzlabor GmbH in Gatersleben, Germany. Her research interests involve plant tissue culture and the natural variability of A. thaliana. Barbara Schaal is the Spencer T. Olin Professor of Arts and Sciences at Washington University. Her research is on the evolutionary genetics of plants. This work was carried out while J.B.B. was a graduate student with B.A.S. and Peter Raven at Washington University and the Missouri Botanical Garden.
Supplementary material The following supplementary material is available for this article: Table S1 Sample information. Stock centre numbers and abbreviations are noted (where applicable). All Beck vouchers are deposited at the Missouri Botanical Garden Herbarium (MO). Haplotypes at the three sequenced loci correspond to those in Figs 1–3. Values for the eight microsatellite loci are allele sizes in bp, a value of -9 indicates missing data due to failed amplification This material is available as part of the online article from: http://www.blackwell-synergy.com/doi/abs/ 10.1111/j.1365-294X.2007.03615.x (This link will take you to the article abstract). Please note: Blackwell Publishing are not responsible for the content or functionality of any supplementary materials supplied by the authors. Any queries (other than missing material) should be directed to the corresponding author for the article.