Impact of Energy-Efficient Techniques on a Device Lifetime Luca Chiaraviglio1,2 , Pawel Wiatr3 , Paolo Monti3 , Jiajia Chen3 , Lena Wosinska3 , Josip Lorincz4 , Filip Idzikowski1 , Marco Listanti1,2 1 DIET Department, University of Rome Sapienza, Rome, Italy, email {luca.chiaraviglio}@uniroma1.it 2 Consorzio Nazionale Interuniversitario per le Telecomunicazioni, Rome, Italy 3 Optical Networks Lab, KTH Royal Institute of Technology, Kista, Sweden 4 FESB-Split, University of Split, Split, Croatia
Abstract—This paper focuses on the impact that energyefficient techniques have on the component lifetime in optical backbone networks. The study presented in the paper considers in particular the influence that green routing strategies have on the failure rate of Erbium Doped Fiber Amplifiers (EDFAs), i.e., if their lifetime is positively or negatively impacted when putting them into sleep mode in order to reduce their energy consumption. To this end, the paper proposes a model that estimates the failure rate acceleration factor as a function of: (i) for how long and how frequently a device is switched into sleep mode, and (ii) hardware parameters that characterize the device. The proposed model is then evaluated by considering an energyefficient Routing and Wavelength Assignment (RWA) strategy that targets saving energy by putting EDFAs into sleep mode. The results presented in the paper show that energy-efficient techniques may have the potential to lower the failure rate of EDFAs. However, this is true only under specific conditions, i.e., an energy-efficient strategy needs to be carefully planned in order to avoid frequent power state transitions, which result in shortening the lifetime of an EDFA. Index Terms—Sustainability, energy-efficient routing, lifetime model, optical networks, Erbium Doped Fiber Amplifiers (EDFA), failure rate.
I. I NTRODUCTION Reducing the power consumption of the Information and Communication Technology (ICT) Sector has been a hot topic in the last few years, starting from the seminal work of Gupta and Singh [1]. Telecom operators have become particularly interested in energy-efficient techniques, since, apart from the reduction of their Green House Gas (GHG) emissions, they see green ICT as a possible way to reduce their electricity bill. Looking at backbone networks, the active network elements consume a non-negligible amount of energy [2]. This is due to the fact that they have to handle a huge amount of traffic. This requires high-capacity devices which are constantly powered on a 24-hour basis. Moreover, the traffic exchanged by users will continuously increase in the forthcoming years, due to the penetration of Internet connectivity as well as the multitude of smart devices coupled with bandwidth-intensive services. As a result, the power consumption of backbone networks is expected to continue growing [3], unless proper counter measures are taken into account. To this end, different energy-efficient approaches have been
proposed in the literature, targeting both design and dynamic operations of backbone networks (see [4], [5] for detailed surveys). Focusing on optical backbone networks, the majority of the energy-efficient algorithms are based on putting optical devices (e.g., transponders, regenerators, Reconfigurable Optical Add/Drop Multiplexer (ROADMs), and Erbium Doped Fiber Amplifiers (EDFAs)) into an energy-efficient mode (e.g., sleep mode) to reduce their power consumption. However, a possible drawback of this approach is that frequent on/sleep switching may negatively impact the failure rate performance of a device, and consequently increase its reparation costs [6], [7], [8]. This aspect cannot be neglected when considering the overall benefits of a green strategy. In particular, it is important to make sure that the potential savings brought by a reduced power consumption level are not lower than possible extra reparation costs caused by a reduced lifetime. The work in [8] pointed out this aspect and assessed different types of active components with the maximum allowable failure rate increase due to setting them into sleep mode on a regular basis to save energy. The study showed that one particular device, namely the EDFA, is the most susceptible to possible lifetime degradation from the operational costs point of view. Leveraging these previous works, the aim of this paper is to provide answers to the following questions: (i) what are the main sleep mode and hardware (HW) parameters that influence the failure rate performance of EDFAs in optical backbone networks?, and (ii) under which conditions may the lifetime of an EDFA increase as a result of being set into sleep mode? To the best of our knowledge, this is the first work in the literature, which tackles these questions. The paper starts to investigate the problem by considering the main causes that impact the EDFA lifetime. Then, a failure rate acceleration factor model is presented in order to understand the role of both sleep mode and HW parameters in the potential changes of the failure rate of an EDFA. The model is then evaluated by considering energy-efficient schemes that are based on putting the EDFA into sleep mode. In particular, the paper considers an energy-efficient RWA algorithm, where the main idea is to route the traffic over already used fiber links. In this way it is possible to maximize the number of EDFAs that can be set into sleep mode and therefore save energy.
The reminder of the paper is organized as follows. Sec. II is an overview of the main physical phenomena impacting the lifetime of the EDFAs. Sec. III presents the proposed failure rate model and average failure rate acceleration factor. Simulation results are reported in Sec. IV, and Sec. V concludes the work. II. I MPACT OF S LEEP M ODE O PERATIONS ON A D EVICE L IFETIME This section provides a general overview of the physical phenomena that may impact the lifetime of a network device put into sleep mode in order to save energy. The notation that will be used in the rest of the paper is summarized in Table I. Transitions between on and sleep states affect the conditions in which a device operates, in particular its temperature [9]. There are several models that describe how temperature impacts the lifetime of a device. One of them is the Arrhenius law [10], which defines in terms of an acceleration factor how much the lifetime of a device could increase/decrease if operated at a temperature different from a reference one. More formally, the acceleration factor derived from the Arrhenius law can be expressed as: Ea 1 1 γ T1 = e− K ( T1 − Tr ) (1) T r γ where Ea is the activation energy, K is the Boltzmann constant, and γ T1 and γ Tr are the failure rate at the operating T1 and reference Tr temperatures, respectively. If the effects of the Arrhenius law were the only phenomenon to consider, an energy-efficient scheme would have a positive impact on the lifetime of a device, as the operating temperature of a device in sleep mode is typically lower than in normal working conditions (i.e., when a device is powered on). However, there are also other physical phenomena that need to be considered, which may might negatively impact the lifetime of a device. For example, it is well known that temperature changes may affect differently the expansion of different materials within the same component due to different Coefficients of Temperature expansion (CTEs). In turn, the device may suffer strain and fatigue when temperature conditions change, in particular when this happens in a cyclic way. This phenomenon can be observed for many electronic devices, in particular in solder junctions. The Coffin-Manson model [11], [12] describes the effects of material fatigue caused by cyclic thermal stress and it is used to predict the number of temperature cycles that a component can endure before failing. More formally, the number of cycles to failure can be expressed by the following equation [13], [14]:
AF T1 =
N f = C0 (∆T − ∆T0 )−q
(2)
where ∆T is the temperature variation, ∆T0 is the maximum temperature variation that can be afforded without an impact on the failure rate, C0 is a material dependent constant, and q is the Coffin-Manson exponent. Then using Eq. (2), the failure rate due to thermal cycling can be defined as: γ ∆T =
fTC Nf
(3)
where f T C is the frequency of thermal cycling and γ ∆T is the estimated failure rate. The value of f T C can be obtained via experimental measures. In this case, both the frequency of temperature changes and the temperature variation play an important role. It is because the more often a device experiences a temperature gradient (i.e., as a result of being put into sleep mode), the shorter its lifetime might be. There are other models available in the literature (e.g., Engelmeier [15], Norris-Lanzberg [16]) that introduce additional factors (e.g., solder dimensions, chemical characteristics, dwell time) into a lifetime prediction model. On the other hand, they all share their dependence on the temperature variation and frequency of the temperature cycles. One could argue that on/sleep switching (i.e., power cycling) based schemes produce a localized and internally induced heating in the device (Joule heating) so that the resulting temperature variation may not be uniformly distributed over the whole device as it happens with thermal cycling, where the device heating is externally induced. On the other hand, the work in [17] and [18] confirms that the fast local temperature changes caused by power cycling (that can be up to 100 times faster [19] than the thermal cycling) also negatively impact the lifetime of a device. From the consideration above it can be concluded that temperature and the temperature variations are relevant phenomena that might impact the lifetime of a device. When looking at optical backbone networks, the set of elements that may be the target of an energy-efficient scheme include: transponders, regenerators, ROADMs, and EDFAs. Among these various elements, the EDFA is the one where the impact of the temperature conditions and temperature variations is the most critical [8]. For this reason the next section focuses on modeling the lifetime of optical amplifiers in terms of an acceleration rate factor. III. EDFA FAILURE R ATE M ODEL AND AVERAGE FAILURE R ATE ACCELERATION FACTOR This section focuses on modeling the lifetime variations of an EDFA as a function of its temperature and temperature variations. Let us denote as Dijk the lifetime of the EDFA i placed on the fiber link from node j to node k. Dijk is defined as the inverse of the EDFA failure rate γijk : Dijk =
1 γijk
[h].
(4)
When an EDFA is in a low-power state (or sleep state), its temperature is reduced compared to the full-power state. According to the Arrhenius law, Eq. (1), this induces a decrease in the failure rate compared to the full power state. on−sleep The failure rate γijk of EDFA i implementing sleep mode capabilites and placed on the fiber link between node j and node k is: h i on−sleep sleep on sleep sleep γijk = (1 − τijk )γijk + τijk γijk [1/h], (5)
sleep where, γijk is the failure rate when EDFA i is in sleep mode, sleep on γijk is the failure rate at full power, and τijk ∈ [0, 1] is the normalized time in which EDFA i is in sleep mode (if equal to 1 the EDFA i is always in sleep mode). Thus, the overall failure rate is the averaged sum of the failure rates at full power and in sleep mode. The first consideration is that the longer the EDFA is in sleep mode, the higher the reduction in the failure rate. However, as reported in Eqs. (2) and (3), also the interval in which the temperature varies (i.e., ∆T ) and the frequency of thermal cycling (i.e., f T C in [cycle/h]) tr impacts the failure rate. Let us define γijk as the failure rate of the device when a temperature variation occurs. Following tr Eq. (3), γijk can be defined as: tr γijk =
tr fijk f Nijk
[1/h],
(6)
f tr where fijk is the on/sleep frequency and Nijk is the number of cycles to failure. From Eq. (6) it can be seen that as the tr power switching frequency is reduced, the failure rate γijk is f also reduced. Moreover, Nijk is a technological parameter that depends on the specific HW used to assembly the EDFA. In order to put together both the effects of Eq. (6) and on−sleep tr Eq. (5), we assume that γijk and γijk are statistically independent [20] and their effects are additive [14]. In this way, the overall failure rate γijk is the sum of the individual failure rates: on−sleep tr γijk = γijk + γijk [1/h].
(7)
Since we are interested in evaluating in which way the sleep mode may impact the lifetime of an EDFA, we define a failure rate acceleration factor, i.e., AFijk , similar in concept to the one defined by the Arrhenius law, i.e., Eq. (1). The acceleration factor is a metric that measures the increase of the failure rate with respect to a reference temperature. In order to model the value of AFijk , we first define the failure rate acceleration factor of an EDFA in sleep mode as: sleep AFijk =
sleep γijk on γijk
,
(8)
which is always lower than one. This term can be computed from using the Arrhenius law given the difference in the operating temperature of the device and its activation energy. Moreover, we introduce the parameter χijk : χijk =
1 on N f γijk ijk
[h/cycle],
(9)
which is defined as the inverse of the failure rate at full power multiplied by the number of cycles to failure. Both terms are fixed and can be measured on the device when sleep modes are not applied. Finally, the overall failure rate acceleration factor of an EDFA can be defined as: γijk sleep sleep tr AFijk = on = 1 − (1 − AFijk )τijk + χijk fijk . (10) γijk
TABLE I S UMMARY OF NOTATION Symbol T1 Tr ∆T ∆ T0 Ea K C0 q fTC Dijk Nf f Nijk AF T1 sleep AFijk AFijk AF γ T1 γ Tr γ ∆T γijk on−sleep γijk on γijk
Description operating temperature reference temperature temperature variation maximum temperature variation that can be afforded without an impact on the failure rate activation energy the Boltzmann constant material dependent constant the Coffin-Manson exponent frequency of thermal cycling lifetime of EDFA ijk number of cycles to failure number of cycles to failure of EDFA ijk failure rate acceleration factor at temperature T1 failure rate acceleration factor of EDFA ijk in sleep mode overall failure rate acceleration factor of EDFA ijk average EDFA failure rate acceleration factor failure rate at operating temperature T1 failure rate at reference temperature Tr estimated failure rate due to thermal cycling with a temperature variation of ∆T failure rate of EDFA ijk failure rate of EDFA ijk implementing sleep mode capabilities failure rate when EDFA ijk is at full power
sleep γijk
failure rate when EDFA ijk is in sleep mode
sleep τijk
normalized time in which EDFA ijk is in sleep mode, sleep τijk ∈ [0, 1] failure rate of EDFA ijk when a temperature variation ∆T occurs on/sleep frequency of EDFA ijk HW parameter of EDFA ijk depending on the thermal cycling effect total number of EDFAs deployed in the network
tr γijk tr fijk χijk
I
The subscript ijk specifies EDFA i placed on the fiber link from node j to node k.
The acceleration factor AFijk comprises two terms: the first sleep sleep one is (1 − AFijk )τijk which tends to decrease the tr AFijk value, and the second one χijk fijk which has the opposite effect. Moreover, AFijk is influenced by two types of sleep parameters: technological (i.e., AFijk and χijk ) which are strictly related to the HW used to build the EDFA, and sleepsleep tr mode-related (i.e., τijk and fijk ) which instead depend on the energy-efficient algorithm used. When, in a given network, a number of EDFAs are put into sleep mode in order to save energy (with on/sleep switching frequencies and sleep periods that might not be necessarily the same for each one of them), it is important to model their overall performance in terms of failure rate acceleration factor. We define the following metric for this purpose: P ijk AFijk AF = . (11) I The AF in Eq. (11) defines the average EDFA failure rate acceleration factor, where I is the total number of EDFAs deployed in the network. If AF > 1, it can be expected that, on average, the EDFAs in the network will fail more frequently
This section presents a case study where a green strategy putting EDFAs into sleep mode is applied to a specific optical backbone network under a dynamic lightpath provisioning scenario. We first explain how the green algorithm works, and then present an analysis of the various parameters impacting the average EDFA failure rate acceleration factor value. A. Green Strategy and Simulation Scenario This simulation study is based on a green RWA strategy called Weighted Power Aware Lightpath Routing (WPALR) [21] tested on the COST239 optical backbone network. The provisioning scenario considers dynamic traffic where each connection request is assumed to require a full wavelength capacity. The WPA-LR algorithm works in the following way. A separate network connectivity graph is considered for each wavelength, i.e., a wavelength plane approach is utilized. If a given wavelength is already used on a fiber link to provision a lightpath, the fiber link will not appear on that specific wavelength plane. For an incoming connection request the path at minimum cost (if any) is computed on each wavelength plane. The path that has the overall minimum cost (among the ones found on each wavelength plane) is then chosen as the route for the connection request. If no path can be found on any wavelength plane, the connection is rejected. Under the assumption that the only devices that are put into sleep mode (in order to save energy) are the EDFAs (i.e., the other network components such as transceivers, ROADMs, or higher layer electronics are considered to be always on), the cost function used in the WPA-LR algorithm works as follows. If a fiber link is not in use, its cost is equal to the power necessary to operate all the EDFAs deployed along its length (i.e., the fiber link power consumption cost). If a fiber link is in use, its routing cost becomes the product of its power consumption cost and a parameter α that varies in the range (0;1]. Values of α close to 0, encourages WPA-LR to select routes at minimum power cost, while with 0 < α < 1 WPALR tends to make routing choices that are a compromise between power consumption minimization and (fiber) resource efficiency maximization. When α = 1, the WPA-LR behaves in the same way as a conventional shortest path (SP) approach, where still some energy savings can be achieved because the EDFAs that are not used can be set into sleep mode. More details about the WPA-LR strategy are available in [21]. In the simulation work on the COST239 network topology it is assumed that each fiber link comprises two unidirectional
Average Normalized Time in Active State [%]
IV. C ASE S TUDY
100
Average On/Sleep Frequency [cycles/day]
than in normal operating conditions (i.e., when a green strategy is not used). If AF = 1, the average failure rate of EDFAs will not change, and if AF < 1 it can be expected that, on average, the EDFAs in the network will fail less frequently. It should be noticed that AF is not the only metric that can be used. The choice is up to the network operator that might focus also on a different metric, e.g., on the EDFA with the worst failure rate acceleration performance.
1.4
90 80 70 60 50
α=1 (SP) α = 0.75 α = 0.5 α = 0.25 α≈0
40 30 20 10 0
100
200 300 Load [Erlang]
400
500
α=1 (SP) α = 0.75 α = 0.5 α = 0.25 α≈0
1.2 1 0.8 0.6 0.4 0.2 0 0
100
200 300 Load [Erlang]
400
500
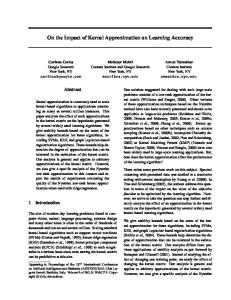
Fig. 1. Average normalized time in percentage an EDFA is in active state (top) and average EDFA on/sleep frequency (bottom) as a function of the network load.
fibers each one carrying 16 wavelengths. It is assumed that wavelength conversion is not available. Connection requests are bidirectional and their source and destination pairs are uniformly chosen among the network nodes. They arrive according to a Poisson process while the service time for each connection request is exponentially distributed with an average holding time equal to 6 hours. EDFAs are placed every 80 km and the power consumed by an EDFA in sleep mode is assumed to be 20% of the power when fully operational. In the case study the traffic load is varied from 10 to 420 Erlang. These values are chosen in order to investigate different conditions where the network blocking probability does not exceed 10%. In order to measure the value of AF , it is assumed that all the EDFAs deployed in the network have the same HW characteristics, while the value of the frequency and the duration of each sleep cycles are collected by simulating the WPA-LR algorithm for different values of α. Simulation results are averaged over a series of 10 experiments with 105 connection requests in each experiment. B. Impact of Traffic Load on the Sleep Mode Duration and the On/Sleep Frequency Fig. 1 reports the average normalized time in active state (top) and the on/sleep frequency (bottom) for the EDFAs in the network as a function of the load. Results are presented for different values of the parameter α. Several considerations hold in this case. First, the average normalized time in active state
1
0.8
1.4
0.7
1.2 AF
0.5
1.1
0.4
1
0.3
AFsleep
1.3
0.6 AFsleep
α=1 (SP) α = 0.75 α = 0.5 α = 0.25 α≈0
1.5
0.8
0.6
0.4
0.9
0.2
0.8
0.1 0 0
1
1.6
0.9
0.2
0.7 1
2
3
4
5
χ [h/cycle]
Fig. 2. Average EDFA failure rate acceleration factor (AF ) as a function of AF sleep and χ, with α = 0.5 and a load of 150 Erlang.
tends to increase with increasing load values (as expected), since more EDFAs need to be powered on in order to meet the traffic requirements. Moreover, for load higher than 350 Erlang the average normalized time in active state is nearly equal to 100%, meaning that all the EDFAs in the network are always powered on. Second, the average on/sleep frequency tends to decrease with increasing load. However, the maximum value of the on/sleep frequency does not always occur at the minimum value of load. This is due to the fact that some of the EDFAs are always in sleep mode when traffic is very low. Third, the parameter α has a strong impact on the results. In particular, when the algorithm tends to exploit short paths (α = 1) the average normalized time in active state is higher compared to a pure power minimization approach, i.e., α = 0, and the average on/sleep frequency is almost one order of magnitude higher since EDFAs frequently change their power state. C. Average EDFA Failure Rate Acceleration Factor Fig. 2 reports a number of level curves representing the average EDFA failure rate acceleration factor (AF ) as a P sleep sleep function of the value of AF defined as ( AF ijk ijk )/I, P and χ defined as ( ijk χijk )/I. The results are obtained with α = 0.5 at load equal to 150 Erlang. The red dashed line highlights the level curve AF = 1. The region on the left of this crossover line represents the zone where on average EDFAs in the network fail less often when compared to the case in which the WPA-LR algorithm is not used, i.e., AF < 1. On the contrary, the region on the right is the zone in which AF > 1, i.e., EDFAs on average are expected to fail more often when compared to the case in which the WPALR algorithm is not used. From the figure, it can be noticed that both AF sleep and χ play a crucial role in determining the effectiveness of an energy-efficient strategy in terms of average EDFA failure rate increase/decrease. In particular, AF sleep is influenced by the decrease of temperature on the device, which is expected to happen when EDFAs are in sleep mode. On the other hand χ becomes the discriminating factor, meaning that devices whose χ is very high (in this case higher than 2.7 h/cycle) will experience on average an increase of their failure rate.
0 0
2
4 χ [h/cycle]
6
8
Fig. 3. Level curves for AF = 1 for different values of α with a load of 150 Erlang.
Fig. 3, on the other hand, considers the impact of the parameter α on the position of the value for AF = 1. The traffic load is equal to 150 Erlang, which corresponds to medium traffic conditions. It is interesting to notice that as the algorithm tends to target the power minimization (low values of α), the region in which AF < 1 is increased. This is mainly due to the fact that, as shown in Fig. 1, with decreasing values of α EDFAs on average spend more time in sleep mode and the average value of their on/sleep transitions is also lower. D. Impact of the HW parameters P Fig. 4 reports the different values of χ (i.e., ( ijk χijk )/I), that are required to have AF = 1. The value of χ is presented as a function of load and for different values of P the traffic sleep AF sleep (i.e., ( ijk AFijk )/I). The algorithm parameter α is set to 0.5. Note that the areas below each curve represent values of χ for which AF < 1. For low values of load χ is very small, i.e., χ < 1 [h/cycle]. This is due to the fact that the average frequency of on/sleep transitions is relatively high as shown in Fig. 1. This means that even if a device is equipped with better hardware capabilities to limit the thermal cycling effect, high average on/sleep frequency may still negatively impact the value of AF . However, for intermediate values of load (between 20 and 125 Erlang), the frequency of cycles promptly decreases, allowing higher values for χ, i.e., up to a max of 5.5 [h/cycle], while still ensuring favorable conditions in terms of EDFAs average failure rate acceleration factor, i.e., AF < 1. For high traffic values, the average normalized time EDFAs spend in active state is almost 100%, setting the value of AF to be greater than 1 even for very small values of χ. Finally, it can be observed that the trend does not change with different values of AF sleep (even though the absolute values are different). Fig. 5 presents values of AF for different values of the traffic load and χ when α = 0.5 and AF sleep = 0.5. The figure reports also a lower bound, which corresponds to the case of χ = 0, i.e., no thermal cycling effect. Two considerations hold in this case. First, for increasing values of the traffic load, AF converges to one, which corresponds to the situation in which all devices are always powered on,
ACKNOWLEDGEMENTS
7 AFsleep=0.8 AFsleep=0.5 AFsleep=0.2
6
χ [h/cycle]
5
R EFERENCES 4 3 2 1 0
50
100
150 200 250 Load [Erlang]
300
350
400
Fig. 4. Values of χ required to have AF = 1 as a function of the traffic load and AF sleep with α = 0.5. 1.5 Lower Bound χ=0.1 χ=0.5 χ=0.9 χ=1.5 AF
The research leading to these results has received funding from the FP7 grant agreement no. 318137 (ICT-DISCUS).
1
0.5
50
100
150 200 250 Load [Erlang]
300
350
400
Fig. 5. AF as function of the traffic load and χ with AF sleep = 0.5 and α = 0.5.
and therefore the average EDFA failure rate acceleration factor AF remains unchanged. Second, it can be seen that when χ is increasing, the region in which the AF < 1 is reduced. However, the effect is mitigated for intermediate values of load, meaning that there is a tradeoff between power efficiency and the value of the average failure rate acceleration factor. V. C ONCLUSIONS AND F UTURE W ORK The paper considered the impact that energy-efficient techniques have on the component lifetime in an optical backbone network. More specifically the focus was on understanding the effects of putting EDFAs into sleep mode. We have developed a simple model, showing that the EDFA failure rate variations are influenced by the traffic, the energy-aware algorithm parameters, the time spent in sleep mode, the frequency of on/sleep cycles, and the characteristics of the EDFA HW. The paper showed that frequent on/sleep transitions may have a negative impact on the EDFA failure rate. However, this work is a first step towards a more comprehensive approach, since there might be conditions under which the failure rate of a component may benefit from long (and not frequent) sleep periods. As next steps, it will be worth to investigate energyefficient algorithms targeting explicitly the increase of lifetime for optical networks.
[1] M. Gupta and S. Singh, “Greening of the Internet,” in Proc. of the SIGCOMM, Karlsruhe, Germany, 2003. [2] W. Van Heddeghem, F. Idzikowski, W. Vereecken, D. Colle, M. Pickavet, and P. Demeester, “Power consumption modeling in optical multilayer networks,” Photonic Network Communications, vol. 24, pp. 86–102, October 2012. [3] F. Idzikowski, L. Chiaraviglio, R. Duque, F. Jimenez, and E. Le Rouzic, “Green horizon: Looking at backbone networks in 2020 from the perspective of network operators,” in Proc. of the ICC, Budapest, Hungary, June 2013. [4] R. Bolla, R. Bruschi, F. Davoli, and F. Cucchietti, “Energy efficiency in the future internet: a survey of existing approaches and trends in energyaware fixed network infrastructures,” IEEE Communications Surveys & Tutorials, vol. 13, no. 2, pp. 223–244, 2011. [5] M. N. Dharmaweera, R. Parthiban, and Y. A. S¸ekercio˘glu, “Towards a power-efficient backbone network: The state of research,” IEEE Communications Surveys & Tutorials, 2014. accepted for publication. [6] L. Chiaraviglio, A. Cianfrani, A. Coiro, M. Listanti, J. Lorincz, and M. Polverini, “Increasing device lifetime in backbone networks with sleep modes,” in Proc. of the SoftCOM, Primosten, Croatia, September 2013. [7] L. Chiaraviglio and M. Listanti, “On the interplay between sleep modes and device lifetime in telecommunication networks,” in Proc. of the EINS Workshop on Understanding the Interplay Between Sustainability, Resilience, and Robustness in Networks (USRR), Ghent, Belgium, April 2014. [8] P. Wiatr, J. Chen, P. Monti, and L. Wosinska, “Energy efficiency and reliability tradeoff in optical core networks,” in Proc. of the OFC, San Francisco, USA, March 2014. [9] F. Bayle and A. Mettas, “Temperature acceleration models in reliability predictions: Justification & improvements,” in Proc. of the RAMS, San Jose, USA, January 2010. ¨ [10] S. Arrhenius, Uber die Reaktionsgeschwindigkeit bei der Inversion von Rohrzucker durch S¨auren. Wilhelm Engelmann, 1889. [11] L. F. Coffin Jr. and U.S. Atomic Energy Commission and General Electric Company, A Study of the Effects of Cyclic Thermal Stresses on a Ductile Metal. Knolls Atomic Power Laboratory, 1953. [12] S. S. Manson, “Behavior of materials under conditions of thermal stress,” NACA Report 1170, 1954. [13] JEDEC Solid State Technology Association et al., “Failure mechanisms and models for semiconductor devices,” JEDEC Publication JEP122-C, March 2006. [14] A. K. Coskun, R. Strong, D. M. Tullsen, and T. Simunic Rosing, “Evaluating the impact of job scheduling and power management on processor lifetime for chip multiprocessors,” in Proc. of the SIGMETRICS/Performance, Seattle, USA, June 2009. [15] W. Engelmeier, Solder Joints in Electronics: Design for Reliability. [16] K. Norris and A. Lanzberg, “Reliability of controlled collapse interconnections,” IBM Journal of Research and Development, vol. 13, pp. 266– 271, May 1969. [17] D. E. H. Popp, A. Mawer, and G. Presas, “Flip chip PBGA solder joint reliability: power cycling versus thermal cycling,” Motorola Semiconductor Products Sector, Austin, TX, 2005. [18] A. E. Perkins, Investigation and prediction of solder joint reliability for ceramic area array packages under thermal cycling, power cycling, and vibration environments. PhD thesis, Georgia Institute of Technology, May 2007. [19] T. Anzawa, Q. Yu, M. Yamagiwa, T. Shibutani, and M. Shiratori, “Power cycle fatigue reliability evaluation for power device using coupled electrical-thermal-mechanical analysis,” in Proc. of the ITHERM, Orlando, USA, May 2008. [20] R. Blish and N. Durrant, “Semiconductor device reliability failure models,” International Sematech Technology Transfer #00053955A-XFR, May 2000. [21] P. Wiatr, P. Monti, and L. Wosinska, “Power savings versus network performance in dynamically provisioned WDM networks,” IEEE Communications Magazine, vol. 50, pp. 48–55, May 2012.