Higher albedos and size distribution of large transneptunian objects P. S. Lykawka,1 and T. Mukai1 1 Kobe University, 1-1 rokkodai-cho, nada-ku, Kobe 657-8501, Japan
******* This paper was published in Planetary and Space Science 53, 1319-1330 (2005).
[email protected] http://sites.google.com/site/patryksofialykawka/ *******
1
Abstract: Transneptunian objects (TNOs) orbit beyond Neptune and do offer important clues about the formation of our solar system. Although observations have been increasing the number of discovered TNOs and improving their orbital elements, very little is known about elementary physical properties such as sizes, albedos and compositions. Due to TNOs large distances (>40AU) and observational limitations, reliable physical information can be obtained only from brighter objects (supposedly larger bodies). According to size and albedo measurements available, it is evident the traditionally assumed albedo p=0.04 cannot hold for all TNOs, especially those with approximately absolute magnitudes H≤5.5. That is, the largest TNOs possess higher albedos (generally >0.04) that strongly appear to increase as a function of size. Using a compilation of published data, we derived empirical relations which can provide estimations of diameters and albedos as a function of absolute magnitude. Calculations result in more accurate size/albedo estimations for TNOs with H≤5.5 than just assuming p=0.04. Nevertheless, considering low statistics, the value p=0.04 sounds still convenient for H>5.5 non-binary TNOs as a group. We also discuss about physical processes (e.g., collisions, intrinsic activity and the presence of tenuous atmospheres) responsible for the increase of albedo among large bodies. Currently all big TNOs (>700km) would be capable to sustain thin atmospheres or icy frosts composed of CH4, CO or N2 even for body bulk densities as low as 0.5gcm-3. A size-dependent albedo has important consequences for the TNOs size distribution, cumulative luminosity function and total mass estimations. According to our analysis, the latter can be reduced up to 50% if higher albedos are common among large bodies. Lastly, by analyzing orbital properties of classical TNOs (42AU
99.63% confidence level. Furthermore, more massive classical bodies are anomalously present at a<43.5AU, a result statistically significant and apparently not caused by observational biases. This feature would provide a new constraint for transneptunian belt formation models. Keywords: Solar System, Kuiper belt, transneptunian belt, albedos, size distribution
2
1. Introduction For the last thirteen years our knowledge about the transneptunian belt has been increasing dramatically. From the first discovery of a transneptunian object (TNO) in 1992 (Jewitt and Luu, 1992), as of April 2005 about 1000 TNOs have already been reported with orbital elements currently available at the Minor Planet Center (MPC, 2005). Far to resemble an accretion disk leftover, the TNOs orbital characteristics point to a complex structure (Figure 1). These outer solar system objects can be tentatively classified as: a) classical TNOs: spread in a narrow region between semimajor axes 42AU4.5º) (Peixinho et al., 2004); b) resonant TNOs: associated with mean motion resonances with Neptune. In particular, those trapped in the 4:3 (a~36.4AU), 3:2 (a~39.4AU), 5:3 (a~42.3AU), 7:4 (a~43.7AU) and 2:1 (a~47.8AU) mean motion resonances; c) scattered TNOs: with no strict neither official definition, we set those TNOs with a>50AU and perihelion distances q>30AU as scattered TNOs. Scattered TNOs are believed to have been scattered during the early solar system, hence the name (Duncan and Levison, 1997); d) extended scattered TNOs: those scattered TNOs with perihelion distances large enough (q>40AU) to be considered a distinct class (for details, see Morbidelli et al., 2004 and references therein). Another important class of outer solar system bodies are the centaurs, which are believed to be in transitional orbits filling the dynamical link between TNOs and Jupiter-family comets (Tiscareno and Malhotra, 2003). In this work we classify them as objects with q<30AU and not in any external mean motion resonance with Neptune. Orbital elements of TNOs and their subpopulations offer valuable clues and constraints, but at the same time limited information on the origin of the solar system. To get insight into a more complete view of the formation and evolution of our solar system, we must rely on crucial physical properties such as sizes, albedos, compositions, rotational states, colors and so on. With current telescopical technology, these properties can be obtained only from the brightest objects due to mainly two reasons: the large transneptunian distances involved (average ~43AU) and low albedos. For instance, contrary to the number of detected transneptunian bodies so far, TNOs with measured diameters and albedos are very few. Likewise, the distribution of albedos among TNOs is unknown. Apart from allowing straight derivation of sizes, knowledge of albedos can provide fruitful constraints on the study of compositions, colors, lightcurves and other fields. A list of TNOs and centaurs with sizes/albedos derived from optical and thermal observations is presented in Table 1, according to several published data. As one can note, among the diversity of albedos, there appears to be a systematic increase of albedos on larger objects.
2. Diameters and albedos of outer solar system objects Measurements of size/albedo are available for both centaurs and TNOs, although the sample for the former is rather small. Besides, the albedos of centaurs are presumably distorted because of contamination by cometary activity1. Compared to TNOs, centaurs have also planet crossing orbits leading to enhanced processing due to proximity to the Sun and the giant planets. It is true that cometary activity could also be triggered at transneptunian belt distances though, depending on the volatiles composition, internal structure and other factors (Hainaut et al., 2000 and references therein). But the extent at which cometary activity would affect the albedo of TNOs and the fraction of objects currently undergoing this phenomenon is unknown. Only a few albedo measurements of TNOs are available (Table 1). These include four transneptunian binaries (in addition to the Pluto-Charon pair) with albedos constrained from the determination of the components orbital 1
For instance, the high albedo of Chiron is clearly explained by cometary activity (Hartmann et al., 1990). 3
elements, total mass and assumed densities (for example, see Noll et al., 2004a). With the lack of a distribution of albedos, the standard albedo p=0.04 has been widely assumed for TNOs following the measurements of cometary nuclei (especially 1P/Halley) and dark centaurs (see e.g. Jewitt et al., 2001; Schulz, 2002). Very low albedos are also expected from space weathering studies (Gil-Hutton, 2002 and references therein). Nevertheless, as we will show later, it is quite possible that intrinsic activity is contributing for a systematic increase of albedos well beyond 0.04 (Section 3.2). Henceforth we will use diameter/albedo values based on the criterion of most recent observations (first line of each object in Table 1). Taking the weighted averaged value of p for TNOs with measurements (Pluto and Charon not included), we obtain a crude approximation of 0.05±0.02, slightly larger than 0.04. If we take only the three TNOs with diameter D>700km, the weighted average becomes 0.085±0.045. This albedo increasing tendency can be explained by the fact that large bodies can sustain icy patchy frosts on their surfaces, such as the plutonian moon Charon and large TNOs like Varuna (Jewitt and Luu, 1998; Jewitt, 1999; Jewitt et al., 2001). Formation of fresh ice deposits would be feasible only in big bodies with enough gravity to retain volatiles near their surfaces or to force icy collisional ejecta to fall back on the object. Besides, intrinsic activity and temporary dusty/gaseous atmospheres can also raise the albedo. It should be noted too that bodies with critical size about D>100km could have suffered differentiation by the concomitant action of solar irradiation and internal radiogenic heating (De Sanctis et al., 2001; Choi et al., 2002) with important consequences for the volatile distribution, albedos and relationship with centaurs and short period comets. Diameter and albedo are normally calculated using the formula derived by Russell (1916): 2
D (1) p Φ (α ) = 2.25 ⋅ 1016 r 2 ∆210 0.4(m∗ −m ) , 2 where p is the geometric albedo, D is the object diameter (km), Φ(α ) is the phase function, r is the heliocentric distance (AU), ∆ is the geocentric distance (AU) and m is the apparent magnitude of the object. Taking the origin in the object, the phase angle α is formed by the vectors pointing to the Earth and the Sun. Φ(0) = 1 and ∆ = r − 1 are assumed when the body is at opposition. The apparent magnitude of the Sun m* is -27.1, -26.74 and -26.07 in red, visible and blue wavelengths respectively. The apparent magnitude m is related to the absolute magnitude H, distances and the phase angle as (2) m = H + 5 log(r∆ ) + β α ,
where β is a parameter of the phase function. For sake of simplicity, we will assume that the last term is negligible for the purposes of this study.
3. What clues can large TNOs and their dynamical populations reveal? Important information can be extracted from the size distribution of TNOs. For example, distribution of mass, accretion conditions and collisional evolution in the transneptunian region. Normally the size distribution is derived from the cumulative luminosity function (CLF) under the assumptions of constant heliocentric distance and constant albedo (0.04) (Elliot et al., 2005). The first assumption is reasonable, but the second is more problematic, because the TNOs distribution of albedos is unknown. In terms of collisional evolution, only TNOs with diameters larger than about 100km would have survived since formation over the age of the solar system (Stern, 1995). For the entire transneptunian region, although the largest size (which can tell about the growth end) has not been constrained yet, it must be larger than 1000km (Trujillo et al., 2001a). Concerning statistical predictions of the number of large classical TNOs, Trujillo et al. (2001b) have estimated that there would exist 1-6 TNOs with ~2000km sizes (Pluto-like) and 18-46 bodies with ~1000km sizes among the classical TNOs. Our knowledge about the size distribution is still observationally limited to TNOs with sizes 4
larger than about 100km. Among them, many large scale TNOs (600-1800km) have been observed (Figure 1). Potential importance of large TNOs can be resumed as: • According to accretion models, TNOs with D>100km must be primordial reflecting the end of accretion phase. Therefore, knowing the distribution of big TNOs can help to find the largest diameter produced during the accretion, since it is expected a cut off at large size (after runaway growth). Besides, large TNOs can also yield fruitful information about the original distribution of mass in the early solar nebula (Kenyon and Luu, 1998; Kenyon and Luu, 1999a, 1999b); • With current observational technology, as big TNOs are brighter, it is possible to collect more easily spectra in order to probe compositions and structure; • Knowledge about color and albedo distributions of large TNOs can help to constrain collisional models and to understand surface dynamics (e.g., processes responsible for the dispersion in colors); • Having a significant sample of big TNOs, dynamical models can be constrained (e.g., hot classical TNOs origin), correlations with orbital elements can be proved or disproved, and the dependence on mass can be better understood considering different populations. 3.1. Large TNOs with measurements and implications for the size and albedo distributions Objects used in this section are those with diameter measurements as shown in Table 1 and with absolute magnitudes taken from the MPC database. Although this database is primarily astrometric (rather than photometric), all the objects possess more than three opposition observations, so we assume that the values of absolute magnitude have small errors (<0.1mag). In Figure 2, we show the sizes and absolute magnitudes of these objects together with curves representing constant values of albedo: 0.02, 0.04, 0.08, 0.12, 0.25 and 0.50. It is clear that for any large TNO with H≤4.5, assuming albedo 0.04 to calculate the diameter would imply a large overestimation. For example, Quaoar would have 2000km for an albedo of 0.04. Moreover, big TNOs have the tendency to fall off from the p=0.04 curve to higher albedos as their sizes increase (decreasing H). As we saw in Section 2, there are physical reasons that explain this tendency observed on the plot. Pluto has a very high albedo, thanks mainly to its atmosphere with correlated surface dynamics (Yelle and Elliot, 1997). The position of Charon on the plot is more problematic to interpret though. It suggests the presence of icy frosts and perhaps the existence of a tenuous atmosphere helping to enhance the albedo. Water ice frosts have been found (Nakamura et al., 2000) but it is not clear if this moon really possess a tenuous atmosphere (Elliot and Young, 1991). At the faint end, note that for H>6.0~6.5, binary TNOs and centaurs strongly do not follow the typical p=0.04 curve, with almost all of them falling off towards higher albedos. From the above, evidently assuming albedo 0.04 is not adequate for large TNOs, transneptunian binaries and centaurs (see also Section 3.3.1). We derived two curve fittings from the objects with diameter measurements data. We did not include centaurs neither transneptunian binaries in the following derivation. The light gray line shows the best fitting for thirteen TNOs in the range 1.5
(
)
(
)
5
Substituting Equation 2 into Equation 1 and solving for p we have K ⋅ 100.4(m∗ − H ) (4) p(H , D ) = , D2 with K=9·1016. One can derive the albedo as a function of absolute magnitude putting (3) into (4) to finally get K ⋅10 0.4(m∗ − H ) (5) p(H ) = f 2 g 2H for H≤5.5~6.0; Or the albedo as a function of size (6) p (D ) =
K ⋅ 10
D 0.4 m∗ − log g f
or p (D ) ≈
K ⋅ 10
0.4 m∗ +10 log
D f
simplifying log g for -0.1, D D2 for D≥500~600km. Determination of diameters and albedos based on the absolute magnitudes for the same bodies in Table 1 resulted in reasonable estimates. Taking again Quaoar as an example, our estimated size and albedo would be around 1120km and 0.13 respectively, within the limits of measured values. We also estimated diameters and albedos of other big TNOs for which no measurements are available yet (Table 2). Although estimations using Equations 3, 5 or 6 have considerable uncertainties (limited sample, measurement errors, discordance among different observers, etc.), in our sense it is much better than just assuming p=0.04 indiscriminately for all sizes. Our present analysis suggests that for large TNOs (say, H≤5.5), the diameter should not be estimated by any assumed constant albedo, but from the tendency observed in the best fit of all large TNOs with diameter measurements. Henceforth we will use our empirical relations to estimate sizes and albedos. We note too that the error bars of our fit include errors of size measurements, uncertainties for objects with diameter upper limits and variations in the absolute magnitudes (±0.1) for all objects. If the centaurs were considered in the fitting, we would have a size overestimation for H<2.5 and a severe underestimation for 3.5
6
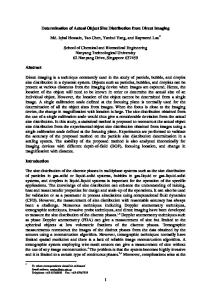
range if the albedos are in fact systematically larger than 0.04. In the opposite direction of the curve (H>5.5), things are more difficult with the lack of data and mixing of TNOs (mostly binaries) with centaurs, dynamical classes that surely suffer different processing. Even though, in this region of smaller objects there is an obvious tendency of higher albedos than the usual 0.04. Therefore, any assumption of albedos for smaller objects should seriously consider p>0.04 (see Grundy et al., 2005 for a discussion). 3.2. Outgassing in large TNOs: tenuous atmospheres and icy frosts The environment in the transneptunian region favors the formation of tenuous permanent or transient atmospheres. This is supported by diverse evidences: a) the atmospheres of Pluto (Yelle and Elliot, 1997) and Triton (Yelle et al., 1995); b) abundance of volatiles with sublimation temperatures (Tsub) comparable to the local temperature; c) intrinsic and/or induced activity on some bodies. Intrinsic activity has been attributed to the outgassing of embedded volatiles, namely HCN (Tsub =95K), CO2 (Tsub =72K), CH4 (Tsub =31K), CO (Tsub =25K) and N2 (Tsub =22K.), and could be triggered by diverse mechanisms, such as heat released from the change of amorphous to crystalline water ice, decay of radioactive nuclides, collisions, etc. (Sekiguchi et al., 2002). In fact, activity has been reported for comets at large heliocentric distances and much beyond the water ice sublimation limit (Hainaut et al., 2000; Sekiguchi et al., 2002). At transneptunian distances temperatures are around 30K~50K, so that activity could be playing an important role with sublimation of supervolatiles and surface changes, and hence significant changes of albedo. Furthermore, Delsanti et al. (2004) have already shown that intrinsic activity must have an important role for the colors, albedos and other surface properties of TNOs. According to spectra measurements, Pluto is known to have H2O, CH4, CO and N2 ices on its surface (Brown, 2002). Recently, it has been reported that Quaoar possesses ices identified as H2O (amorphous and some part in crystalline form), CH4 and ammonia hydrate (Jewitt and Luu, 2004; de Bergh et al., 2005). Consequently this would have relation with icy frosts or potential sublimation of supervolatiles to account for the albedo reported (about 0.1). Taking the evidences together, it appears reasonable to expect the formation of thin gaseous and/or dusty atmospheres in large TNOs, because they would have the mass needed to avoid direct escape of materials into space. Thus, volatile outgassing could sustain a hypothetical atmosphere and contribute to eject dust or/and fresh icy grains on the surface. Besides, volatiles condensing near the surface can also form icy frosts. All these processes working together could explain the systematic higher albedos on large TNOs. Following this interpretation, we analyzed the feasibility of existence of such gaseous structures according to some of the most common chemical species in the outer solar system: CH4, CO and N2. We assumed that if the thermal velocity vth of molecules in the atmosphere is less than the escape velocity vesc of the same molecules from a parent body, such object could be capable to keep an atmosphere. The vth and vesc are defined as 2kT / mM and 2GM / R , where G is the universal gravitational constant and k is the Boltzmann’s constant. M denotes the mass of the parent body with radius R and mean density ρ . Lastly, T represents the temperature in an atmosphere consisting of a molecule with mass mM. For simplicity, we assumed T ( K ) = 280r −1 / 2 , where r is the heliocentric distance of the object in units of AU. In general, TNOs larger than about 700km have the possibility to harbor atmospheres consisting either of CH4, CO or N2, even assuming densities of TNOs as low as 0.5gcm-3 (Figure 3). Our simple treatment assumes that the gas is at thermal equilibrium, a condition that may be not necessarily true for all TNOs. Indeed, the gas may escape from the surface via sublimation following an expansion velocity given by vexp = 580r −1/ 2 m0 / mM , where r is given in AU and m0 is the water molecular mass (Bobrovnikoff, 1954; Delsemme, 1982). Besides, as dust and icy grains should be well coupled with the gas, it is likely that some macroscopic material will be released with a velocity nearly described by vexp. Analyzing the dependence of vth and vexp with heliocentric 7
distance, we found that the latter dominates only inside rcrit<1.7AU for a particular gas constituent2. That is, if we use the expansion velocity instead of thermal velocity in our investigation above (assuming vexp
rcrit [AU] is a constant given by
(4205m0 / 7k )2 8
(Table 1). Thus, a comparison according to observational data is extremely problematic. 3.3.1. Transneptunian binaries: some facts and clues on their origin The albedo weighted average of the four transneptunian binaries is ~0.10 and ~0.16 assuming densities of 0.5gcm-3 and 1gcm-3 respectively3. Such values are 2.5~4 times greater than the long assumed p=0.04. In particular, the albedo obtained (0.37) for 1997 CQ29 assuming 1gcm-3 density would be almost one order of magnitude bigger (Noll et al., 2004a). Physically it is difficult to explain the reason for high albedos on these binaries. With components typically less than 250km, we cannot apply here our approach discussed for large TNOs in previous sections. On the other hand, Stern (2002) has demonstrated the possibility of formation of binary TNOs4 via collisions with the condition of albedos equal 0.15 or more. Thus, current albedo values constrained so far match the predictions of Stern’s model, which also allows the formation of transneptunian binaries even in more recent periods of the solar system history. If collisions are indeed the primary mechanism for their formation, Stern’s model would offer an explanation for the high albedos observed assuming components being fragments composed of fresh ices from the interior of a large parent body. Within the same scenario, another possibility is the deposit of fresh materials on the surface of either one or both the components raising the albedos. 3.4. Size distribution of the main transneptunian populations In this section, we investigate the relation of orbital elements with absolute magnitudes for the main transneptunian populations focusing on large bodies. We used only objects with more than one opposition observations, thus having more reliable orbits and with little danger of dynamical misclassification. In Figure 1, it is illustrated the TNOs orbital elements distribution with emphasis on the brightest bodies (i.e., largest objects). From our discussion in Section 3.1, we took H=5.5 (D~600km) as reference to define large TNOs (H≤5.5). We also show both the big hot and cold classical TNOs and large non-classical bodies. Mostly, large TNOs concentrate for q>35AU except several big ones in the 3:2 mean motion resonance, although one should recall observational bias playing a role here. That is, with smaller perihelion distances, these objects are more likely to be detected by standard surveys (Bernstein and Khushalani, 2000). For the 2:1 mean motion resonance, there are apparently three big objects trapped in. In the classical region, we notice a greater presence of large bodies in the hot population when compared to the cold one. We investigated the absolute magnitude distributions of cold and hot classical TNOs for different threshold inclinations with steps of 0.5º. For the best inclination threshold i=4.5º, the probability that both populations are the same is 0.37% (199 cold and 117 hot objects). Assuming other definitions of classical TNOs, such as only classical bodies with q>35AU or/and excluding 5:3 and 2:1 resonants from the sample resulted in even smaller probabilities (<0.1%). Apart from the small uncertainties caused by arbitrary definitions, it is very likely the presence of two distinct populations in the classical region according to sizes and inclinations with confidence level >99.63%. The division of cold and hot populations at 4.5º is in accordance with previous investigations and is not caused by observational biases (Levison and Stern, 2001; Bernstein et al., 2004; Peixinho et al., 2004). Therefore, the criterion for division of both populations seems to be well established and should not affect our analysis of subpopulations. Furthermore, note that while the largest hot classical TNOs are spread across the entire classical region from low to very high inclinations and show diverse sizes (from nearly 600km up to 1260km, the size of Quaoar), the biggest cold ones seem to be located in a narrow region ~44-45AU with sizes mostly ranging 600~650km. We performed a K-S test to check the significance of both 3 4
Densities of TNOs indicate values greater than 0.5gcm-3 and increasing for larger sizes (Sheppard and Jewitt, 2002). See Petit and Mousis (2004) for a more detailed discussion about the formation and evolution of binary TNOs. 9
samples having different semimajor axes distributions (6 large cold and 23 large hot bodies). The statistic resulted 24.66% for equal parent populations, implying it is statistically not significant to affirm large cold classical TNOs are distributed in semimajor axes unequally when compared to their counterparts in the hot population. By the other hand, the samples are very small and only more observations will solve definitely this issue with better statistics. Interestingly, Chiang (2002) have suggested the existence of a collisional family whose boundaries in phase space roughly match those of all large cold classical bodies. After close inspection of Figure 1, it is intriguing that inside a~43.5AU the distribution of sizes appear to be peculiar. We stress the exclusive concentration of “very large” TNOs (H≤4.5) in the same region. Indeed, four of them have already diameter measurements as shown in Table 1: 1996 TO66, Varuna, 2002 TX300 and Quaoar; other four have only our diameter estimates as shown in Table 2: 2002 UX25, 2002 MS4, 2004 GV9 and 2003 QW90. Once again we applied the K-S test to assert the significance of this claim. We considered all classical TNOs with H≤5.5 and arbitrarily divided the population into two groups with a threshold at 43.5AU: Group I for a<43.5AU and Group II for a>43.5AU. The statistics gave us 99.98% of confidence that the concentration of larger classical TNOs at a<43.5AU seems indeed to be a real feature. This conclusion could be the result of observational bias though, because objects at smaller distances are easier to be discovered. Accordingly, if the objects from Group I have perihelia or distance at discovery distribution significantly different from that of Group II then our claim would be a consequence of observational bias. We applied the K-S test for the distributions of perihelia and distance at discovery of both groups finding that they cannot be considered distinct (K-S statistic = 94.27% and 22.23% respectively). This argues in favor of our hypothesis. Different distributions of large classical bodies for a<43.5AU and a>43.5AU could also be caused by an uneven concentration of cold and hot populations within each group. That is, if one group is dominated by cold classical TNOs and vice-versa, our claim would be a direct consequence from the fact that cold and hot populations possess different brightness distributions. Group I contained 10 objects exclusively from the hot population. Group II contained 19 objects, from which 6 were cold classical bodies. We repeated the K-S test excluding the 6 objects from Group II finding 99.85% of confidence that both groups have distinct absolute magnitude distributions again strengthening our claim. We also stress that this positive result is achieved only for absolute magnitudes H≤5.5 and does involve semimajor axes with the best threshold around ~43.5AU, therefore excluding any influence of other orbital parameters. Finally, we also checked the discovery circumstances of each very large TNO within Group I using published Minor Planet Circulars. We found these big objects were observed by different telescopes focusing in distinct regions of the sky during the respective diverse epochs. Moreover, except two objects5, all of them were discovered by different teams of observers. A word of caution is necessary though: observers follow similar procedures for the detection of TNOs so that a bias cannot be completely ruled out. By the other hand, this possibility is unlikely. Taking together the uncorrelated discovery circumstances of these objects with our investigations, we can affirm that large classical TNOs are distributed differently inside a<43.5AU and a>43.5AU, with the largest bodies being preferentially located in the inner part of the classical region. This result is intriguing because no scenario can explain why there should be a preference for concentration of larger TNOs in the inner region of the classical belt.
4. Summary and conclusions Using the currently available limited observational data sample, simple theoretical approaches and the robust K-S statistical test, we analyzed the size/albedo and absolute magnitude distributions of TNOs and its main subpopulations. The main results of this work are summarized below: 5
Only Quaoar and 2002 MS4 were discovered by the same team using the Palomar/NEAT. Both objects had different discovery circumstances though. 10
•
Large TNOs (H≤5.5) have in general higher albedos (≥0.04) that seem to increase systematically with size. Empirical equations to estimate sizes/albedos were derived and can offer testable predictions. Together with recent works (Noll et al., 2004a; 2004b; Grundy et al., 2005), the long-assumed p=0.04 cannot hold for the majority of TNOs. Moreover, volatile sublimation (CH4, CO or N2) at transneptunian distances supports the idea of a significant contribution of thin gaseous atmospheres and/or icy frosts in determining higher albedos for TNOs larger than 700km; • Resonant TNOs have possibly higher albedos when compared to other TNOs. The main reason would be a more excited collisional ambient for the former. In this way, resonant TNOs surfaces would be more rejuvenated by collisions itself (surface resurfacing) or/and by supervolatile outgassing provoked by collisional excitation. Furthermore, as those bodies have smaller perihelion distances and more frequent perihelion passages, this could also help to trigger outgassing activity contributing for an average bigger albedo; • Big cold classical TNOs (~600km) appear to be concentrated between 44-45AU. These bodies might constitute the remnants of a collisional family, as suggested by Chiang (2002); • Larger classical TNOs are anomalously concentrated in the inner part of the classical region (a<43.5AU) with >99.85% of confidence. This surprising result is unlikely to be the effect of observational biases and therefore suggests a new puzzling constraint for the formation and evolution of the entire transneptunian region. Finally, we expect that new observations will bring light to our understanding and reduce the uncertainties in general. For example, it is quite simplistic to assume that the albedo will depend only on the absolute magnitude or diameter, since it has clearly dependence on several factors such as chemical composition, thermal evolution, surface structure, atmospheres and so on. Also, it is worth noting that all TNOs with size and albedo measurements belong to several dynamical classes, such as hot classicals, resonants and scattered bodies. In our analysis, there is no single cold classical TNO in the sample (we did not consider binaries, Table 1), so that our discussions are valid only for the former dynamically excited classes. In conclusion, our approach should be seen as a starting point offering some testable previsions concerning sizes and albedos.
Acknowledgements: We would like to thank Olivier R. Hainaut for comments and suggestions that greatly improved this work. Comments from an anonymous referee also helped to give more consistency to our results. We also thank Mike E. Brown for his kind communication of the size of Sedna. Finally, we appreciated the comments from Wilhelm J. Altenhoff and Jose L. Ortiz giving some light about thermal observations. This research was supported by “The 21st Century COE Program of Origin and Evolution of Planetary Systems” in the Ministry of Education, Culture, Sports, Science and Technology of Japan. References: Altenhoff, W. J., Menten, K. M. and Bertoldi, F., 2001. Size determination of the Centaur Chariklo from millimeter-wavelength bolometer observations. Astronomy&Astrophysics 366, L9-L12. Altenhoff, W. J., Bertoldi, F. and Menten, K. M., 2004. Size estimates of some optically bright KBOs. Astronomy & Astrophysics 415, 771-775. Bernstein, G. M. and Khushalani, B., 2000. Orbit fitting and uncertainties for Kuiper belt objects. The Astronomical Journal 120, 3323-3332. Bernstein, G. M., Trilling, D. E., Allen, R. L., Brown, M. E., Holman, M. and Malhotra, R., 2004. The size distribution of trans-neptunian bodies. The Astronomical Journal 128, 1364-1390. Bobrovnikoff, N. T., 1954. Reports of observations 1953-1954: Perkins Observatory-Physical properties of comets. The Astronomical Journal 59, 356-358. Brown, M. E., 2001. The inclination distribution of the Kuiper belt. The Astronomical Journal 121, 2804-2814. 11
Brown, M. E., 2002. Pluto and Charon: Formation, Seasons, Composition. Annual Reviews of Earth and Planetary Sciences 30, 307-345. Brown, M. E. and Trujillo, C. A., 2003. Ices on the surface of (50000) Quaoar. The Astrophysical Journal Letters, submitted. Brown, M. E. and Trujillo, C., 2004. Direct measurement of the size of the large Kuiper belt object (50000) Quaoar. The Astronomical Journal 127, 2413-2417. Chiang, E. I., 2002. A collisional family in the classical Kuiper belt. The Astrophysical Journal 573, L65-L68. Choi, Y. -J., Cohen, M., Merk, R. and Prialnik. D., 2002. Long-term evolution of objects in the Kuiper belt zone – effects of insolation and radiogenic heating. Icarus 160, 300-312. Cruikshank, D. P., Stansberry, J. A., Emery, J. P., Fernández, Y. R., Werner, M. W., Trilling, D. E. and Rieke, G. H., 2005. The high-albedo Kuiper belt object (55565) 2002 AW197. The Astrophysical Journal 624, L53-L56. Davies, J. K., 2000. Physical characteristics of trans-neptunian objects and centaurs. Proceedings of the ESO Workshop Minor Bodies in the Outer Solar System (1998). A. Fitzsimmons, D. Jewitt, and R. M. West eds. Springer-Verlag, Berlin, New York, 9-24. Davies, J., 2001. Beyond Pluto. Exploring the outer limits of the Solar System. Cambridge University press. De Bergh, C., Barucci, A., Doressoundiram, A., Dotto, E., 2005. Spectroscopy of Kuiper Belt Objects and Centaurs. 35th COSPAR Scientific Assembly, p. 1572. De Sanctis, M. C., Capria, M. T. and Coradini, A., 2001. Thermal evolution and differentiation of Edgeworth-Kuiper belt objects. The Astronomical Journal 121, 2792-2799. Dell’Oro, A., Marzari, F., Paolicchi, P. and Vanzani, V., 2001. Updated collisional probabilities of minor body populations. Astronomy&Astrophysics 366, 1053-1060. Delsanti, A., Hainaut, O., Jourdeuil, E., Meech, K. J., Boehnhardt, H. and Barrera, L., 2004. Simultaneous visible-near IR photometric study of Kuiper Belt Objects surfaces with the ESO/Very Large Telescopes. Astronomy&Astrophysics 417, 1145-1158. Delsemme, A. H., 1982. Chemical Composition of Cometary Nuclei. In Comets, ed. L. L. Wilkening, University of Arizona Press, Tucson, 85. Duncan, M. J. and Levison, H. F., 1997. A disk of scattered icy objects and the origin of Jupiter-family comets. Science 276, 1670-1672. Elliot, J. L. and Young, L. A., 1991. Limits on the radius and a possible atmosphere of Charon from its 1980 stellar occultation. Icarus 89, 244-254. Elliot, J. L., Kern, S. D., Clancy, K. B., Gulbis, A. A. S., Millis, R. L., Buie, M. W., Wasserman, L. H., Chiang, E. I., Jordan, A. B., Trilling, D. E. and Meech, K. J., 2005. The Deep Ecliptic Survey: A Search for Kuiper Belt Objects and Centaurs. II. Dynamical Classification, the Kuiper Belt Plane, and the Core Population. The Astronomical Journal 129, 1117-1162. Fernández, Y. R., Jewitt, D. C. and Sheppard, S. S., 2002. Thermal properties of centaurs Asbolus and Chiron. The Astronomical Journal 123, 1050-1055. Gil-Hutton, R., 2002. Color diversity among Kuiper belt objects: the collisional resurfacing model revisited. Planetary and Space Science 50, 57-62. Gomes, R. S., 2003. The origin of the Kuiper belt high-inclination population. Icarus 161, 404-418. Grundy, W. M., Noll, K. S. and Stephens, D. C., 2005. Diverse Albedos of Small Trans-Neptunian Objects. Preprint: astro-ph/0502229. Hainaut, O. R., Delahodde, C. E., Boehnhardt, H., Dotto, E., Barucci, M. A., Meech, K. J., Bauer, J. M., West, R. M. and Doressoundiram, A., 2000. Physical properties of TNO 1996 TO66 Lightcurves and possible cometary activity. Astronomy&Astrophysics 356, 1076-1088. Hartmann, W. K., Tholen, D. J., Meech, K. J. and Cruikshank, D. P., 1990. 2060 Chiron Colorimetry and cometary behavior. Icarus 83, 1-15. Jewitt, D. C. and Luu, J. X., 1992. IAUC 5611: 1992 QB1. Jewitt, D. C. and Luu, J., 1998. Optical-infrared spectral diversity in the Kuiper belt. The 12
Astrophysical Journal 115, 1667-1670. Jewitt, D. C., 1999. Kuiper belt objects. Annual Review of Earth and Planetary Sciences 27, 287-312. Jewitt, D. C., Aussel, H. and Evans, A., 2001. The size and albedo of the Kuiper-belt object (20000) Varuna. Nature 411, 446-447. Jewitt, D. C., Luu, J., 2004. Crystalline water ice on the Kuiper belt object (50000) Quaoar. Nature 432, 731-733. Kenyon, S. J. and Luu, J. X., 1998. Accretion in the early Kuiper belt. I. Coagulation and velocity evolution. The Astronomical Journal 115, 2136-2160. Kenyon, S. J. and Luu, J. X., 1999. Accretion in the early Kuiper belt. II. Fragmentation. The Astronomical Journal 118, 1101-1119. Kenyon, S. J. and Luu, J. X., 1999. Accretion in the early outer Solar System. The Astrophysical Journal 526, 465-470. Lellouch, E., Moreno, R., Ortiz, J. L., Paubert, G., Doressoundiram, A. and Peixinho, N., 2002. Coordinated thermal and optical observations of trans-neptunian object (20000) Varuna from Sierra Nevada. Astronomy&Astrophysics 391, 1133-1139. Levison, H. F. and Stern, S. A., 2001. On the size dependence of the inclination distribution of the main Kuiper belt. The Astronomical Journal 121, 1730-1735. Margot, J. L., Trujillo, C., Brown, M. E. and Bertoldi, F., 2002. The size and albedo of KBO 2002 AW197. Bulletin of the American Astronomical Society 34, p.871. Morbidelli, A., Emel’yanenko, V. and Levison, H. F., 2004. Origin and orbital distribution of the trans-Neptunian scattered disc. Monthly Notices of the Royal Astronomical Society 355, 935-940. Morbidelli, A., Brown, M. E., 2005. The Kuiper belt and the primordial evolution of the Solar System. In Comets II. Festou, M. C. et al. (Eds.), University of Arizona Press, Tucson, 175-191. MPC: Minor Planet Center, 2005. http://cfa-www.harvard.edu/cfa/ps/mpc.html Nakamura, R., Sumikawa, S., Ishiguro, M., Mukai, T., Iwamuro, F., Terada, H., Motohara, K., Goto, M., Hata, R., Taguchi, T., Harashima, T., Kaifu, N., Hayashi, M. and Maihara, T., 2000. Subaru Infrared Spectroscopy of the Pluto-Charon System. Publications of the Astronomical Society of Japan 52, 551-556. Noll, K. S., Stephens, D. C., Grundy, W. M., Osip, D. J. and Griffin, I., 2004. The Orbit and Albedo of Trans-Neptunian Binary (58534) 1997 CQ29. The Astronomical Journal 128, 2547-2552. Noll, K. S., Stephens, D. C., Grundy, W. M. and Griffin, I., 2004. The orbit, mass, and albedo of transneptunian binary 1999 RZ253. Icarus 172, 402-407. Ortiz, J. L., Sota, A., Moreno, R., Lellouch, E., Biver, N., Doressoundiram, A., Rousselot, P., Gutiérrez, P. J., Márquez, I., González Delgado, R. M. and Casanova, V., 2004. A Study of Trans-Neptunian Object 55636 (2002 TX300), Astronomy&Astrophysics 420, 383-388. Osip, D. J., Kern, S. D. and Elliot, J. L., 2003. Physical Characterization of the Binary Edgeworth-Kuiper Belt Object 2001 QT297. Earth, Moon, and Planets 92, 409-421. Peixinho, N., Boehnhardt, H., Belskaya, I., Doressoundiram, A., Barucci, M. A. and Delsanti, A., 2004. ESO large program on Centaurs and TNOs: visible colors – final results. Icarus 170, 153-166. Petit, J. -M. and Mousis, O., 2004. KBO Binaries: how numerous were they? Icarus 168, 409-419. Press, W. H., Teukolsky, S. A., Vetterling, W. T. and Flannery, B. P., 1992. Numerical recipes in FORTRAN. The art of scientific computing. Cambridge University press. Russell, H. N., 1916. On the albedo of the planets and their satellites. The Astrophysical Journal 13, 173-196. Schulz, R., 2002. Trans-neptunian objects. The Astronomy and Astrophysics Review 11, 1-31. Sekiguchi, T., Boehnhardt, H., Hainaut, O. R. and Delahodde, C. E., 2002. Bicolour lightcurve of TNO 1996 TO66 with the ESO-VLT. Astronomy&Astrophysics 385, 281-288. Sheppard, S. S. and Jewitt, D. C., 2002. Time-resolved photometry of Kuiper belt objects: rotations, 13
shapes, and phase functions. The Astronomical Journal 124, 1757-1775. Stern, S. A., 1995. Collisional time scales in the Kuiper disk and their implications. The Astronomical Journal 110, 856-868. Stern, S. A. and Levison, H. F., 2000. Regarding the criteria for planethood and proposed planetary classification schemes. Transactions of IAU 2000. Stern, S. A., 2002. Implications regarding the energetics of the collisional formation of Kuiper belt objects. The Astronomical Journal 124, 2300-2304. Thébault, P. and Doressoundiram, A., 2003. Colors and collision rates within the Kuiper belt. Problems with the collisional resurfacing scenario. Icarus 162, 27-37. Tholen, D. and Buie, M. W., 1997. Bulk properties of Pluto and Charon. In Pluto and Charon. Stern, S. A. and Tholen, D. eds., University of Arizona Press, Tucson, 193-219. Thomas, N., Eggers, S., Ip, W.-H., Lichtenberg, G., Fitzsimmons, A., Jorda, L., Keller, H. U., Williams, I. P., Hahn, G. and Rauer, H., 2000. Observations of the trans-neptunian objects 1993 SC and 1996 TL66 with the Infrared Space Observatory. The Astrophysical Journal 534, 446-455. Tiscareno, M. S. and Malhotra, R., 2003. The Dynamics of Known Centaurs. The Astronomical Journal 126, 3122-3131. Trujillo, C. A., Jewitt, D. C. and Luu, J. X., 2001. Properties of the Trans-neptunian belt: statistics from the Canada-France-Hawaii Telescope survey. The Astronomical Journal 122, 457-473. Trujillo, C. A., Luu, J. X., Bosh, A. S. and Elliot, J. L., 2001. Large bodies in the Kuiper belt. The Astronomical Journal 122, 2740-2748. Veillet, C., Parker, J. Wm., Griffin, I., Marsden, B., Doressoundiram, A., Buie, M., Tholen, D. J., Connelley, M. and Holman, M. J., 2002. The binary Kuiper-belt object 1998 WW31. Nature 416, 711-713. Yelle, R. V., Lunine, J. I., Pollack, J. B. and Brown, R. H., 1995. Lower atmospheric structure and surface-atmosphere interactions on Triton. In: Cruikshank, D.P. (Ed.), Neptune and Triton. The University of Arizona Press, Tucson. Yelle, R. V. and Elliot, J. L., 1997. Atmospheric structure and composition: Pluto and Charon. In Pluto and Charon. Stern, S. A. and Tholen, D. eds., University of Arizona Press, Tucson, 347-390.
14
Object (8405) Asbolus (2060) Chiron (5145) Pholus (10199) Chariklo (58534) 1997 CQ29 component A component B 1998 WW31 component A component B (66652) 1999 RZ253 component A component B (88611) 2001 QT297 component A component B (15789) 1993 SC
a (AU) 17.942 13.665 20.431 15.869
e 0.619 0.382 0.573 0.176
i (º) 17.6 6.9 24.7 23.4
Diametera (km) 66±4 148±8 190±22 273±19
Hb 9.0 6.5 7.0 6.4
Albedoa,c 0.12±0.03 0.17±0.02 0.04±0.03 0.055±0.008
Classd C C C C
Ref.e 1 1 2 3
45.508
0.123
2.9
101-80f 83-66 f
7.20 7.60
0.23r-0.37rf 0.23r-0.37rf
bTNO
13
44.577
0.086
6.8
186-148f 155-123f
7.95 8.35
0.034r-0.054rf 0.034r-0.054rf
bTNO
16
43.624
0.087
0.6
209-166f 173-137f
6.85 7.25
0.076r-0.12rf 0.076r-0.12rf
bTNO
14
43.870
0.031
2.6 5.2
3:2TNO
(38628) Huya
39.719
0.281
15.5
(15874) 1996 TL66
83.083
0.578
24.0
(47171) 1999 TC36
39.233
0.221
8.4
(24835) 1995 SM55
41.710
0.105
27.1
(19521) Chaos
45.715
0.105
12.1
(55565) 2002 AW197
47.471
0.130
24.3
(19308) 1996 TO66
43.139
0.121
27.5
(28978) Ixion
39.534
0.241
19.6
(20000) Varuna
43.070
0.051
17.2
0.057-0.09f 0.057-0.09f 0.022 (+0.013;-0.006) 0.018 (+0.017;-0.005) >0.08 0.049 (+0.033;-0.011) 0.03 (+0.012;-0.007) 0.035 (+0.027;-0.009) 0.05±0.01 0.045 (+0.031;-0.011) >0.04 0.047 (+0.032;-0.011) >0.04 0.045 (+0.031;-0.011) 0.17±0.03 0.101r (+0.038;-0.022) 0.094 (+0.047;-0.018) >0.04 0.054 (+0.035;-0.012) >0.15 0.099 (+0.048;-0.019) 0.038 (+0.022;-0.010) 0.049r (+0.029;-0.013) 0.07r (+0.030;-0.017) 0.078 (+0.043;-0.016) >0.06 0.094 (+0.047;-0.018) >0.04 0.071 (+0.041;-0.015) 0.38b±0.015 0.274 (+0.070;-0.033) 0.092r (+0.036;-0.023) 0.101b (+0.039;-0.024) 0.130 (+0.055;-0.022) 0.207 (+0.066;-0.029) 0.44~0.61b 0.694 (+0.054;-0.036)
15
0.183
6.80 7.60 6.9
bTNO
39.355
247-196f 171-136f 328 (+58;-66) 420 (+80;-120) <540 700 (+100;-160) 632 (+84;-98) 600 (+90;-150) 609 (+93;-47) 660 (+100;-150) <701 680 (+100;-160) <742 660 (+100;-150) 700±50 886 (+115;-131) 960 (+110;-180) <897 740 (+100;-160) <804 980 (+110;-180) 1060 (+180;-220)
4 TW 9 TW 4 TW 9 TW 9 TW 9 TW 17 5 TW 9 TW 9 TW 6 6 12 TW 11 TW 9 TW 8 TW 7 7 TW 10 TW 8 TW
(55636) 2002 TX300
43.081
0.121
25.9
(84522) 2002 TC302
55.139
0.293
35.1
Charon
39.482
0.249
17.1
(50000) Quaoar
43.440
0.034
8.0
(90377) Sedna
501
0.848
11.9
39.482
0.249
17.1
Pluto
900 (+130;-150) 880 (+110;-170) <1110 960 (+110;-180) <1195 840 (+100;-170) 1250±50 1620 (+110;-180) 1260±190 1120 (+110;-180) <1800 1420 (+110;-180) 2345±55 2560 (+70;-90)
4.7 5.4 4.9 4.8 4.9 3.3
4.5 3.2 3.7
3.3 3.9 1.0 2.6
1.6 -1.0
3:2TNO STNO 3:2bTNO TNO TNO 2:1TNO
TNO 3:2TNO TNO
TNO 5:2STNO 3:2bTNO TNO
STNO 3:2bTNO
Table 1 – Transneptunian objects and centaurs with diameter and albedo measurements sorted by sizes. The original orbital data (a, e, i and H) as of 11 April of 2005 was taken from the Minor Planet Center (MPC, 2005). a usually obtained by simultaneous thermal and optical observations. In the last row of each object, the values in italic are estimations calculated using empirical equations 3 and 5 (see text). b absolute visual magnitude. c geometrical albedos with r and b referring to those at red (700nm) and blue (450nm) wavelengths respectively. When no band is given, the albedos refer to the V-band wavelengths (550nm). d C = centaur; TNO = transneptunian object; bTNO = binary TNO; STNO = scattered TNO; p:q = in the p:q mean motion resonance. e reference for diameter and albedo measurements. f obtained indirectly and constrained for assumed densities of 0.5gcm-3 and 1gcm-3 respectively. References: (1) Fernández et al. (2002); (2) Davies (2000); (3) Altenhoff et al. (2001); (4) Thomas et al. (2000); (5) Margot et al. (2002); (6) Lellouch et al. (2002); (7) Brown and Trujillo (2004); (8) Tholen and Buie (1997); (9) Altenhoff et al. (2004); (10) Brown, M. E., private communication (2005); (11) Ortiz et al. (2004); (12) Jewitt et al. (2001); (13) Noll et al. (2004a); (14) Noll et al. (2004b); (15) Osip et al. (2003); (16) Veillet et al. (2002); (17) Cruikshank et al. (2005); TW = this work.
15
Object (90482) Orcus (55637) 2002 UX25 2002 MS4 2003 AZ84 (90568) 2004 GV9 (42301) 2001 UR163 (84922) 2003 VS2 2002 KX14 2003 QW90 2002 KW14 (26375) 1999 DE9 2001 QF298 2003 FY128 2000 CN105 2000 YW134 2001 KA77 2002 WC19 2002 XV93
a (AU) 39.453 42.562 41.758 39.598 42.238 51.330 39.361 38.925 43.267 46.877 56.046 39.223 49.897 44.809 58.134 47.558 47.875 39.359
e 0.218 0.144 0.142 0.177 0.083 0.283 0.074 0.041 0.034 0.203 0.423 0.114 0.257 0.094 0.291 0.093 0.264 0.128
i (º) 20.6 19.5 17.7 13.6 22.0 0.8 14.8 0.4 10.4 9.8 7.6 22.4 11.8 3.4 19.8 11.9 9.2 13.3
Diameter (km) 1200 (+110;-180) 900 (+110;-170) 840 (+100;-170) 840 (+100;-170) 820 (+100;-170) 780 (+100;-170) 780 (+100;-170) 740 (+100;-160) 740 (+100;-160) 720 (+100;-160) 700 (+100;-160) 700 (+100;-160) 680 (+100;-160) 660 (+100;-150) 660 (+100;-150) 660 (+100;-150) 660 (+100;-150) 660 (+100;-150)
Ha 2.3 3.6 3.9 3.9 4.0 4.2 4.2 4.5 4.5 4.6 4.7 4.7 4.8 5.0 5.0 5.0 5.0 5.0
Albedo 0.150 (+0.058;-0.024) 0.082 (+0.044;-0.016) 0.071 (+0.041;-0.015) 0.071 (+0.041;-0.015) 0.068 (+0.040;-0.014) 0.062 (+0.038;-0.014) 0.062 (+0.038;-0.014) 0.054 (+0.035;-0.012) 0.054 (+0.035;-0.012) 0.051 (+0.034;-0.012) 0.049 (+0.033;-0.011) 0.049 (+0.033;-0.011) 0.047 (+0.032;-0.011) 0.043 (+0.030;-0.010) 0.043 (+0.030;-0.010) 0.043 (+0.030;-0.010) 0.043 (+0.030;-0.010) 0.043 (+0.030;-0.010)
Classb 3:2TNO TNO TNO 3:2TNO 5:3TNO 5:2STNO 3:2TNO TNO TNO TNO STNO 3:2TNO TNO TNO STNO TNO 2:1TNO 3:2TNO
Table 2 – Large transneptunian objects sorted by absolute magnitudes with diameter and albedo values estimated by this work. The orbital data as of 11 April 2005 was taken from the Minor Planet Center (MPC, 2005). a absolute magnitude. b TNO = transneptunian object; STNO = scattered TNO; p:q = in the p:q mean motion resonance.
16
Figure 1: The orbital distribution of TNOs as of 11 April of 2005 taken from the Minor Planet Center (MPC, 2005). Only objects with more than one opposition observations are shown. Vertical dotted lines indicate mean motion resonances with Neptune. In the upper panel, perihelion distances of 30AU and 35AU are also indicated by dashed curves. We set a threshold at 4.5º to represent the division of classical TNOs into the cold (i<4.5º) and hot populations (i>4.5º) (see text for details). In this plot, we emphasize the configuration of the largest bodies (H≤5.5) in the transneptunian belt with circles (big hot classical TNOs), squares (big cold classical TNOs) and triangles (big non-classical TNOs). Pluto is shown by a gray triangle. Lastly, those objects with a “X” mark represent “very large” TNOs with H≤4.5. Many big TNOs are located at the 3:2 mean motion resonance, but this is likely to be a result of observational bias. In the classical region, we notice a greater presence of large bodies in the hot population when compared to the cold one (lower panel). Also, we stress the mysterious concentration of very large TNOs at a<43.5AU. Both claims are statistically significant and not likely to be caused by observational biases (see text). 17
Figure 2: Relation of diameter with absolute magnitude for bodies with size measurements. Diagonal dotted lines show values of constant albedo. From the top they are 0.02, 0.04, 0.08, 0.12, 0.25 and 0.50. The typically assumed p=0.04 albedo is indicated by the long dashed diagonal line. Two curve fittings were derived: the light gray line represents thirteen TNOs in the range 1.5
18
Figure 3: The existence of a hypothetical atmosphere around a TNO with size D and mean density ρ at heliocentric distance r. The region above the lines indicates where a body can possess an atmosphere consisting of either CH4 (black lines), CO or N2 (gray lines). Dashed and solid lines represent assumed TNOs densities for 0.5gcm-3 and 1gcm-3 respectively. Two cases are considered for the gas molecules: thermal velocity (thick lines) and expansion velocity (thin lines). Note that there is strong support for the existence of permanent or temporary tenuous atmospheres in TNOs larger than about 700km, thus including all the known largest TNOs.
19
Figure 4: Bodies with diameter and albedo measurements. Some dynamical groups are indicated by “3:2” and “2:1”, representing objects respectively in the 3:2 and 2:1 mean motion resonances with Neptune. Also, “hot” are hot classical TNOs and “scat” indicate scattered TNOs. The horizontal dotted line marks the typically assumed albedo p=0.04. Some objects with arrows indicate albedo-lower/diameter-upper limits. The black curve was traced by using Equation 6 with parameters derived as explained in the text. Note that larger objects tend to have higher albedos following roughly the curve. Notice too that Charon possesses a quite high albedo, whose origin is not clear yet. The current position of transneptunian binaries poses a puzzle with no apparent link with the general tendency observed for larger TNOs. Finally, we realize the tendency of resonant bodies to present higher albedos when compared to hot and scattered TNOs, possibly indicating physical differences between resonants and non-resonants as a result of different collisional and orbital histories.
20