Fertility, Longevity, and Capital Flows Zs´ ofia B´ar´any (SciencesPo) Nicolas Coeurdacier (SciencesPo & CEPR) St´ephane Guibaud (SciencesPo)
June 2015
1 / 39
Aging across the world
I
I
The world is aging. I
Drop in fertility.
I
Fall in mortality rates; rising life expectancy.
Convergence of demographic patterns across countries. I
Emerging countries have become more similar to developed countries.
2 / 39
Fertility across the world Fertility rate adjusted for infant mortality 6 Developed Countries
Emerging Countries
5
4
3
2
2040
2035
2030
2025
2020
2015
2010
2005
2000
1995
1990
1985
1980
1975
1970
1965
1960
1955
1950
1
3 / 39
Survival probability across the world Probability of surviving until age 65 conditional on being 25 100%
90%
80%
70%
60%
50% Developed Countries
40%
Emerging Countries
2040
2035
2030
2025
2020
2015
2010
2005
2000
1995
1990
1985
1980
1975
1970
1965
1960
1955
1950
30%
4 / 39
Aging across the world (cont’d)
I
The world is aging.
I
But there are variations in aging across countries. I
Across emerging countries: speed and timing of convergence varies across countries.
I
Across developed countries: Old Europe and Japan are aging faster than others.
5 / 39
Fertility across emerging countries Fertility rate adjusted for infant mortality
6
Developed Countries
Old Europe & Japan
Sub-Saharan Africa
South & Central Asia, Middle East & North Africa
South America
South East Asia
5
4
3
2
2040
2035
2030
2025
2020
2015
2010
2005
2000
1995
1990
1985
1980
1975
1970
1965
1960
1955
1950
1
6 / 39
Survival probability across emerging countries Probability of surviving until age 65 conditional on being 25 100%
90%
80%
70%
60%
50%
40%
Developed Countries
Old Europe & Japan
Sub-Saharan Africa
South & Central Asia, Middle East & North Africa
South America
South East Asia 2040
2035
2030
2025
2020
2015
2010
2005
2000
1995
1990
1985
1980
1975
1970
1965
1960
1955
1950
30%
7 / 39
This paper
I
I
Investigates the impact on international capital flows of I
Global aging
I
Country-specific aging patterns.
Develops a multi-country lifecycle model of savings, which incorporates I
Common and country-specific demographic trends
I
Cross-country heterogeneity in access to credit and social security. Data
8 / 39
Theoretical results I
I
Global aging and capital flows. I
Global aging depresses the world interest rate.
I
Triggers ‘uphill’ capital flows due to the different response of savings in developed and emerging economies.
Country-specific aging and capital flows. I
Countries aging faster than the rest of the world are more likely to export capital.
I
The impact of country-specific aging tends to be stronger for less developed countries.
I
Potential solution to the ‘allocation puzzle’: fast-growing emerging countries are also the ones aging faster.
9 / 39
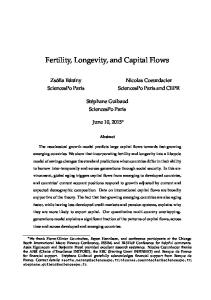
Country-specific aging and capital flows Expected aging and capital flows in emerging countries (1990-2010)
20%
Current Account (% of GDP, annual)
15%
10%
5%
0%
-5%
-10%
-15%
R² = 0.26 N = 103
-20% -4%
-3%
-2%
-1% 0% 1% 2% 3% 4% Expected Aging (annual expected rate of change)
5%
6%
7%
Notes: Expected aging defined as the expected change in old dependency ratio between 2010 and 2035 (annualized). Sample of emerging countries excluding oil producers. 10 / 39
Related literature Demographics and integrated capital markets. Capital flows: Obstfeld and Rogoff (1996), Brooks (2003), Domeij and Floden (2006), Ferrero (2010), Choukhmane (2012), Backus, Cooley, and Henriksen (2014) I Social security: Attanasio, Kitao, Violante (2007), Krueger and Ludwig (2007), Borsch-Supan et al. (2006) I
Global imbalances and the ‘allocation puzzle’. I
Bacchetta and Benhima (2013), Benhima (2013), Caballero, Farhi and Gourinchas (2008), Carroll and Jeanne (2009), Gourinchas and Jeanne (2011), Gourinchas and Rey (2013), Mendoza, Quadrini and Rios-Rull (2009), Sandri (2010), Song, Storesletten and Zilibotti (2011), Coeurdacier, Guibaud and Jin (2014)
Empirical literature on determinants of current account (or aggregate savings) across countries. Taylor and Williamson (1994), Higgins (1998), Chinn and Prasad (2003), Alfaro et al. (2014), meta-analysis by Cazorzi et al. (2012) I Leff (1969), Bloom et al. (2003), Aksoy et al. (2015)
I
11 / 39
Outline 1. Theory: three-period OLG model with multiple countries and integrated capital markets, incorporating – cross-country heterogeneity in the ability to transfer resources intertemporally and across generations; – cross-country differences in growth and aging prospects.
Useful framework to elucidate the mechanisms. 2. Quantitative multi-country OLG model. – Calibrated to cross-country demographics, growth, household debt, and social security data. [PRELIMINARY] – Simulate the world economy and compare outcomes to data (cross-country/time series). Run counterfactual experiments.
12 / 39
Theory
I
I
Agents live for at most three periods (y , m, o). I
Young: do not work, face credit constraints.
I
Middle aged: work, contribute to social security and save for retirement.
I
Old: consume out of accumulated assets and social security benefits, no bequest.
Demographics I
Life expectancy: a middle-aged individual in period t reaches retirement with probability pt .
I
Fertility: Ly ,t = nt Ly ,t−1 .
13 / 39
Production I
Output Yt = Ktα (At Lm,t )1−α , where productivity evolves as At+1 = (1 + γA,t+1 )At .
I
Wage rate wt = (1 − α)At ktα , with kt ≡ Kt /(At Lm,t ).
I
Rate of return between periods t and t + 1 (full depreciation). Rt = αktα−1 .
14 / 39
Social security
I
‘Pay-as-you-go’ system.
I
Contribution rate τt ; replacement rate σt .
I
Balanced budget condition Lm,t τt wt ⇒
τt
= Lo,t σt wt−1 =
pt−1 wt−1 σt . nt−1 wt
15 / 39
The household’s problem An agent born in a given country in period t maximizes u(cy ,t ) + βu(cm,t+1 ) + β 2 pt+1 u(co,t+2 ), where u(c) =
c 1−1/ω 1−1/ω ,
ω ≤ 1, subject to budget constraints
cy ,t + ay ,t
= 0,
cm,t+1 + am,t+1 = (1 − τt+1 ) wt+1 + Rt+1 ay ,t , Rt+2 am,t+1 co,t+2 = + σt+2 wt+1 . pt+1 and credit constraint ay ,t ≥ −θt
wt+1 . Rt+1 16 / 39
Savings decisions
I
Assume that the credit constraint is always binding ay ,t = −θt
I
wt+1 . Rt+1
The optimal savings of the middle aged is then 1−ω
am,t =
β −ω Rt+1 pt σt+1 wt pt (1 − τt − θt−1 ) w − . t 1−ω 1−ω −ω −ω pt + β Rt+1 pt + β Rt+1 Rt+1
17 / 39
Net asset demand over GDP Ly ,t ay ,t + Lm,t am,t − Kt+1 pt (1 − τt − θt−1 ) = (1 − α) 1−ω Yt pt + β −ω Rt+1 !# � � " 1−ω β −ω Rt+1 nt (1 + γA,t+1 ) kt+1 α α + (1 − α) θt + τ − 1−ω t+1 Rt+1 kt pt + β −ω Rt+1
I
Impact of aging (nt ↓ and/or pt ↑).
I
Impact of a drop in Rt+1 .
I
Sensitivities depend on credit constraints and social security. I
I
Aging leads to a greater increase in net asset demand in less developed countries (low θ, low τ ). A fall in Rt+1 leads to a larger drop in net asset demand in more developed countries. 18 / 39
Capital market equilibrium
I
Under financial autarky Kt+1 = Ly ,t ay ,t + Lm,t am,t .
I
Under financial integration X X � i i Kt+1 = Liy ,t ayi ,t + Lim,t am,t . i
i
Financial integration in period t implies i Rt+1 = Rt+1
for all i.
19 / 39
Steady-state interest rate: financial autarky I
Steady-state interest rate under financial autarky satisfies � � � �� � α α n(1 + γA ) −ω 1−ω p +θ +β R +θ+τ R= p(1 − τ − θ) 1−α 1−α In particular, with log utility (ω = 1) � � � � n(1 + γA ) α R= +θ +τ . (1 + βp) βp(1 − τ − θ) 1−α
I
Role of credit constraints (θ) and social security (τ ).
I
Impact of aging: n ↓ and/or p ↑ ⇒ R ↓. I
Larger fall of R with aging if ω low and/or τ low.
20 / 39
Steady-state interest rate: financial integration i Assume symmetric aging (nti = n, pti = p) and symmetric growth (γA,t = γA )
P
λi θi and τ =
P
λi τ i , where λi =
Ai,t Lim,t P . j j Aj,t Lm,t
I
Define θ =
I
The world interest rate in the integrated steady state satisfies � � � �� � n(1 + γA ) α α −ω 1−ω R= +θ +β R +θ+τ p 1−α 1−α p(1 − τ − θ)
I
Global aging depresses the world interest rate. I
i
i
Even more so if ω low and τ low.
21 / 39
Net foreign assets (NFA) I
Net foreign asset position of country i i i NFAit = Liy ,t ayi ,t + Lim,t am,t − Kt+1 .
I
In the integrated steady state � � p n(1 + γA ) NFAit =(1 − α) + (θ − θi ) p + β −ω R 1−ω R Yti � � p(1 − α) n(1 + γA ) + 1+ (τ − τ i ). p + β −ω R 1−ω pβ ω R ω
I
Countries with tighter credit constraints than the world average (θi < θ) and/or with lower social security than the world average (τ i < τ ) tend to export capital. 22 / 39
Global aging and capital flows � � NFALt NFAH p n(1 + γA ) t H L − = (θ − θ )(1 − α) + p + β −ω R 1−ω R YtL YtH � � p(1 − α) n(1 + γA ) + (τ H − τ L ) 1+ . −ω 1−ω p+β R pβ ω R ω I
A fall in fertility triggers a larger dispersion of NFAs between high-θ vs low-θ countries if the drop in R is large enough. A rise in longevity always triggers a larger dispersion of NFAs.
I
Global aging triggers a larger dispersion of NFAs between high-τ vs low-τ countries if the drop in R is large enough or if the social security system adjusts mostly through higher contribution rates (rather than lower replacement rates). 23 / 39
Global aging and capital flows Heterogenous credit constraints (θH vs θL ) Contribution rate, τ
n/p 5
0.12
4
0.1
3
0.08
2
0.06
1 −1
0
1
2
3
4
5
6
0.04 −1
0
1
Interest rate 0.03
0.16
0.02
0.14
0.01
0.12
0
0.1
−0.01
0.08
−0.02
0
1
2
3
3
4
5
6
4
5
6
NFA/GDP
0.18
0.06 −1
2
4
5
6
−0.03 −1
θH θL
0
1
2
3
24 / 39
Global aging and capital flows Heterogenous social security (τ H vs τ L ) Contribution rate, τ
n/p 5
0.2
4
0.15
3
0.1
2
0.05
τH τL
1 −1
0
1
2
3
4
5
6
0 −1
0
1
Interest rate
2
3
4
5
6
4
5
6
NFA/GDP
0.16
0.03
τH τL
0.02
0.14
0.01 0.12 0 0.1 −0.01 0.08 0.06 −1
−0.02
0
1
2
3
4
5
6
−0.03 −1
0
1
2
3
25 / 39
Country-specific aging Illustration for an emerging SOE, early demographic transition Fertility, n
Contribution rate, τ
Survival probability, p
2
1 RoW SOE
0.25 RoW SOE
0.9
1.8
0.2
0.8 1.6
0.15 0.7
1.4
0.1 0.6
1.2 1 −2 −1
0.05
0.5
0
1
2
3
4
5
6
0.4 −2 −1
RoW SOE
0
Interest rate
1
2
3
4
5
6
NFA/GDP
0.16
0 −2 −1
0
1
2
3
4
5
6
Saving and investment in SOE
0.1
0.14
RoW SOE
0.12
0.14
0.05
0.12
0
0.1
−0.05
0.1 0.08 0.06 0.04
RoW SOE
0.08 −2 −1
0
1
2
3
4
5
6
−0.1 −2 −1
0
1
2
3
4
5
6
0.02 −2 −1
S/GDP I/GDP
0
1
2
3
4
5
6
26 / 39
Country-specific aging Illustration for an emerging SOE, delayed demographic transition Fertility, n
Contribution rate, τ
Survival probability, p
2
1 RoW SOE
0.25 RoW SOE
0.9
1.8
0.2
0.8 1.6
0.15 0.7
1.4
0.1 0.6
1.2 1 −2 −1
0.05
0.5
0
1
2
3
4
5
6
0.4 −2 −1
RoW SOE
0
Interest rate
1
2
3
4
5
6
NFA/GDP
0.16
0 −2 −1
0
1
2
3
4
5
6
Saving and investment in SOE
0.1
0.14
RoW SOE
0.12
0.14
0.05
0.12
0
0.1
−0.05
0.1 0.08 0.06 0.04
RoW SOE
0.08 −2 −1
0
1
2
3
4
5
6
−0.1 −2 −1
0
1
2
3
4
5
6
0.02 −2 −1
S/GDP I/GDP
0
1
2
3
4
5
6
27 / 39
Quantitative OLG model I
I
Agents live for at most J¯+ 1 periods. I
¯ Age j = 0, . . . , J.
I
i Conditional survival probability pj,t .
Lifetime utility of agent born in period t in country i Uti
=
j−1 J¯ X Y j=0
! i p`,t+`
i β j u(cj,t+j ),
`=0
with isoelastic preferences 1
u(c) =
c 1− ω − 1 . 1 − ω1
28 / 39
Quantitative model Production I
Output Yti = (Kti )α Ait
J X
1−α i ej,t Lij,t
.
j=0
I
Labor income i i = ej,t (1 − α)Ait (kti )α , wj,t
I
kti ≡
Kti Ait
PJ
i i j=0 ej,t Lj,t
.
Gross rate of return i Rt+1 = 1 − δ + α(kti )α−1 .
29 / 39
Quantitative model Credit constraints
I
Credit constraints i aj,t ≥ −θti
i Hi pj,t j+1,t+1 i Rt+1
,
with i i Hj,t ≡ wj,t +
J−j X τ =1
�Q
�
τ −1 i i s=0 pj+s,t+s wj+τ,t+τ Qτ i s=1 Rt+s
.
30 / 39
Quantitative model Social security
I
Contribution and replacement rates must satisfy the balanced budget condition τti
J X j=0
i Lij,t wj,t
=
σti
J¯ X
i Lij,t wJ,t+J−j .
j=J+1
31 / 39
Quantitative model Unintentional bequests
I
Unintentional bequests left at the end of period t Qti
≡
¯ J−1 X
i i (1 − pj,t )Lij,t aj,t .
j=0
I
Redistributed to surviving agents as lump sum transfers.
32 / 39
Illustrative experiments: Calibration I
Adult life lasts for at most 7 periods (one period = 10 years).
I
Standard preferences/technology parameters. β = 0.985 (annual), ω = 1/2, α = 0.3, δ = 0.075 (annual).
I
Groups of countries or regions I I
Developed vs. Emerging. US & Anglo-saxon countries, Old Europe/Japan, East Asia, South-Central Asia & MENA.
I
Demographics & growth calibrated to match demographic composition, population & GDP sizes.
I
Calibrate {θi } and {τ i } on household debt/GDP and social security data. [in progress] I
I
Low θ and τ in Emerging countries. Relatively higher θ in US, and higher τ in Old Europe/Japan.
i ) calibrated on the US. Shape of age-income profiles (ej,t 33 / 39
Developed vs. Emerging Convergence in aging, heterogenous θs and τ s, integration at t = 0 Young−old ratio 5
Interest rate
S/GDP
CA/GDP
0.16 0.06 0.25
0.14
4
0.04 0.02
0.12 3
0
0.2
−0.02
0.1
−0.04
2
−0.06
0.15
0.08
−0.08 1 Developed Emerging 0 −2 −1 0 1 2 3 4 5 6
−0.1
0.06 0.1 0.04 −2 −1 0 1 2 3 4 5 6
Replacement rate
−0.12
−2 −1 0 1 2 3 4 5 6
GDP shares
−2 −1 0 1 2 3 4 5 6
I/GDP
1
NFA/GDP 0.15
0.5 0.25 0.8
0.1
0.4 0.05 0.6
0.2
0.3
0.2
0.1
0 0.4 0.15 0.2
−0.05 −0.1
0.1 0 −2 −1 0 1 2 3 4 5 6
0 −2 −1 0 1 2 3 4 5 6
−2 −1 0 1 2 3 4 5 6
−0.15 −2 −1 0 1 2 3 4 5 6
34 / 39
Developed vs. Emerging Convergence in aging and different productivity growth, heterogenous θs and τ s Young−old ratio 5
Interest rate
S/GDP
CA/GDP
0.16 0.06 0.25
0.14
4
0.04 0.02
0.12 3
0
0.2
−0.02
0.1
−0.04
2
−0.06
0.15
0.08
−0.08 1 Developed Emerging 0 −2 −1 0 1 2 3 4 5 6
−0.1
0.06 0.1 0.04 −2 −1 0 1 2 3 4 5 6
Replacement rate
−0.12
−2 −1 0 1 2 3 4 5 6
GDP shares
−2 −1 0 1 2 3 4 5 6
I/GDP
1
NFA/GDP 0.15
0.5 0.25 0.8
0.1
0.4 0.05 0.6
0.2
0.3
0.2
0.1
0 0.4 0.15 0.2
−0.05 −0.1
0.1 0 −2 −1 0 1 2 3 4 5 6
0 −2 −1 0 1 2 3 4 5 6
−2 −1 0 1 2 3 4 5 6
−0.15 −2 −1 0 1 2 3 4 5 6
35 / 39
Developed vs. Emerging Convergence in aging and different productivity growth, homogenous θs and τ s Young−old ratio 5
Interest rate
S/GDP
CA/GDP
0.16 0.06 0.25
0.14
4
0.04 0.02
0.12 3
0
0.2
−0.02
0.1
−0.04
2
−0.06
0.15
0.08
−0.08 1 Developed Emerging 0 −2 −1 0 1 2 3 4 5 6
−0.1
0.06 0.1 0.04 −2 −1 0 1 2 3 4 5 6
Replacement rate
−0.12
−2 −1 0 1 2 3 4 5 6
GDP shares
−2 −1 0 1 2 3 4 5 6
I/GDP
1
NFA/GDP 0.15
0.5 0.25 0.8
0.1
0.4 0.05 0.6
0.2
0.3
0.2
0.1
0 0.4 0.15 0.2
−0.05 −0.1
0.1 0 −2 −1 0 1 2 3 4 5 6
0 −2 −1 0 1 2 3 4 5 6
−2 −1 0 1 2 3 4 5 6
−0.15 −2 −1 0 1 2 3 4 5 6
36 / 39
Three Regions Developed, East Asia (fast growth & aging), Rest of Asia/MENA (slow growth & aging) Young−old ratio
Interest rate
S/GDP
CA/GDP
0.12 5
0.08 0.25
4
0.1
0.04
3
0.2 0
0.08
2
−0.04
0.15
1 0.06 0
Developed SEA RoE
−2 −1 0 1 2 3 4 5 6
−0.08 0.1 0.04 −2 −1 0 1 2 3 4 5 6
Replacement rate
GDP shares
0.7
0.8
0.6
0.7
0.5
0.6
0.4 0.3
−2 −1 0 1 2 3 4 5 6
0.5
I/GDP
NFA/GDP 0.2
0.25
0.15
0.2
0.05
0.15
−0.05
0.1
−0.15
0.1
0
0.4 0.3
−2 −1 0 1 2 3 4 5 6
0.2
−0.1 0.2
0.1 0.1 0 −2 −1 0 1 2 3 4 5 6
−2 −1 0 1 2 3 4 5 6
−2 −1 0 1 2 3 4 5 6
−0.2 −2 −1 0 1 2 3 4 5 6
37 / 39
Four Regions US (higher θ), Old Eur./Jap. (slower growth & higher τ ), E. Asia, Rest of Asia/MENA Young−old ratio
Interest rate
S/GDP
CA/GDP
0.12 5
0.08 0.25
4
0.1
0.04
3
0.2 0
0.08
2
0
−0.04
0.15
1 U.S. SEA Eu RoE
−2 −1 0 1 2 3 4 5 6
0.06 −0.08 0.1 0.04 −2 −1 0 1 2 3 4 5 6
Replacement rate
GDP shares
0.7
0.8
0.6
0.7
0.5
0.6
0.4 0.3
−2 −1 0 1 2 3 4 5 6
0.5
I/GDP
NFA/GDP 0.2
0.25
0.15
0.2
0.05
0.15
−0.05
0.1
−0.15
0.1
0
0.4 0.3
−2 −1 0 1 2 3 4 5 6
0.2
−0.1 0.2
0.1 0.1 0 −2 −1 0 1 2 3 4 5 6
−2 −1 0 1 2 3 4 5 6
−2 −1 0 1 2 3 4 5 6
−0.2 −2 −1 0 1 2 3 4 5 6
38 / 39
Conclusion I
Large variations across countries in timing and pace of aging.
I
Lifecycle model predicts capital flows depend on aging across the world and across countries.
I
Provides a qualitative rationale for patterns of capital flows across time and across countries.
I
Quantitative performance: to be fully assessed. I
I
Interactions between demographics, growth and level of development seem to have the potential to account for evolution of capital flows.
Next steps: public debt, imperfect foresight, cost of raising kids...
39 / 39
Household debt to GDP across the world 100% 90% 80% 70% 60%
50% 40% 30% 20% 10% 0% Emerging
Developed
Sub-Saharan Africa
South & South East Asia South America Central & Old Europe & Central Asia, Eastern Europe Japan Middle East & North Africa
US & Anglosaxons
40 / 39
Social security across the world [Preliminary evidence] 100% 90%
Replacement Rate (official)
% of contributors in working age population
% of recipients among retired
80% 70% 60% 50% 40% 30% 20% 10% 0% Emerging
back
Developed
Sub-Saharan Africa
South & South East Asia South America Central & Old Europe & Central Asia, Eastern Europe Japan Middle East & North Africa
US & Anglosaxons
41 / 39