Effective use of bubble size distribution measurements G. R. Forbes University of Cape Town, Cape Town, South Africa
G. de Jager University of Cape Town, Cape Town, South Africa
D. J. Bradshaw University of Cape Town, Cape Town, South Africa
ABSTRACT: Accurate bubble size distributions of flotation froths are now available. This paper shows that reducing data from a distribution to a single value descriptor is often inappropriate. Froths with “dynamic” (rapidly changing) bubble size distributions are introduced, and ways of dealing with them are investigated. A variety of measurements of froth bubble size are tested to determine their ability to discriminate between a selection of froth classes. Data reduction based on principal component analysis and frequently occurring bubble size distributions are found to be the most appropriate ways of dealing with bubble size distribution data. Increasing sample duration is shown to help resolve the problem of “dynamic” bubble size distributions by improving the ability to discriminate between froth classes. 1 INTRODUCTION & BACKGROUND 1.1 Machine vision systems for froth flotation Flotation is a separation process that is used in many mining operations to improve the concentration of the desired minerals prior to further downstream processing. It is well known that the flotation process is highly complex and affected by many interacting sub-processes. Control of the numerous input parameters (reagent dosage, froth depth, air addition rate) is typically performed by plant operators who make decisions based on the visual inspection of the state of the froth. As a result of this, numerous machine vision systems have been developed to analyse the state of the flotation froth (Bonifazi et al., 2001, Holtham and Nguyen, 2002, Hatfield et al., 2004, Bartolacci et al., 2005, Kaartinen and Hyötyniemi, 2005, Vathavooran et al., 2005). Such systems typically consist of a video camera mounted above the flotation cell, looking at the froth surface. The video camera output is connected to a computer, where specific algorithms convert the images to a set of output values. These measurements typically include bubble size, froth velocity, froth colour, froth stability and froth texture. It is important to note that there are numerous methods (algorithms) for computing these values, and as such, different systems are likely to produce different values. The advantage of having a machine vision system to monitor the state of the froth is that such a system is able to provide plant personnel with consistent,
precise, non-intrusive measurements that are available 24 hours a day. 1.2 Application of machine vision systems The aim of introducing a machine vision system onto a flotation plant is the development of a closed-loop control system that makes adjustments to reagents, air addition and froth depth automatically. Achieving this is a challenge that requires further research. However, there are a few stages on the road to closed-loop control where a machine vision system can be useful: a) Basic output. The output measurements from a machine vision system are available to plant personnel (in the control room for example). These values can be checked to ensure that the froth is operating in the desired range. b) Froth state identification. The machine vision system can be trained to identify different froth states. For example, a state could be defined by high froth velocity, large bubble size and high froth stability. When the froth is in an undesirable state, the operator can be alerted to this fact and take appropriate action to rectify the situation. c) Closed-loop control. Closed loop control can either be implemented by using the froth states as an input variable, or by using the basic output measurements from the machine vision system. 1.3 Bubble size distributions This paper focuses on bubble size distribution
Page 1, G. R. Forbes, G. de Jager, D.J. Bradshaw
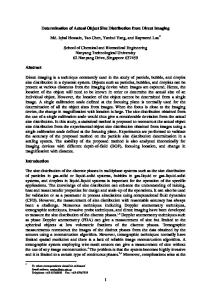
(BSD) measurements and the assessment of what useful information they contain. Bubble size distributions are often displayed as a cumulative bubble size distribution (CBSD). Numerous algorithms exist for determining bubble size distributions in flotation froths, however, only recently have improvements been made which allow the accurate measurement of bubble sizes in froths that have wide bubble size distributions. (Wang et al., 2003, Forbes and de Jager, 2004a, 2004b). To overcome the high dimensionality of bubble size distribution data, bubble size data is typically reduced to either a mean (Niemi et al., 1997, Cipriano et al., 1998, Holtham and Nguyen, 2002, Kaartinen and Hyötyniemi, 2005), median (p50) or p80 value. Alternatively, the data is reduced to a set of classes such as {small, medium, large} (Sweet, 2000). These reductions are not always appropriate, and can result in the loss of most of the information contained in a bubble size distribution. 1.4 “Dynamic” bubble size distributions Certain froth types exist that have “dynamic” (rapidly changing) bubble size distributions. These “dynamic” bubble size distributions occur when a froth, which is in steady state, has substantially different BSDs over a short period of time. An example of such a froth is shown in Figure 1, which shows still images and bubble size distributions for two frames of video footage which are taken within one second of each other (under steady state conditions). A
B
Cumulative Bubble Size Distribution Percentage Passing
100 80 60 40 A B
20 0 0 10
1
10
2
10
10
3
10
4
2
Bubble Size [pixels ]
Figure 1. Bubble size distributions for two frames of steady state copper froth taken within 1s of each other When froth has a “dynamic” BSD, it is important to take this into account when sampling. Clearly, a single frame of footage is not sufficient to suitably characterise such a froth, and so it is necessary to determine how much video footage is required to be
able to correctly identify different “dynamic” froth types. 1.5 Objectives The specific objectives of this paper are to: a) determine whether reducing bubble size distributions to a single value, such as mean, median or p80, is appropriate or not. b) determine what video clip duration(number of frames) needs to be analysed in order to overcome the problems associated with sampling “dynamic” BSDs. c) determine which algorithms are best suited for classifying the state of the froth, using bubble size information alone. 2 METHOD In this work, tests are performed to determine if certain measurements provide the user with valuable information. These tests are similar to sensitivity tests / signal-to-noise ratio tests. The test is constructed as follows. Firstly, two distinctly different conditions, that the user would like the measurement being tested to be able to discriminate between, are hand picked. An analogous example would be trying to discriminate between an apple (condition one) or an orange (condition two) using some measurement. Next, numerous measurements are taken from a large data set containing numerous examples of both conditions. In the analogous example, consider measuring the diameter of the fruit as a measurement. There is now a data set of diameters for both apples and oranges. The data set can be analysed to determine how successfully a new fruit will be classified (as either an apple or orange), based solely on its diameter. If it is found that apples and oranges have similar diameters, then the conclusion is that the measurement of a fruit’s diameter is not suitable for determining if it is an apple or an orange. This work proceeds in a similar manner, except that the measurement being analysed will be related to the bubble size of a froth (for example, mean, median or p80). The conditions will not be fruit, but rather images of froths at steady state, with different bubble size distributions. If the mean bubble size (for example) is not able to distinguish between two froth states, then the conclusion is that measuring the mean bubble size is inappropriate, and a different measure of bubble size must be used. 2.1 Froth data sets Two data sets have been used for this work. One is a set of video clips of platinum bearing froth and the
Page 2, G. R. Forbes, G. de Jager, D.J. Bradshaw
0.2 Class A Class B Optimal Decision Boundary
0.18 0.16
Frequency
0.14 0.12 0.1 0.08 0.06 0.04 0.02 0 0
50
100
150
200
250
300
350
400
450
500
2
Mean Bubble Size [pixels ]
Figure 2. Examples of copper froth types
Figure 4. Mean bubble size distribution for two well separated froth classes 0.2 Class A Class B Optimal Decision Boundary
0.18 0.16
Frequency
0.14 0.12 0.1 0.08 0.06 0.04 0.02 0 0
Figure 3. A selection of platinum froth types other is of copper bearing froth. Each video clip in the set has duration of one minute and is taken under steady state conditions. These video clips have been manually subdivided into different froth types (the conditions mentioned in section 2.1), in a manner similar that a plant operator would use to evaluate the froth. Examples of these froth types are shown in Figures 2-3. Numerous examples of each froth type exist in the data set. 2.2 Single value descriptors A brief overview of the classification algorithms used for testing the bubble size measures follow. For further in depth technical details, the reader is referred to (Forbes and de Jager, 2005). The testing of the single value descriptors (mean, median and p80) of the bubble size of an image is done as follows. For each of the video clips, numerous multi-frame samples are drawn. The single value descriptor measurements are calculated for each sample. Since numerous samples are drawn from each
50
100
150
200
250
300
350
400
450
500
2
Mean Bubble Size [pixels ]
Figure 5. Mean bubble size distribution for two poorly separated froth classes video clip, it is possible to determine the distribution of the single value descriptor of interest. The effectiveness of the measure in question can be determined by looking at the amount of overlap between the distributions of the two froth types being compared. Examples of two such distributions are shown in Figures 4-5. It is important to note that the distributions are not always as well separated as shown in Figure 4. Often they show a high level of overlap for two froth types (Fig. 5). This is an indication that the measure used is inappropriate for distinguishing between the two froth types present. 2.3 Complex bubble size descriptors The reader is referred to (Forbes and de Jager, 2005)) for a more in depth discussion on the technical implementations of the following algorithms. A brief summary on how they work follows.
Page 3, G. R. Forbes, G. de Jager, D.J. Bradshaw
100
95
90
85
80
PCA Frequently occuring BSDs BSD search 1
2
5
10
25
Percentage correct classification
Percentage correct classification
100
95
90
85
80
50 100 200 400
PCA Frequently occuring BSDs BSD search 1
2
Number of frames per sample
Figure 6. Platinum froth classification performance
25
50 100 200 400
95
90 85 80 75 70
Mean 80% Passing Median
65 1
2
5
10
25
50 100 200 400
Percentage correct classification
Percentage correct classification
10
Figure 7. Copper froth classification performance
95
60
5
Number of frames per sample
Mean 80% Passing Median
90 85 80 75 70 65 60
1
2
Number of frames per sample
Figure 8. Platinum froth classification performance
The BSD Search algorithm scans through the cumulative BSDs of the two froth type in question to determine which bubble size is optimal for discriminating between the two froth types. Once this point has been found, classification is similar to that of the singular variable descriptors (Section 2.2). The frequently occurring BSDs algorithm searches through the training data to find a representative set of BSDs for the two froth types. New data is classified according to the frequency of occurrence of these representative BSDs for each of the froth types. The principal component analysis (PCA) algorithm represents the BSD as a fifty dimensional point. This is then reduced to a 3D point using principal component analysis. A K-nearest-neighbour classifier is then used to distinguish between the different froth types.
5
10
25
50 100 200 400
Number of frames per sample
Figure 9. Copper froth classification performance
3 RESULTS All of the results are the mean results for the measurements tested, usually over ten to twenty test runs consisting of thousands of samples for both training and testing data sets. The results of the classification of froth type for various bubble size measures are shown in Figures 6-9. It is important to note that the different plots have different scales on the y-axis. The single value descriptors have been split from the complex bubble size descriptors to make viewing clearer. It is also important to note that a classification rate of 50% correct corresponds to that of randomly assigning froth classes, and therefore is associated with very poor performance. 3.1 Platinum froths It is evident that the algorithms that make use of single value descriptors (mean, median and p80) perform
Page 4, G. R. Forbes, G. de Jager, D.J. Bradshaw
much worse (best performance of 91.8%) than the complex bubble size descriptors (worst performance of 92.8%). The increase in performance with the number of frames in the video sample is not significant after ten frames for the single value descriptors. The complex bubble size descriptors show a more consistent upwards trend with increasing number of frames per video sample. The principal component analysis algorithm shows a downward trend when a higher number of frames is used. More in depth analysis of this phenomenon shows that these results are highly biased by one of the six sets of froth classes. It is suspected that the reason for the decrease in performance is due to the large intra-class variance for these two froth classes, resulting in the principal components not being aligned with the inter-class variance as is desired. 3.2 Copper froths The difference in performance between the single value descriptors (best performance of 71.3%) and complex bubble descriptors (worst performance of 81.2%) is much larger for this set of copper froths than for platinum froths. The performance gap is greater than twenty percent for large numbers of frames per sample. Again, an increase in the number of frames processed results in a marked improvement in classification performance for the complex bubble size descriptors. In fact, the number of frames processed has a more significant effect on classification performance for copper froths (which have “dynamic BSDs) than for platinum froths. 4. DISCUSSION It is evident from the results that using complex bubble size descriptors results in much better classification performance. However, there is still the question of whether or not the performance gains are worth the additional computational complexity of these algorithms. In the case of the platinum froth, the performance gain from using additional frames per sample as well as the more complex descriptors is not particularly large. A more in depth investigation into the individual froth types being classified shows that the difference in classification performance is mainly due to the difficulty distinguishing between one of the six sets of froth types. If the difference between these froth types is not critical from an operational point of view, it makes sense to use a single value descriptor such as the p80. For copper froths, the situation is very different. All of the single value descriptors have performance
values of less than 70% (50% correct classification corresponds to random classification). This is largely due to the “dynamic” nature of the copper bubble size distribution. These dynamics are not well captured by a single value, as the amount of data reduction taking place is too extreme. As a result of this, the single value descriptors are almost meaningless as they fail to be able to distinguish between two visually different froth types (which is exactly what one wants from the measurement in the first place). In such a case, it is crucial to make use of the more complex bubble size descriptors. The duration of the sample taken is another engineering trade off. The larger the number of frames processed, the greater the classification performance. This is similar to most sampling procedures where a larger number of samples results in more confidence of the actual sample’s value. The down side of this is that it is often not appropriate to take samples of long duration, especially when the sample is used for closed loop control purposes. If the sample duration is too long, it is not always possible to respond in time to high frequency disturbances. It is for this reason that the maximum sample length used is 400 samples. This corresponds to a 16 second long sample (at 25 frames a second). It is important to note that the results shown here are for the specific copper and platinum froths under investigation. They should not be generalised for all copper and platinum froths. Experience has shown that platinum froths with “dynamic” bubble size distributions do exist and that copper froths which don’t have “dynamic” BSDs also exist. In fact it is important not to generalise the conditions found on one cell to the next cell in the same bank. When installing a machine vision system on a new site (or cell in an existing installation), a series of tests should be performed to ensure that the appropriate bubble size measure is being used. This is achieved by determining the range of bubble sizes present in the froth being monitored, which in turn is achieved by adjusting input set-points (air, level, reagents) to boundary regions of operation. Measurements of the entire bubble size distribution must be made for this selection of froth types. The discriminatory power of the possible single value descriptors (mean, p50, p80, etc.) can then be tested to determine if they are providing meaningful information. This simple test will help to ensure that the machine vision system is providing the controller/operator with useful information which can be used to improve the flotation performance of the plant. 5. CONCLUSIONS The following conclusions are drawn: a) Reducing bubble size distributions of flotation
Page 5, G. R. Forbes, G. de Jager, D.J. Bradshaw
froths to a single value is not always appropriate. This is particularly the case when the froth in question has a “dynamic” bubble size distribution. If this is the case, a complex bubble size descriptor such as frequently occurring BSDs is a much more informative bubble size measure. b) In order to achieve 95% correct classification, 100 frames of video are required for both platinum and copper froths when either the PCA or the frequently occurring BSDs measures are used. This corresponds to a sample duration of four seconds (for a 25 frame per second video stream). c) Single value descriptors perform worse than the complex bubble size descriptors. This is because they fail to take into account the information contained in the entire bubble size distribution. Principal component analysis and the frequently occurring bubble size distributions are the most successful measurements for classifying both copper and platinum froth types. The findings of this work apply to many other areas of mineral processing. The lesson to be learnt is that it is important not to make simplifying assumptions of data or measurements unless that assumption has been specifically tested on the data / instrument in question. If this is not done, it is likely that the assumptions (which may have been valid for a previous installation / instrument) are not applicable and the output has been rendered meaningless by an inappropriate simplification. It is recommended that further be undertaken to determine how bubble size distribution measurements are related to the metallurgical performance of the flotation cell being monitored. It is expected that the relationship will be a complex one, and it is most likely that there will be the need to incorporate additional machine vision measurements to obtain a good understanding of how machine vision measurements are related to the metallurgical performance of the flotation process. 6. ACKNOWLEDGEMENTS The authors would like to thank the following for their support and permission to publish: the National Research Foundation, the South African Department of Labour, Rio Tinto, Anglo Platinum and the UCT Department of Chemical Engineering. 7. REFERENCES Bartolacci, G., Pelletier, P., Tessier, J., Duchesne, C., Bossé, P.-A., Fournier, J., Application of Numerical Image Analysis to Process Diagnosis and Physical Parameter Measurement in Mineral Processes — Part I: Flotation Control Based on Froth
Textural Characteristics, Centenary of Flotation Symposium, Brisbane, Queensland, (2005) Bonifazi, G., Serrantia, S., Volpe, F., Zucob, R., Characterisation of flotation froth colour and structure by machine vision, Computers & Geosciences, 27, 1111-1117, (2001) Cipriano, A., Guarini, M., Vidal, R., Soto, A., Sepúlveda, C., Mery, D., Briseño, H., A real time visual sensor for supervision of flotation cells, Minerals Engineering, 11, 489 - 499, (1998) Forbes, G., de Jager, G., A Method Of Determining The Size Distribution of Bubbles in the Froth in a Froth Flotation Process, Adams & Adams Patent Attorneys,V16570. South Africa. (2004a) Forbes, G., de Jager, G., Texture Measures for Improved Watershed Segmentation of Froth Images, Fifteenth Annual Symposium of the Pattern Recognition Association of South Africa, Grabouw, (2004b) Forbes, G., de Jager, G., Bubble Size Distributions For Froth Classification, Sixteenth Annual Symposium of the Pattern Recognition Association of South Africa, Cape Town, (2005) Hatfield, D. P., Rapacz, B., Bradshaw, D. J., de Jager, G., Francis, J. J., The extraction of valuable minerals from mined ore, Adams & Adams Patent Attorneys,A&A REF: v16148. no. 2004/149. South Africa. (2004) Holtham, P. N., Nguyen, K. K., On-line analysis of froth surface in coal and mineral flotation using JKFrothCam, International Journal of Mineral Processing, 64, 163 - 180, (2002) Kaartinen, J., Hyötyniemi, H., Combining MultiCamera-Data of Flotation Circuit with PCA and PLS, Centenary of Flotation Symposium, Brisbane, Australia, (2005) Niemi, A. J., Ylinen, R., Hyotyniemi, H., On characterization of pulp and froth in cells of flotation plant, International Journal of Mineral Processing, 51, 51 - 65, (1997) Sweet, C., The Application of a machine vision system to relate to froth surface characteristics to the metallurgical performance of a PGM flotation process, MSc Thesis. University of Cape Town, (2000) Vathavooran, A., Batchelor, A., Miles, N. J., Kingman, S. W., Applying froth imaging techniques to assess fine coal dewatering behaviour, Twenty Second Annual International Pittsburgh Coal Conference, Pittsburgh, (2005) Wang, W., Bergholm, F., Yang, B., Froth delineation based on image classification, Minerals Engineering, 16, 1183-1192, (2003)
Page 6, G. R. Forbes, G. de Jager, D.J. Bradshaw