ORIGINAL CONTRIBUTION
Cost-effectiveness of Treatment for Chronic Hepatitis C Infection in an Evolving Patient Population Joshua A. Salomon, PhD Milton C. Weinstein, PhD James K. Hammitt, PhD Sue J. Goldie, MD, MPH
I
N THE U NITED S TATES , AN ESTI mated 2.7 million individuals are chronically infected with the hepatitis C virus (HCV)1 and are at risk for long-term sequelae, such as cirrhosis, decompensated liver disease, and hepatocellular carcinoma (HCC).2 Recently, rising interest in HCV infection from patient advocacy groups, public health advisory groups, the lay press, and affected individuals has been accompanied by a range of policy initiatives, such as a government lookback campaign launched in 1998 to notify people who had received blood from potentially infected donors and an open letter from the surgeon general in July 2000 warning the public about the “silent epidemic” and encouraging atrisk individuals to get tested.3-5 Individual clinical decisions about treatment for HCV infection are complicated by inconsistent progression,6,7 the lack of reliable prognostic information at the patient level,8 and the costs and adverse effects of therapy for HCV infection.9-11 Consensus guidelines for the management of hepatitis C remain ambivalent regarding the treatment of patients with persistent elevated levels of alanine aminotransferase but with no histological evidence of fibrosis.12 Asymptomatic patients who are HCV seroposi228
Context Approximately 2.7 million US individuals are chronically infected with the hepatitis C virus (HCV). As public health campaigns are pursued, a growing number of treatment candidates are likely to have minimal evidence of liver damage. Objective To examine the clinical benefits and cost-effectiveness of newer treatments for chronic hepatitis C infection in a population of asymptomatic, HCV seropositive but otherwise healthy individuals. Design and Setting Cost-effectiveness analysis using a Markov model of the natural history of HCV infection and impact of treatment. We used an epidemiologic model to derive a range of natural history parameters that were empirically calibrated to provide a good fit to observed data on both prevalence of HCV seropositivity and time trends in outcomes related to HCV infection. Patients Cohorts of 40-year-old men and women with elevated levels of alanine aminotransferase, positive results on quantitative HCV RNA assays and serologic tests for antibody to HCV, and no histological evidence of fibrosis on liver biopsy. Interventions Monotherapy with standard or pegylated interferon alfa-2b; combination therapy with standard or pegylated interferon plus ribavirin. Main Outcome Measures Lifetime costs, life expectancy, quality-adjusted lifeyears (QALYs), and incremental cost-effectiveness ratios. Results The probability of patients with chronic HCV developing cirrhosis over a 30-year period ranged from 13% to 46% for men and from 1% to 29% for women. The incremental cost-effectiveness of combination therapy with pegylated interferon for men ranged from $26 000 to $64 000 per QALY for genotype 1 and from $10 000 to $28 000 per QALY for other genotypes; and for women ranged from $32 000 to $90 000 for genotype 1 and from $12 000 to $42 000 for other genotypes. Because the benefits of treatment were realized largely in the form of improvements in health-related quality of life, rather than prolonged survivorship, costeffectiveness ratios expressed as dollars per year of life were substantially higher. Results were most sensitive to assumptions about the gains and decrements in health-related quality of life associated with treatment. Conclusions While newer treatment options for hepatitis C appear to be reasonably cost-effective on average, these results vary widely across different patient subgroups and depend critically on quality-of-life assumptions. As the pool of persons eligible for treatment for HCV infection expands to the more general population, it will be imperative for patients and their physicians to consider these assumptions in making individuallevel treatment decisions. www.jama.com
JAMA. 2003;290:228-237
Author Affiliations are listed at the end of this article. Corresponding Author and Reprints: Joshua A.
JAMA, July 9, 2003—Vol 290, No. 2 (Reprinted)
Salomon, PhD, Harvard Center for Population and Development Studies, 9 Bow St, Cambridge, MA 02138 (e-mail:
[email protected]).
©2003 American Medical Association. All rights reserved.
COST-EFFECTIVENESS OF TREATMENT FOR CHRONIC HEPATITIS C INFECTION
tive, but who are otherwise healthy, are likely to represent a growing segment of treatment candidates. Because this population also may be least likely to develop severe sequelae from HCV infection, it is worthwhile to consider the costs, benefits, and cost-effectiveness of HCV therapy in this expanded pool of patients. In a prior study, we developed a simulation model of the natural history of HCV infection that was used to estimate the rates of fibrosis progression in the population seropositive for HCV consistent with both clinical studies reported in the literature and observed epidemiologic data on the prevalence of HCV infection seroprevalence and mortality from primary liver cancer.13 A key finding from that study was that progression rates in this general population not only were lower and more uncertain than previously assumed, but also were heterogeneous in ways that were not explained by factors such as age and sex. Incorporating this heterogeneity in decision analytic models may have important implications for treatment decisions in an evolving patient population. A model that accounts for betweenpatient variability and uncertainty offers the opportunity to build on the findings of previous decision analytic studies14-30 as the decision context changes. Our objective in this study was to use this empirically calibrated natural history model to examine the costeffectiveness of the latest available treatments for HCV infection in patients with the mildest histological form of chronic hepatitis C. METHODS Analytic Overview
We developed a Markov model to simulate disease progression in treated and untreated cohorts of individuals who were seropositive for HCV to estimate the life expectancy, quality-adjusted life expectancy, and total lifetime costs associated with different treatment strategies for patients with chronic hepatitis C infection. Natural history parameter values in the model were derived from our previous empirical calibration study.13 The target population in the
analysis was a cohort of 40-year-old patients (stratified by sex) with elevated levels of alanine aminotransferase, positive results on quantitative HCV RNA assays and serologic tests for antibody to HCV, and no histological evidence of fibrosis on liver biopsy. The analyses were stratified by genotype to allow for substantial variation in response rates to treatment. Strategies for HCV infection included (1) no treatment; (2) monotherapy with interferon alfa-2b; (3) monotherapy with pegylated interferon alfa-2b; (4) combination therapy with interferon and ribavirin; and (5) combination therapy with pegylated interferon and ribavirin. To be consistent with current guidelines,12 we assumed that (1) monotherapy was administered for 48 weeks; (2) combination therapy was administered for 48 weeks in patients with HCV genotype 1 and 24 weeks in patients with all other HCV genotypes; and (3) treatment was discontinued in patients with detectable HCV RNA levels after either 12 weeks of receiving monotherapy or 24 weeks of receiving combination therapy. Following the recommendations of the US Panel on Cost-Effectiveness in Health and Medicine,31 we adopted a societal perspective (although we excluded patient-time costs) and discounted all costs and clinical consequences at a rate of 3% per year. The comparative efficiencies of alternative treatment strategies were measured by the incremental cost-effectiveness ratio, defined as the additional cost of a specific treatment strategy, divided by its additional health benefit, expressed as quality-adjusted life-years (QALYs) gained. The incremental ratio for a strategy was computed in reference to the next most effective option after eliminating strategies that were dominated (ie, more costly and less effective than other options) and strategies ruled out by extended (weak) dominance (ie, strategies having higher incremental costeffectiveness ratios than more effective options). We accounted for uncertainty around progression rates by using an array of natural history parameters that provided a good fit to observed epidemiologic data, 13 and we per-
©2003 American Medical Association. All rights reserved.
formed sensitivity analyses on costs, treatment efficacy, and health-related quality of life. Data on Progression of HCV Infection
Assessing the natural history of chronic infection with HCV has been difficult because acute infection is often asymptomatic, and the duration between infection and development of advanced stages of liver disease is typically long. Data from retrospective studies performed at tertiary referral centers2,32-37 have described relatively high rates of disease progression to cirrhosis, but these are subject to referral bias, since these centers attract individuals with already established chronic liver disease. Data from prospective studies38-48 have generally described much lower probabilities of severe liver disease. Both age and sex have been found to be powerful determinants of the rate of progression from chronic HCV infection to cirrhosis, with the lowest rates observed in women infected as young adults.2,43,47,49,50 Other factors aside from age and sex may produce unexplained heterogeneity in fibrosis progression. Alter and Seeff,8 in a synthesis of the available data on natural history, concluded that 30% to 70% of infected individuals may never progress to cirrhosis before dying from other causes. To define the natural history of HCV infection, we first developed an epidemiologic model of HCV infection in the US population, which included acquisition of infection, probability of persistence, and risks of progression to end-stage liver disease. The entire US population, stratified by age and sex, was represented in a set of mutually exclusive categories in the model defined in terms of status of serologic infection and of clinical liver disease. Early stages of liver disease were classified using the METAVIR scoring system, which characterizes the extent of fibrosis that results as damaged liver cells are repaired, including no fibrosis, portal fibrosis without septa, portal fibrosis with few septa, and numerous septa without cirrhosis.51 Advanced stages of liver disease were defined clinically as
(Reprinted) JAMA, July 9, 2003—Vol 290, No. 2 229
COST-EFFECTIVENESS OF TREATMENT FOR CHRONIC HEPATITIS C INFECTION
compensated cirrhosis, decompensated cirrhosis, and primary HCC. We specified plausible ranges for all model parameter values based on a systematic literature review. Because disease progression usually occurs over sev-
eral decades, the most critical parameters governing the natural history of HCV after acute infection are the age- and sexspecific rates of fibrosis progression and, to account for heterogeneity in this progression, an additional parameter dis-
Table 1. Ranges for Natural History Parameters in Empirically Calibrated Parameter Sets* Variable Annual rate per person† Remission‡ Fibrosis progression in men, age, y§ 40-49 50-59 60-69 ⱖ70 Fibrosis progression in women, age, y§ 40-49 50-59 60-69
Minimum
Mean
Maximum
0.007
0.012
0.017
0.027 0.073 0.125 0.152
0.054 0.125 0.221 0.301
0.095 0.161 0.349 0.478
0.013 0.028 0.042
0.028 0.065 0.114
0.058 0.116 0.236
0.081 0.085 0.032
0.154 0.210 0.040
0.278 0.355 0.052
0.017
0.021
0.028
0.129 0.319 0.096
0.306 0.433 0.242
0.395 0.499 0.741
70-79 ⱖ80 Cirrhosis to decompensated cirrhosis㛳 Cirrhosis to hepatocellular carcinoma Annual mortality rate per person† Decompensated cirrhosis¶ Hepatocellular carcinoma Proportion of patients who will not progress even if untreated
*Ranges were derived from a previous study that used empirical calibration of a natural history model of hepatitis C
virus (HCV) infection to identify progression rates consistent with epidemiologic data on HCV infection seroprevalence and liver cancer mortality.13 †Annual rates are converted into annual probabilities in the model. ‡Remission occurs from the no fibrosis state only. §States in the model are defined according to the METAVIR system. The fibrosis progression rate applies to transitions from each METAVIR state to the next, ie, progression from no fibrosis to portal fibrosis without septa, from no septa to few septa, and so on, including progression from numerous septa without cirrhosis to cirrhosis. 㛳Decompensated cirrhosis includes ascites, variceal hemorrhage, and hepatic encephalopathy as distinct health states in the Markov model. Values for progression to each sequela were derived by multiplying the overall rate of progression to decompensated cirrhosis by fixed proportions derived from the literature15,55: ascites, 62%; variceal hemorrhage, 28%; and hepatic encephalopathy, 10%. ¶Mortality rates for ascites, variceal hemorrhage, and hepatic encephalopathy were derived by multiplying the ratio of the aggregate mortality rate from decompensated cirrhosis in each parameter set to the mean of this aggregate rate across all sets, by the following state-specific mortality rates from the literature: ascites, 0.1115,56; variceal hemorrhage, 0.4 and 0.13 for first year and subsequent years, respectively15,57; hepatic encephalopathy, 0.68 and 0.40 for first year and subsequent years, respectively.15,58 For example, in one of the empirically calibrated parameter sets, which gave an overall mortality rate from decompensated cirrhosis of 0.349, we derived the mortality rate from ascites as (0.349)/(0.306) X (0.11) = 0.125.
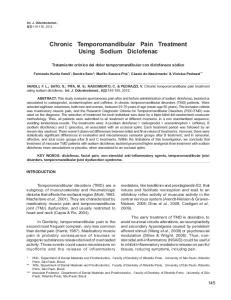
Figure 1. Schematic of the Model
No Fibrosis
Transition
Portal Fibrosis With No Septa
Portal Fibrosis With Few Septa
Primary Hepatocellular Carcinoma
Portal Fibrosis With Numerous Septa
Compensated Cirrhosis
Mortality Decompensated Cirrhosis Liver Transplant
Ascites Variceal Hemorrhage Encephalopathy
Each year patients can move between health states in the model according to defined transition rates. 230
JAMA, July 9, 2003—Vol 290, No. 2 (Reprinted)
tinguishing a proportion of individuals as nonprogressors (ie, exempt from risks of developing severe liver disease). Ranges of rates for fibrosis progression were extrapolated from intervention trials that included serial liver biopsy specimen results 5 2 , 5 3 and crosssectional studies that included the stage of fibrosis as it related to the duration of infection.49,54 Numerical simulations of the model were undertaken based on sampling jointly from all parameter ranges to examine the different outcomes implied by different sets of parameter values. For thousands of different sets of sampled parameter values, examined through a multistage fit procedure, modeled outcomes were compared with available epidemiologic data on prevalence of seropositivity of HCV and mortality due to HCC, and statistical measures of goodness-of-fit were computed. This procedure led to the identification of a subset of 50 parameter combinations that provided good fits to observed population trends (TABLE 1).13 Variation in the parameter values across this range of empirically calibrated sets reflects uncertainty with respect to progression from chronic HCV infection, within the constraints of providing a close match to empirical, population-based data. After identifying the array of different plausible parameter sets using the steps described above, we incorporated these parameter sets in a separate Markov model that simulated disease progression in a cohort of individuals with chronic HCV infection, under a variety of different treatment scenarios. Health states included histological stages defined in terms of METAVIR scores and long-term complications defined as compensated cirrhosis, decompensated cirrhosis (ascites, variceal hemorrhage, and hepatic encephalopathy), and primary HCC (FIGURE 1). Transition probabilities determined the movements of patients through different health states until all members of the cohort had died. Each year, patients faced probabilities of fibrosis progression, complications from cirrhosis, and competing mortality risks from decompensated cirrhosis, HCC,
©2003 American Medical Association. All rights reserved.
COST-EFFECTIVENESS OF TREATMENT FOR CHRONIC HEPATITIS C INFECTION
and other causes unrelated to HCV infection. Patients with decompensated cirrhosis could receive an orthotopic liver transplantation. The structure of the Markov model used in this decision analysis included a more detailed specification of the complications of cirrhosis than did the model used for empirical calibration to build on an existing body of cost-effectiveness work,15,17,21-24,26-28 including published data pertaining to the annual costs of care for specific states of ascites, variceal hemorrhage, and hepatic encephalopathy.15 Values for the additional parameters demanded by the more detailed structure were derived from the empirically calibrated parameters listed in Table 1, combined with other estimates from the literature. Specifically, rates of progression from compensated cirrhosis to states of ascites, variceal hemorrhage, and hepatic encephalopathy were computed by multiplying the overall rate of progression to decompensated cirrhosis in each empirically calibrated parameter set by the proportionate frequencies of each complication reported by other investigators (62% for ascites, 28% for variceal hemorrhage, and 10% for hepatic encephalopathy).15,55 Mortality rates for the different decompensated states were computed for each empirically calibrated parameter set by multiplying the aggregate mortality rate for decompensated cirrhosis in each set, relative to the mean value across all sets, by estimates of state-specific annual mortality rates from the literature: 11% for ascites15,56; 40% and 13% for variceal hemorrhage in the first and subsequent years15,57; and 68% and 40% for hepatic encephalopathy in the first and subsequent years.15,58 Other Clinical Data
Estimates for treatment efficacy were based on pooled results of randomized controlled trials (TABLE 2).9,59-62 Based on accumulated evidence of a strong link between virological and histological end points,52,53,63-68 the principal end point of interest in most studies has been clearance of HCV RNA, referred to as a virological response, measured both at the completion of treatment (end-of-
treatment response) and at 6 months after treatment completion (sustained response). The following assumptions were made in the base case: (1) chronic
HCV infection may resolve spontaneously or through successful treatment, in either case implying clearance of HCV RNA; (2) spontaneous resolution oc-
Table 2. Baseline Values and Ranges for Model Variables Variable Treatment response probability9,59-62 Genotype 1 Interferon monotherapy Pegylated interferon monotherapy Interferon and ribavirin Pegylated interferon and ribavirin Other genotypes Interferon monotherapy Pegylated interferon monotherapy Interferon and ribavirin Pegylated interferon and ribavirin Treatment mortality probability11 Liver transplant probability15 Treatment costs, 2001 US $21,69*† Genotype 1 Interferon monotherapy Pegylated interferon monotherapy Interferon and ribavirin Pegylated interferon and ribavirin Other genotypes Interferon monotherapy Pegylated interferon monotherapy Interferon and ribavirin Pegylated interferon and ribavirin Costs of annual care, 2001 US $15† Chronic HCV Compensated cirrhosis Ascites Variceal hemorrhage, first year Variceal hemorrhage, subsequent Hepatic encephalopathy, first year Hepatic encephalopathy, subsequent Hepatocellular carcinoma Liver transplant, first year Liver transplant, subsequent Health-related quality-of-life weights17‡ Mild chronic HCV§ Moderate chronic HCV§ Compensated cirrhosis Ascites Variceal hemorrhage Hepatic encephalopathy Hepatocellular carcinoma Liver transplant
Baseline Value
0.06 0.15 0.31 0.42 0.26 0.47 0.67 0.79 0.0005 0.031
Range
0.05-0.08 0.12-0.18 0.28-0.34 0.38-0.46 0.22-0.29 0.41-0.53 0.61-0.72 0.74-0.84 0.00025-0.00075 0.016-0.047
2145 5238 12 743 18 507
1073-3218 2619-7857 6372-19 115 9254-27 761
3442 9203 9574 12 632
1721-5163 4602-13 805 4787-14 361 6316-18 948
123 895 3765 20 822 4075 13 365 3096 35 917 118 285 20 657
62-185 448-1343 1883-5648 10 411-31 233 2038-6113 6683-20 048 1548-4644 17 959-53 876 59 143-177 428 10 329-30 986
0.98 0.92 0.82 0.65 0.55 0.53 0.55 0.86
0.92-1.00 0.72-1.00 0.46-1.00 0.35-1.00 0.23-0.87 0.19-0.87 0.15-0.95 0.66-1.00
Abbreviation: HCV, hepatitis C virus. *Costs for interferon monotherapy and combination therapy do not include pretreatment costs because the target population includes patients whose serologic and histological statuses have already been identified. †All costs have been adjusted to 2001 US dollars using the medical care component of the consumer price index. ‡Weights were derived from a panel of hepatologists17 and were assumed to be independent of other comorbidities. The quality-of-life weight for a given age, sex, and HCV infection state was computed as the product of the weight associated with an HCV infection–specific health state and a mean age-specific and sex-specific quality weight obtained from published data.77 In one-way sensitivity analyses, we truncated the ranges reported here to preserve the ordinal nature of the weights (ie, moderate chronic hepatitis C is presumed to be at least as severe as mild chronic hepatitis C). §The health-related quality-of-life weight for mild chronic hepatitis C is applied to no fibrosis and portal fibrosis without septa, and the weight for moderate chronic hepatitis C is applied to portal fibrosis with few septa and portal fibrosis with numerous septa but without cirrhosis.
©2003 American Medical Association. All rights reserved.
(Reprinted) JAMA, July 9, 2003—Vol 290, No. 2 231
COST-EFFECTIVENESS OF TREATMENT FOR CHRONIC HEPATITIS C INFECTION
curs only in individuals without evidence of fibrosis; (3) patients with sustained response to treatment do not experience subsequent histological progression of fibrosis; and (4) patients who do not have sustained treatment response receive no further treatment. Our analysis has several challenges relating to the inclusion of health-related quality of life. First, health-related quality weights specific to each histological stage of liver disease are not available. Second, the impact of treatment on health-related quality of life, especially for patients with mild chronic HCV infection, is uncertain. Third, the magnitude of short- and long-term decrements in quality of life associated with
adverse and toxic effects of treatment has not been empirically quantified. For the base case analysis, we applied previously published quality weights to each health state (Table 2)17 and made the following assumptions: (1) a sustained virological response to treatment eliminates all decrements in health-related quality of life associated with living in the mild chronic HCV infection state; (2) mild and moderate adverse effects of treatment reduce quality of life by 2% during the duration of therapy, as specified in a previous study17; and (3) the consequences of severe adverse effects of treatment are captured as a small mortality risk. We evaluated alternative assumptions in sensitivity analyses.
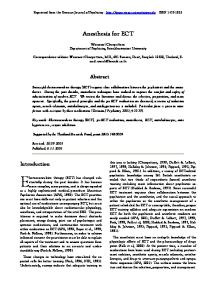
Figure 2. Comparison of Alternative Models for Progression of Chronic Hepatitis C Virus (CHCV) Infection Previous Studies A Progression From CHCV Infection to Cirrhosis16,18
B Progression From Mild or Moderate CHCV Infection to Cirrhosis15,17,21-30 1.0
0.9
Cumulative Probability of Cirrhosis
Cumulative Probability of Cirrhosis
1.0 Reference 18
0.8 0.7 0.6 0.5 Reference 16
0.4 0.3 0.2 0.1
0.9 0.8 0.7
Progression From Moderate CHCV Infection
0.6 0.5 0.4 0.3 0.2
Progression From Mild CHCV Infection
0.1
0 5
10
15
20
25
30
0
5
10
Time, y
15
20
25
30
Time, y
D Progression From Evidence of Portal Fibrosis With Few Septa to Cirrhosis
C Progression From No Evidence of Fibrosis to Cirrhosis 1.0
Cumulative Probability of Cirrhosis
1.0 0.9 0.8 0.7
Both Sexes Men Women
0.6 0.5 0.4 0.3 0.2 0.1 0
0.9 0.8 0.7 0.6 0.5 0.4 0.3 0.2 0.1 0
0
5
10
15
20
25
30
Time, y
0
5
10
15
20
25
30
Time, y
Panels A and B show the cumulative probability of cirrhosis based on progression rates from previous studies. Panels C and D show the cumulative probability of cirrhosis based on the age- and sex-specific rates of fibrosis progression in our study, starting from no fibrosis (panel C) and from portal fibrosis with few septa (panel D). JAMA, July 9, 2003—Vol 290, No. 2 (Reprinted)
RESULTS Base Case
Current Study
Cumulative Probability of Cirrhosis
Annual costs for patients in each of the clinical states in the model were derived from a published study that included detailed estimates of resource utilization, including hospitalizations, outpatient visits, laboratory tests and medications, and interventions (Table 2).15 Treatment costs were based on mean wholesale drug costs,69 combined with previously published cost estimates for clinic visits, laboratory tests, and the treatment of adverse events.21 The costs of therapy accounted for the discontinuation of treatment in patients who did not experience a virological response after receiving 12 weeks of monotherapy or receiving 24 weeks of combination therapy, and also in patients who experienced moderate-tosevere adverse events.21 The costs of time spent receiving medical care have not been included in the model, although they were assumed to be small relative to the costs of medications and treatment interventions. The ranges used for cost estimates are consistent with the costs reported in other studies of treatment for HCV infection16,18 as well as studies of interventions for more severe states of liver disease, such as variceal hemorrhage.70-72 In a sensitivity analysis, we examined ranges spanning from 50% to 150% of the base case costs.
0 0
232
Cost Data
Across the array of empirically calibrated natural history parameter sets, the probability of patients infected with HCV developing cirrhosis over a 30-year period ranged from 13% to 46% for men and from 1% to 29% for women, with mean probabilities of 30% and 9%, respectively. To facilitate comparisons with previous studies, which have used models that differed in structure, starting points for the analyses and progression rates, FIGURE 2 presents the corresponding 30-year cumulative probabilities of developing cirrhosis implied by the models in other decision analyses, derived under the same assumptions of competing mortality risks as those used in the present study. For the target popu-
©2003 American Medical Association. All rights reserved.
COST-EFFECTIVENESS OF TREATMENT FOR CHRONIC HEPATITIS C INFECTION
with pegylated interferon, which provided an additional 1.7 months of quality-adjusted life expectancy and cost $36000 per QALY gained for men with genotype 1 and an additional 1.8 months of quality-adjusted life expectancy at a cost of $15000 per QALY gained for men with all other genotypes, compared with combination therapy with standard interferon. The rank order of treatment strategies was the same in women, but the incremental cost-effectiveness ratios were approximately 50% higher, irrespective of genotype. For example, the cost-effectiveness ratios per QALY gained for women receiving combination therapy with pegylated interferon vs standard interferon were $55000 for
genotype 1 and $24 000 for all other genotypes. The mean results for all parameter sets mask important differences that appear across the array of empirically calibrated parameters. Among men, combination therapy with pegylated interferon had incremental cost-effectiveness ratios that ranged from $26 000 to $64000 per QALY gained for genotype 1 and $10000 to $28000 per QALY for all other genotypes. Among women, the incremental cost-effectiveness ratios for combination therapy with pegylated interferon ranged from $32000 to $90000 per QALY gained for genotype 1 and from $12 000 to $42 000 per QALY gained for all other genotypes. In both
Table 3. Costs, Quality-Adjusted Life Expectancy, and Incremental Cost-effectiveness Ratios, Averaged Across 50 Empirically Calibrated Parameter Sets, All Genotypes, and Both Sexes* Strategy No treatment Interferon Pegylated interferon Interferon and ribavirin Pegylated interferon and ribavirin
Cost, US $ 8200 10 200 13 300 17 700 22 000
QALE, y 18.85 18.94 19.09 19.28 19.40
Incremental Cost/QALY, US $ 0 † 21 000 24 000 35 000
Abbreviations: QALE, quality-adjusted life expectancy; QALY, quality-adjusted life-year. *Incremental cost-effectiveness ratios were derived by first averaging costs and QALE across the 50 parameter sets and then computing incremental ratios from these averages.78 †Interferon monotherapy was weakly dominated by pegylated interferon; that is, it had a lower effectiveness but higher cost-effectiveness ratio than pegylated interferon.
Figure 3. Cost-effectiveness of 5 Strategies by Sex and Genotype Cost-Effectiveness Result
Genotype
Nondominated Dominated
Treatment Strategy
Non-Type 1 Type 1
N I P R
Men
No Treatment Interferon Pegylated Interferon Ribavirin
Women
20.5
Quality-Adjusted Life Expectancy, y
lation in our study (ie, seropositive patients with no evidence of fibrosis), our model produces an overall 30-year probability of cirrhosis that is, on average, 53% to 77% lower than in previous analyses that have targeted patients with more advanced liver disease. If we considered a target population starting with more advanced disease, the 30-year probability of cirrhosis projected with our model would appear similar to those from previous studies, although the rise over time would begin more slowly (Figure 2D). The costs, benefits, and incremental cost-effectiveness of treatment strategies are reported in TABLE 3 for all genotypes and both sexes combined, averaged across the different sets of progression parameters. The incremental costs for each strategy ranged from $2000 to $4000, with incremental gains in life expectancy ranging from 1 to 2 months. Interferon therapy was weakly dominated by pegylated interferon therapy, and the incremental costeffectiveness ratios of the combination strategies were between $24 000 and $35000 per QALY gained. The results stratified by sex and genotype showed substantial differences (FIGURE 3). The mean quality-adjusted life expectancy gains per person for the different therapeutic regimens compared with that for no treatment were considerably higher for patients with genotypes other than genotype 1 because of higher response rates, and costs were lower because of shorter treatment durations. In men, the mean quality-adjusted life expectancy gains per person for treatment compared with no treatment ranged from 0.6 months (for monotherapy with interferon) to 6.0 months (for combination therapy with pegylated interferon) for patients with genotype 1, and from 2.8 months to 11.6 months for patients with all other genotypes. The comparable qualityadjusted life expectancy gains in women were smaller (0.3-4.0 months for genotype 1 and 1.8-7.9 months for all other genotypes), reflecting lower risks of progression to cirrhosis. The most effective strategy was combination therapy
P+R I+R P
20.0 I
P+R I+R
19.5
N
I
P
P+R I+R
19.0 P P+R I
18.5 N
18.0 5000
I
10 000
I+R P
15 000
20 000
Total Costs, 2001 $
25 000
30 000
5000
10 000
15 000
20 000
25 000
30 000
Total Costs, 2001 $
In each graph, the lower line shows results for patients with genotype 1, while the upper line shows results for patients with other genotypes. The inverse slope of each line connecting 2 adjacent strategies represents the incremental cost-effectiveness ratio. Strategies that are dominated by others fall below the lines connecting nondominated strategies.
©2003 American Medical Association. All rights reserved.
(Reprinted) JAMA, July 9, 2003—Vol 290, No. 2 233
COST-EFFECTIVENESS OF TREATMENT FOR CHRONIC HEPATITIS C INFECTION
Table 4. Incremental Costs Per Life-Year and Quality-Adjusted Life-Year (QALY) Saved for Combination Therapy With Pegylated Compared With Standard Interferon*
Patient Men Genotype 1 Other genotypes Women Genotype 1 Other genotypes
Cost Per Life-Year, US $
Cost Per QALY, US $
91 000 37 000
36 000 15 000
218 000 87 000
55 000 24 000
*Incremental cost-effectiveness ratios were derived by first averaging costs and quality-adjusted life expectancy across the 50 empirically calibrated parameter sets and then computing incremental ratios from these means.78
men and women, strategies based on monotherapy with either pegylated or standard interferon were dominated in all sets of empirically calibrated parameters for patients with genotypes other than genotype 1, while only monotherapy with standard interferon was dominated for patients with genotype 1. Because a minority of our target population would progress to severe liver disease even in the absence of therapy, the benefits of treatment would be attributable largely to improvements in quality of life. For example, averaging across the range of empirical parameter sets, approximately 60% to 75% of the total benefits of the most effective treatment strategy compared with no treatment would be realized in terms of health-related quality of life, rather than survivorship, gains. The predominance of benefits from reductions in nonfatal health outcomes translates into substantial differences between cost-effectiveness ratios expressed as costs per life-year vs costs per QALY (TABLE 4). For example, for men with genotype 1, combination therapy with pegylated interferon had a ratio of $91000 per unadjusted life-year as opposed to a ratio of $36000 per QALY. Sensitivity Analysis
The results were insensitive to variation in the annual costs of managing chronic hepatitis C or its complications, and relatively insensitive to assumptions about the efficacy of different treatment regimens. If costs of a specific treatment regimen for HCV infection were to vary 234
within a range of±50%, the given strategy typically would dominate or be dominated by adjacent strategies at the extreme values of the ranges. Results were sensitive to the discount rate used; with no discounting, the incremental costeffectiveness of all treatment strategies were lower than in the base case (discount rate of 3%) by approximately 60% to 80%, and with a discount rate of 5%, the ratios for all strategies were higher by approximately 70% to 150%. Results were highly sensitive to plausible alternative assumptions about the impact of chronic HCV infection and treatment on quality of life. For example, in the base case we assumed that patients with mild HCV infection who experienced viral clearance returned to a quality of life comparable with that of persons of similar age and sex without HCV infection. At the opposite extreme, if we assumed that treatment offered no immediate quality-of-life improvements in patients with mild HCV infection, the incremental costeffectiveness ratio of combination therapy with pegylated interferon vs standard interferon increased by approximately 45% for men and 85% to 90% for women. Results of this sensitivity analysis were magnified in women because with their lower rates of progression to advanced liver disease, the benefits of treatment depend more on any immediate quality-of-life gains associated with resolution of HCV infection. Results also were sensitive to alternative assumptions about the decrements in quality of life (ie, disutility) associated with treatment. If adverse effects reduced quality of life during treatment by 50%, as found in a recent study using rating scale responses from both patients and their physicians,73 the only nondominated treatment strategy in men with genotype 1 would be combination therapy with pegylated interferon ($652 000 per QALY gained), and all treatment strategies would be dominated by the no-treatment strategy in women with genotype 1. With a treatment disutility of 25%, the incremental cost-effectiveness of combination therapy with pegylated interferon com-
JAMA, July 9, 2003—Vol 290, No. 2 (Reprinted)
pared with no treatment for patients with genotype 1 (all other treatment strategies would be dominated) would be approximately $57000 per QALY in men and $158 000 per QALY in women. When we simultaneously considered alternative assumptions about qualityof-life benefits associated with viral clearance and disutility associated with treatment, even modest changes in our base case assumptions substantially increased the cost-effectiveness ratios associated with treatment. For example, if successful treatment eliminated half of the quality-of-life decrement for mild HCV infection, and treatment was associated with a disutility of 25%, all treatments would be dominated except combination therapy with pegylated interferon, with an incremental cost-effectiveness of $82000 per QALY for men and $742000 per QALY for women with genotype 1, compared with no treatment. COMMENT In this study, we conducted a decision analysis of treatment for chronic HCV infection that included natural history parameters calibrated to be consistent with both available clinical data on progression of HCV infection and epidemiologic data on prevalence of HCV seropositivity and mortality from liver cancer in the population. Focusing on patients with the mildest histological form of chronic HCV infection, we found that accounting for heterogeneity in disease progression can reveal substantial differences in the benefits of treatment in different population strata. Across the array of empirically calibrated natural history parameter sets, the probability of developing cirrhosis during a 30-year period was between 13% and 46% for men and between 1% and 29% for women. Results on the costs, benefits, and cost-effectiveness of treatment varied widely across the range of different sets of empirical parameter values. Recently, results from a number of longer follow-up studies have suggested that progression rates to cirrhosis and its complications may vary considerably across different segments of the HCV-infected population, and may be
©2003 American Medical Association. All rights reserved.
COST-EFFECTIVENESS OF TREATMENT FOR CHRONIC HEPATITIS C INFECTION
substantially lower among those infected at relatively young ages than previously assumed.46-48 As more aggressive efforts to identify infected individuals proceed, we may expect a shift over time in the composition of the patient population toward those with lower probabilities of disease progression. To accommodate the new information and evolving decision context, our analysis departs from previous analyses in 4 ways: (1) we empirically calibrated model parameters to reflect all available data
regarding the natural history of HCV infection in the general population of infected persons; (2) we accounted for variability and heterogeneity in disease progression by allowing rates to depend on age and sex and also allowing for nonprogression in a proportion of patients; (3) we used ranges of parameter values that were wider than those explored previously in sensitivity analyses; and (4) we focused on a population of asymptomatic patients who are HCV seropositive but who are otherwise healthy.
Factors such as age and sex appear to be important sources of variation in rates of disease progression, which may have important implications for decisions regarding treatment for chronic HCV infection. Based on our analyses, treatment for women may offer substantially lower benefits than treatment for men because women have a much lower probability of progressing to cirrhosis and liver failure. With smaller likelihoods of developing end-stage liver disease even in the absence of treatment, the ex-
Table 5. Selected Results on the Cost-effectiveness of Treatment for Chronic Hepatitis C Virus (CHCV) Compared With No Treatment* Interferon Monotherapy Compared With No Treatment Study Dusheiko et al,14 1995 Bennett et al,15 1997 Kim et al,16 1997
Wong et al,17 1998
Younossi et al,18 1999 Shiell et al,20 1999 Sagmeister et al,26 2001
Sennfält et al,27 2001
Stein et al,28 2002
Wong et al,29 2002 Current study
Summary of Target Population 25 to 35 years old, CHCV infection, United Kingdom 35 years old, mild CHCV infection, United States 40 years old, CHCV infection, United States 40 years old (mean), mild/moderate CHCV infection or cirrhosis, United States 45 years old, male, CHCV infection, United States 40 years old, CHCV infection, Australia 42 years old (mean), mild/moderate CHCV infection, genotype 1, Switzerland 42 years old, mild/moderate CHCV infection or cirrhosis, genotype 1, Sweden Mild/moderate CHCV infection, United Kingdom 43 to 44 years old (mean), CHCV infection, Belgium 40 years old, CHCV infection, no fibrosis, genotype 1, United States
30-Year Cirrhosis Probability, %†
QALYs Gained
Incremental Cost/ QALY Gained
Combination Therapy (Interferon and Ribavirin) Compared With No Treatment QALYs Gained
Incremental Cost/ QALY Gained
25 (low) 45 (high)
Not reported
$643-842
Not reported
Not reported
41
0.83
$1900
Not reported
Not reported
58
0.25
$4000
Not reported
Not reported
41 (mild) 85 (moderate)
0.30
$2233
Not reported
Not reported
85
0.95
Cost saving
2.79
Cost saving
27
0.32
$4401
Not reported
Not reported
41 (mild) 85 (moderate)
0.37
$4579
1.12
$6128
41 (mild) 85 (moderate)
Not reported
Not reported
1.10
$5900
41 (mild) 85 (moderate)
Not reported
Not reported
1.06
$6129
41 (mild) 85 (moderate)
Not reported
Not reported
1.54
$786
30 (men) 9 (women)
0.047 (men) and 0.023 (women)
$36 300 (men) and $83 600 (women)
0.361 (men) and 0.238 (women)
$29 300 (men) and $48 800 (women)
Abbreviation: QALY, quality-adjusted life-year. *Some figures have been estimated indirectly to enhance comparability between studies, for example, those for which discounted benefits were not reported. Costs were converted to US dollars, where necessary, using official exchange rates. Details available from authors. †Studies have used different classifications to model progression from CHCV infection to cirrhosis: (1) direct progression from CHCV to cirrhosis14,16,18,20; (2) progression from mild to moderate CHCV, then cirrhosis15,17,26-29; and (3) progression through METAVIR stages of fibrosis.
©2003 American Medical Association. All rights reserved.
(Reprinted) JAMA, July 9, 2003—Vol 290, No. 2 235
COST-EFFECTIVENESS OF TREATMENT FOR CHRONIC HEPATITIS C INFECTION
pected benefits of therapy would be realized largely in the form of improvements in health-related quality of life rather than survivorship outcomes. Information about the smaller magnitude of the clinical benefits may be helpful for individual women and their clinicians as they weigh the risks and benefits of currently available treatment options. Aside from age and sex, factors that have not yet been identified may eventually help to narrow the focus of treatment on those who are most likely to progress to chronic liver disease. Recent assessments of the growing literature on the natural history of HCV infection suggest that a sizeable proportion of individuals infected with HCV may never progress from chronic infection to cirrhosis before they succumb to other causes.8,74 While age, sex, and other identifiable factors explain some of this variation, other sources of heterogeneity remain poorly understood. The results of sensitivity analyses indicate that better information is needed about the quality of life associated with chronic liver disease, and in particular about the quality weights associated with the mildest histological states and the decrements in quality of life associated with treatment. Results were sensitive to certain key assumptions relating to the quality adjustment of years lived in the model. Developing a better understanding of the spectrum of nonfatal health outcomes for patients with chronic infection and how they change with treatment remains a critical challenge in assessing the costeffectiveness of therapy. Our study has several limitations. It does not address the possibilities of retreating patients who relapse or pursuing more aggressive treatment for nonresponders. Given the incomplete rates of sustained response to available regimens, important clinical decisions pertaining to nonresponders or relapsers are beyond the scope of our analysis. Other important issues regarding treatment of chronic HCV infection in injection drug users,75 or in patients coinfected with human immunodeficiency virus,76 are not consid236
ered in this article. Furthermore, this study is not intended to inform clinical decisions about management of patients with advanced liver disease. In anticipation of an increasing number of patients with asymptomatic, histologically mild disease, we chose to focus on patients with no fibrosis rather than considering a mixture of patients with various different stages of fibrosis. Placing the results of this study within the context of previous analyses is challenging because studies have differed as the range of available treatment options has broadened, new evidence on natural history has emerged, and the target population has changed. Direct comparison is hampered somewhat by variation in the methodologies and reporting in different studies, but inferences regarding broad patterns of differences are possible from a range of studies that have evaluated one or more common interventions. TABLE 5 presents a comparison between the incremental benefits and cost-effectiveness of interferon monotherapy or combination therapy with interferon and ribavirin in selected previous analyses and our study. The empirically calibrated natural history parameters used in our study, applied to a general population of seropositive patients without fibrosis, produced lower benefits and higher costeffectiveness ratios than those found previously, with the differences ranging up to a factor of more than 40 in some cases. For large numbers of US individuals who are infected with HCV but are not yet aware of these infections, the recent emphasis on testing and treating individuals with chronic HCV infection may lead to difficult decisions involving tradeoffs between, on the one hand, uncertain benefits and, on the other hand, considerable costs and risks associated with treatment. Policy makers must be mindful of the implications that public health campaigns targeted at HCV infection will have for the individual clinical decisions that follow. While we found that newer treatment options for HCV infection appear on average to be rea-
JAMA, July 9, 2003—Vol 290, No. 2 (Reprinted)
sonably cost-effective, these results depend critically on assumptions about the quality of life associated with mild HCV infection and treatment, and vary widely across different patient subgroups. Author Affiliations: Harvard Center for Population and Development Studies, Cambridge, Mass, and Global Programme on Evidence for Health Policy, World Health Organization, Geneva Switzerland (Dr Salomon); Center for Risk Analysis, Harvard School of Public Health, Boston, Mass (Drs Salomon, Weinstein, Hammitt, and Goldie). Author Contributions: Study concept and design: Salomon, Weinstein, Hammitt, Goldie. Acquisition of data: Salomon, Goldie. Analysis and interpretation of data: Salomon, Weinstein, Hammitt, Goldie. Drafting of the manuscript: Salomon, Goldie. Critical revision of the manuscript for important intellectual content: Salomon, Hammitt, Weinstein, Goldie. Statistical expertise: Salomon, Weinstein, Hammitt, Goldie. Administrative, technical, or material support: Goldie. Study supervision: Weinstein, Hammitt, Goldie. Funding/Support: This study was supported in part by grant ST32HS00055-03 from the former Agency for Health Care Policy and Research. Acknowledgment: We gratefully acknowledge helpful discussions with Dr Grace Lee, Dr Christopher Murray, and Dr Karen Kuntz. REFERENCES 1. Alter MJ, Kruszon-Moran D, Nainan OV, et al. The prevalence of hepatitis C virus infection in the United States, 1988 through 1994. N Engl J Med. 1999;341: 556-562. 2. Tong MJ, el Farra NS, Reikes AR, Co RL. Clinical outcomes after transfusion-associated hepatitis C. N Engl J Med. 1995;332:1463-1466. 3. US Department of Health and Human Services. Hepatitis C: an emerging threat to public health (HHS Fact Sheet). Washington, DC: US Dept of Health and Human Services, 2001. 4. Satcher D. Letter from the Surgeon General. Office of the Surgeon General (Rockville, MD). Available at: http://www.surgeongeneral.gov/topics/hepatitisc /letter.htm. Accessed October 6, 2001. 5. Centers for Disease Control and Prevention. Prevention and control of infections with hepatitis viruses in correctional settings. MMWR Morb Mortal Wkly Rep. 2003;52(RR-1):1-36. 6. Seeff LB. Natural history of hepatitis C. Am J Med. 1999;107:10S-15S. 7. Dore GJ, Freeman AJ, Law M, Kaldor JM. Is severe liver disease a common outcome for people with chronic hepatitis C? J Gastroenterol Hepatol. 2002; 17:423-430. 8. Alter HJ, Seeff LB. Recovery, persistence, and sequelae in hepatitis C virus infection. Semin Liver Dis. 2000;20:17-35. 9. McHutchison JG, Gordon SC, Schiff ER, et al. Interferon alfa-2b alone or in combination with ribavirin as initial treatment for chronic hepatitis C. N Engl J Med. 1998;339:1485-1492. 10. Dusheiko G. Side effects of alpha interferon in chronic hepatitis C. Hepatology. 1997;26(3 suppl 1): 112S-121S. 11. Fattovich G, Giustina G, Favarato S, Ruol A. A survey of adverse events in 11,241 patients with chronic viral hepatitis treated with alfa interferon. J Hepatol. 1996;24:38-47. 12. National Institutes of Health Consensus Development Conference Statement: management of hepatitis C: 2002—June 10-12, 2002. Hepatology. 2002; 36(5 suppl 1):S3-S20. 13. Salomon JA, Weinstein MC, Hammitt JK, Goldie
©2003 American Medical Association. All rights reserved.
COST-EFFECTIVENESS OF TREATMENT FOR CHRONIC HEPATITIS C INFECTION SJ. Empirically-calibrated model of hepatitis C virus infection in the United States. Am J Epidemiol. 2002; 156:761-773. 14. Dusheiko GM, Roberts JA. Treatment of chronic type B and C hepatitis with interferon alfa: an economic appraisal. Hepatology. 1995;22:1863-1873. 15. Bennett WG, Inoue Y, Beck JR, et al. Estimates of the cost-effectiveness of a single course of interferonalpha 2b in patients with histologically mild chronic hepatitis C. Ann Intern Med. 1997;127:855-865. 16. Kim WR, Poterucha JJ, Hermans JE, et al. Costeffectiveness of 6 and 12 months of interferon-alpha therapy for chronic hepatitis C. Ann Intern Med. 1997; 127:866-874. 17. Wong JB, Bennett WG, Koff RS, Pauker SG. Pretreatment evaluation of chronic hepatitis C: risks, benefits, and costs. JAMA. 1998;280:2088-2093. 18. Younossi ZM, Singer ME, McHutchison JG, Shermock KM. Cost effectiveness of interferon alpha2b combined with ribavirin for the treatment of chronic hepatitis C. Hepatology. 1999;30:1318-1324. 19. Wong JB. Cost-effectiveness of treatments for chronic hepatitis C. Am J Med. 1999;107:74S-78S. 20. Shiell A, Brown S, Farrell GC. Hepatitis C: an economic evaluation of extended treatment with interferon. Med J Aust. 1999;171:189-193. 21. Wong JB, Poynard T, Ling MH, Albrecht JK, Pauker SG. Cost-effectiveness of 24 or 48 weeks of interferon alpha-2b alone or with ribavirin as initial treatment of chronic hepatitis C. Am J Gastroenterol. 2000;95:15241530. 22. Wong JB, Koff RS. Watchful waiting with periodic liver biopsy versus immediate empirical therapy for histologically mild chronic hepatitis C. Ann Intern Med. 2000;133:665-675. 23. Wong JB, Davis GL, Pauker SG. Cost effectiveness of ribavirin/interferon alfa-2b after interferon relapse in chronic hepatitis C. Am J Med. 2000;108:366-373. 24. Buti M, Casado MA, Fosbrook L, Wong JB, Esteban R. Cost-effectiveness of combination therapy for naive patients with chronic hepatitis C. J Hepatol. 2000; 33:651-658. 25. Sinha M, Das A. Cost effectiveness analysis of different strategies of management of chronic hepatitis C infection in children. Pediatr Infect Dis J. 2000;19: 23-30. 26. Sagmeister M, Wong JB, Mullhaupt B, Renner EL. A pragmatic and cost-effective strategy of a combination therapy of interferon alpha-2b and ribavirin for the treatment of chronic hepatitis C. Eur J Gastroenterol Hepatol. 2001;13:483-488. 27. Sennfalt K, Reichard O, Hultkrantz R, Wong JB, Jonsson D. Cost-effectiveness of interferon alfa-2b with and without ribavirin as therapy for chronic hepatitis C in Sweden. Scand J Gastroenterol. 2001;36:870-876. 28. Stein K, Rosenberg W, Wong J. Cost effectiveness of combination therapy for hepatitis C: a decision analytic model. Gut. 2002;50:253-258. 29. Wong JB, Nevens F. Cost-effectiveness of peginterferon alfa-2b plus ribavirin compared to interferon alfa-2b plus ribavirin as initial treatment of chronic hepatitis C in Belgium. Acta Gastroenterologica Belgica. 2002; 65:110-111. 30. Kuehne FC, Bethe U, Freedberg K, Goldie SJ. Treatment for hepatitis C virus in human immunodeficiency virus-infected patients: clinical benefits and costeffectiveness. Arch Intern Med. 2002;162:2545-2556. 31. Gold MR, Siegel JE, Russell LB, Weinstein MC, eds. Cost-effectiveness in Health and Medicine. New York, NY: Oxford University Press; 1996. 32. Takahashi M, Yamada G, Miyamoto R, et al. Natural course of chronic hepatitis C. Am J Gastroenterol. 1993;88:240-243. 33. Yano M, Kumada H, Kage M, et al. The longterm pathological evolution of chronic hepatitis C. Hepatology. 1996;23:1334-1340. 34. Roberts JM, Searle JW, Cooksley WG. Histological patterns of prolonged hepatitis C infection. Gastroenterologia Japonica. 1993;28(suppl 5):37-41. 35. Kiyosawa K, Tanaka E, Sodeyama T, Furuta S. Natural history of hepatitis C. Intervirology. 1994;37: 101-107.
36. Gordon SC, Elloway RS, Long JC, Dmuchowski CF. The pathology of hepatitis C as a function of mode of transmission. Hepatology. 1993;18:1338-1343. 37. Niederau C, Lange S, Heintges T, et al. Prognosis of chronic hepatitis C. Hepatology. 1998;28:16871695. 38. Mattsson L, Sonnerborg A, Weiland O. Outcome of acute symptomatic non-A, non-B hepatitis. Liver. 1993;13:274-278. 39. Rodger AJ, Roberts S, Lanigan A, et al. Assessment of long-term outcomes of community-acquired hepatitis C infection in a cohort with sera stored from 1971 to 1975. Hepatology. 2000;32:582-587. 40. Thomas DL, Astemborski J, Rai RM, et al. The natural history of hepatitis C virus infection: host, viral, and environmental factors. JAMA. 2000;284:450-456. 41. Koretz RL, Abbey H, Coleman E, Gitnick G. Non-A, non-B post-transfusion hepatitis: looking back in the second decade. Ann Intern Med. 1993;119:110-115. 42. Hopf U, Moller B, Kuther D, et al. Long-term follow-up of posttransfusion and sporadic chronic hepatitis non-A, non-B and frequency of circulating antibodies to hepatitis C virus (HCV). J Hepatol. 1990; 10:69-76. 43. Tremolada F, Casarin C, Alberti A, et al. Longterm follow-up of non-A, non-B (type C) posttransfusion hepatitis. J Hepatol. 1992;16:273-281. 44. Di Bisceglie AM, Goodman ZD, Ishak KG, et al. Long-term clinical and histopathological follow-up of chronic posttransfusion hepatitis. Hepatology. 1991; 14:969-974. 45. Seeff LB, Hollinger FB, Alter HJ, et al. Long-term mortality and morbidity of transfusion-associated non-A, non-B, and type C hepatitis. Hepatology. 2001;33: 455-463. 46. Wiese M, Berr F, Lafrenz M, Porst H, Oesen U. Low frequency of cirrhosis in a hepatitis C (genotype 1b) single-source outbreak in germany: a 20-year multicenter study. Hepatology. 2000;32:91-96. 47. Kenny-Walsh E, Irish Hepatology Research Group. Clinical outcomes after hepatitis C infection from contaminated anti-D immune globulin. N Engl J Med. 1999; 340:1228-1233. 48. Seeff LB, Miller RN, Rabkin CS, et al. 45-year follow-up of hepatitis C virus infection in healthy young adults. Ann Intern Med. 2000;132:105-111. 49. Poynard T, Bedossa P, Opolon P, the OBSVIRC, METAVIR, CLINIVIR, and DOSVIRC groups. Natural history of liver fibrosis progression in patients with chronic hepatitis C. Lancet. 1997;349:825-832. 50. Matsumura H, Moriyama M, Goto I, et al. Natural course of progression of liver fibrosis in Japanese patients with chronic liver disease type C—a study of 527 patients at one establishment. J Viral Hepat. 2000; 7:268-275. 51. The French METAVIR Cooperative Study Group. Intraobserver and interobserver variations in liver biopsy interpretation in patients with chronic hepatitis C. Hepatology. 1994;20(1 pt 1):15-20. 52. Shiratori Y, Imazeki F, Moriyama M, et al. Histologic improvement of fibrosis in patients with hepatitis C who have sustained response to interferon therapy. Ann Intern Med. 2000;132:517-524. 53. Sobesky R, Mathurin P, Charlotte F, et al. Modeling the impact of interferon alfa treatment on liver fibrosis progression in chronic hepatitis C: a dynamic view. Gastroenterology. 1999;116:378-386. 54. Yano M, Yatsuhashi H, Inoue O, Inokuchi K, Koga M. Epidemiology and long term prognosis of hepatitis C virus infection in Japan. Gut. 1993;34(2 suppl): S13-S16. 55. Fattovich G, Giustina G, Degos F, et al. Morbidity and mortality in compensated cirrhosis type C. Gastroenterology. 1997;112:463-472. 56. Salerno F, Borroni G, Moser P, et al. Survival and prognostic factors of cirrhotic patients with ascites. Am J Gastroenterol. 1993;88:514-519. 57. Sclerotherapy for male alcoholic cirrhotic patients who have bled from esophageal varices. Hepatology. 1994;20:618-625. 58. Christensen E, Krintel JJ, Hansen SM, Johansen JK, Juhl E. Prognosis after the first episode of gastro-
©2003 American Medical Association. All rights reserved.
intestinal bleeding or coma in cirrhosis. Scand J Gastroenterol. 1989;24:999-1006. 59. Poynard T, Marcellin P, Lee SS, et al, International Hepatitis Interventional Therapy Group (IHIT). Randomised trial of interferon alpha2b plus ribavirin for 48 weeks or for 24 weeks versus interferon alpha2b plus placebo for 48 weeks for treatment of chronic infection with hepatitis C virus. Lancet. 1998;352:14261432. 60. Manns MP, McHutchison JG, Gordon SC, et al. Peginterferon alfa-2b plus ribavirin compared with interferon alfa-2b plus ribavirin for initial treatment of chronic hepatitis C. Lancet. 2001;358:958-965. 61. Barbaro G, Di Lorenzo G, Soldini M, et al, RibavirinInterferon in Chronic Hepatitis Italian Group Investigators. Evaluation of long-term efficacy of interferon alpha-2b and ribavirin in combination in naive patients with chronic hepatitis C: an Italian multicenter experience. J Hepatol. 2000;33:448-455. 62. Lindsay KL, Trepo C, Heintges T, et al. A randomized, double-blind trial comparing pegylated interferon alfa-2b to interferon alfa-2b as initial treatment for chronic hepatitis C. Hepatology. 2001;34: 395-403. 63. Camma C, Di M, V, Lo IO, et al. Long-term course of interferon-treated chronic hepatitis C. J Hepatol. 1998;28:531-537. 64. Marcellin P, Boyer N, Gervais A, et al. Long-term histologic improvement and loss of detectable intrahepatic HCV RNA in patients with chronic hepatitis C and sustained response to interferon-alpha therapy. Ann Intern Med. 1997;127:875-881. 65. Reichard O, Glaumann H, Fryden A, et al. Twoyear biochemical, virological, and histological follow-up in patients with chronic hepatitis C responding in a sustained fashion to interferon alfa-2b treatment. Hepatology. 1995;21:918-922. 66. Lau DT, Kleiner DE, Ghany MG, et al. 10-Year follow-up after interferon-alpha therapy for chronic hepatitis C. Hepatology. 1998;28:1121-1127. 67. Okanoue T, Itoh Y, Minami M, et al, Viral Hepatitis Therapy Study Group. Interferon therapy lowers the rate of progression to hepatocellular carcinoma in chronic hepatitis C but not significantly in an advanced stage. J Hepatol. 1999;30:653-659. 68. Yoshida H, Shiratori Y, Moriyama M, et al, IHIT Study Group: Inhibition of Hepatocarcinogenesis by Interferon Therapy. Interferon therapy reduces the risk for hepatocellular carcinoma. Ann Intern Med. 1999;131:174181. 69. Drug Topics Red Book. Montvale, NJ: Medical Economics; 2001. 70. Zaman A, Goldberg RJ, Pettit KG, et al. Cost of treating an episode of variceal bleeding in a VA setting. Am J Gastroenterol. 2000;95:1323-1330. 71. Russo MW, Zacks SL, Sandler RS, Brown RS. Costeffectiveness analysis of transjugular intrahepatic portosystemic shunt (TIPS) versus endoscopic therapy for the prevention of recurrent esophageal variceal bleeding. Hepatology. 2000;31:358-363. 72. Wong LL, McFall P, Wong LM. The cost of dying of end-stage liver disease. Arch Intern Med. 1997;157: 1429-1432. 73. Cotler SJ, Patil R, McNutt RA, et al. Patients’ values for health states associated with hepatitis C and physicians’ estimates of those values. Am J Gastroenterol. 2001;96:2730-2736. 74. Freeman AJ, Dore GJ, Law MG, et al. Estimating progression to cirrhosis in chronic hepatitis C virus infection. Hepatology. 2001;34(4 pt 1):809-816. 75. Edlin BR. Prevention and treatment of hepatitis C in injection drug users. Hepatology. 2002;36(5 suppl 1):S210-S219. 76. Thomas DL. Hepatitis C and human immunodeficiency virus infection. Hepatology. 2002;36(5 suppl 1):S201-S209. 77. Fryback DG, Dasbach EJ, Klein R, et al. The Beaver Dam Health Outcomes Study. Med Decis Making. 1993;13:89-102. 78. Stinnett AA, Paltiel AD. Estimating CE ratios under second-order uncertainty: the mean ratio versus the ratio of means. Med Decis Making. 1997;17:483-489.
(Reprinted) JAMA, July 9, 2003—Vol 290, No. 2 237