Memory & Cognition 2007, 35 (3), 381-392
Contextual cues and the retrieval of information from cognitive maps Davi Bugmann
University of Plymouth, Plymouth, England
Kenny R. Coventry
Northumbria University, Newcastle Upon Tyne, England and
Stephen E. Newstead
University of Plymouth, Plymouth, England In three experiments, we investigated how retrieval cues affect memory for cognitive maps. Participants first rated a list of landmarks either for the importance of the activity performed or for the frequency of visitation at each landmark (Experiments 1 and 2), or on both dimensions (Experiment 3). Landmarks ranked high and low on these dimensions were selected and served as the bases for distance estimations and route descriptions. Distances estimated using importance as a criterion for selection were significantly longer than those using frequency of visitation as a criterion. Participants in the importance group also produced more route perspective expressions than survey expressions in their descriptions, whereas participants in the frequency group did not differ in the relative use of these types of perspective expressions (Experiment 1). These findings suggest that deviations in distance estimation and the use of perspectives in route description are a result of contextual manipulation and the procedures invoked during judgments.
In order to get around the environment and communicate about it, humans need to build spatial mental representations or cognitive maps of the world (see, e.g., Downs & Stea, 1977; Tolman, 1948). Cognitive maps contain three kinds of spatial information: the existence of elements (objects and places), the directional relationships among the elements, and the distance separating the elements. There is much evidence that the construction of such representations is affected both by the nature of the environment being learned and by how and why such information is acquired. However, despite much interest in effects of encoding on the spatial representations humans form about the environment, less attention had been given to the issue of whether or not context at retrieval affects how one recalls information about the spatial world. In the present article, we examine the influence of retrieval effects on cognitive maps using measures that have been shown to be affected both by the mode of acquisition of spatial knowledge (e.g., learning through maps vs. learning through navigation) and by goal at encoding. We first briefly review the evidence that our knowledge of the spatial world is affected by these variables at encoding and then address the motivation for examining retrieval context at recall. We present the results of three experiments showing that retrieval effects do indeed occur for two measures of cognitive maps: distance
estimation between places and route descriptions (i.e., how one gets from one place to another). Perspective and Acquisition of Spatial Knowledge The way in which one learns about the environment and the goals one has when learning about it have both been shown to affect the construction of spatial representations of that environment. In relation to mode of acquisition, a distinction has been made between two types of spatial perspective associated with specific ways of representing the environment: route perspective and survey perspective. Survey perspectives are often associated with learning about an environment through maps. Map representations provide a bird’s-eye (allocentric) view, reference locations to other locations, involve a stable orientation, and provide significant amounts of information at a given time (Taylor & Naylor, 2002). In contrast, route perspectives are associated with sequential procedural learning about one’s environment through navigation (Allen & Kirasic, 1985) and with an egocentric, within-environment viewpoint in which orientation changes with each turn taken and information is limited to the visual field. Evidence for this distinction is widespread and now includes substantiation of the claim that certain brain structures are responsible for egocentric representations of the world whereas others
K. R. Coventry,
[email protected]
381
Copyright 2007 Psychonomic Society, Inc.
382 Bugmann, Coventry, and Newstead are responsible for allocentric representations (see, e.g., Burgess, Maguire, & O’Keefe, 2002). There is considerable evidence that the perspective adopted at learning affects memory for the environment at recall (Evans & Pezdek, 1980; Leiser, Tzelgov, & Henik, 1987; Perrig & Kintsch, 1985; Sholl, 1987; Taylor & Naylor, 2002; Taylor, Naylor, & Chechile, 1999; Thorndyke & Hayes-Roth, 1982). For example, in relation to distance estimation, Thorndyke and Hayes-Roth (1982) and Taylor and colleagues (Taylor & Naylor, 2002; Taylor et al., 1999) compared the recall performance of participants learning environments either through navigation or through maps on Euclidean (straight-line or as the crow flies)1 and route (walking) distance measures. Given that participants learning environments through navigation must physically turn and change orientation with a limited (egocentric) viewpoint, it was expected that they would be worse than map learners on tasks involving measures of Euclidean distance (i.e., the shortest distance between two landmarks) but better than map learners on route distance estimates. The results supported these predictions. Map learners were more accurate than route learners for Euclidean distance estimations, whereas route learners were more accurate than map learners for route distance estimations. Perspective differences have also been found for people’s descriptions of learned routes. In order to describe a route, the speaker must access his or her environment knowledge and produce a coherent set of verbal directions based on that knowledge. Past studies have suggested that the mode of acquisition of spatial knowledge contributes to the choice of description perspective. For example, Taylor and Tversky (1996) found that the majority of the descriptions of a campus and neighborhood environment, all learned by navigation, were based on a route perspective, in which the locations of landmarks are described in relation to the listener’s (or the speaker’s) body. Furthermore, when they compared participants’ learning about an environment through maps versus through navigation, Taylor et al. (1999) and Taylor and Naylor (2002) found that people who had learned environments through navigation produced more accurate route descriptions than those who had learned through maps, whereas those who had learned through maps gave more accurate “walk-through-the-wall” descriptions than those who had learned through navigation. There is also evidence that goal at encoding is important for memory for route distance (Cohen & Cohen, 1982; Curiel & Radvansky, 1998; Gauvain & Rogoff, 1986; Magliano, Cohen, Allen, & Rodrigue, 1995; Taylor & Naylor, 2002). For example, Taylor and Naylor instructed participants to learn either the layout of a building or the fastest routes between rooms of the building. On recall, participants with the route goal gave more accurate route distance estimates than participants with the survey goal. Furthermore, the spatial descriptions produced by the route goal participants included more spatially relevant information than those produced by the survey goal participants. Perspective and Retrieval of Spatial Knowledge Given that learning about one’s environment produces (at least) two types of perspectives on the spatial world, it
might also be expected that context at retrieval would also affect recall of information about the spatial world. Models of memory hold that encoding and retrieval processes are strongly interrelated (see, e.g., Tulving, 1983; Tulving & Thompson, 1973). Furthermore, according to Schacter and Tulving (1994), retrieving an episodic memory is a reconstructive act in which the context at retrieval affects how the different elements of the episode are bound together. There are numerous demonstrations of the effects of context at retrieval for memory for words, events, and places (see, e.g., Anderson & Pichert, 1978; Loftus & Palmer, 1974; Nilsson, Law, & Tulving, 1988; Smith, 1988; see Engel, 1999, for a review). Retrieval might also affect recall of information about the spatial world. According to the implicit scaling model (Holyoak & Mah, 1982; McNamara & Diwadkar, 1997), information about stimulus properties is retrieved from long-term memory and then scaled by the context in which the retrieval takes place. In the question How far is it from A to B?, B is the standard or referent to which A is compared. According to McNamara and Diwadkar, if it were a landmark that is a reference point (tall, large, stable buildings that are familiar and frequently used), it evokes a larger subjective stimulus range in working memory than if it were a nonreference point. Because the implicit scale is larger when a reference point establishes the context, it will yield reduced discriminability between locations and, as a consequence, the estimated distance from nonreference point to reference point (A to B) is smaller than that from reference point to nonreference point (B to A). This model is thus able to account for the asymmetry in distance estimation effects originally found by Sadalla, Burroughs, and Staplin (1980). Furthermore, McNamara and Diwadkar showed that the direction of the asymmetry effect could be changed by asking participants to retrieve the referent location (B) prior to estimating the distance from A to B. The implicit scaling model can be regarded as a collection of psychological principles (McNamara & Diwadkar, 1997), the most general of which states that thinking about an object or an event creates a context in working memory for subsequent mental processing and that these “internal” contexts may be different for different stimuli. The principles of the implicit scaling model can be extended so that effects of context on retrieval may go beyond the order in which landmarks are considered on retrieval. Sadalla, Staplin, and Burroughs (1979) found that the ease with which names of places can be recalled (e.g., high-frequency names are more retrievable than low-frequency names) affects distance estimation for the route involving those places. One might also expect that thinking about the same landmarks in the same order but in different ways may also affect distance estimation and other measures of recall of information about the spatial world. We asked participants to either think about how often they went to landmarks and rate the landmarks in terms of frequency of visitation, or to think about the activities they performed at landmarks and rate the landmarks in terms of the importance of the activities performed there. We
Contextual Cues, Distance, and Cognitive Maps 383 hypothesized that when people focused on the activities rather than on the frequency, they would be more likely to use a route perspective if they were asked to give distance estimates between the landmarks or if they were asked to describe how to get from one place to another. There are several reasons that we thought this likely. First, given that learning about the spatial environment usually takes the form of either navigating around the environment (route perspective) or learning about the environment through 2-D representations (i.e., maps), we expected that context at retrieval might selectively cue these types of representation. Just as route and survey information can be gleaned from learning about the environment in different ways (Taylor & Naylor, 2002; Taylor & Tversky, 1996), thinking about a landmark in terms of actions should be more likely to cue perspective learned through action. Second, we ran a pilot study using protocol analysis in order to establish whether or not people indeed think about actions more when rating landmarks for the importance of the activity performed there than when rating them for frequency of visitation.2 Participants rating landmarks for importance of activity produced more action verbs than did participants rating landmarks for frequency of visitation, suggesting that people do think of actions more when rating for importance of activities than for frequency of visitation. Third, the protocols involving action verbs are consistent with the idea that information linked to a goal (e.g., to exercise in a gym) can prime other information linked to the same goal (McKoon, Ratcliff, & Seifert, 1989; Seifert, McKoon, Abelson, & Ratcliff, 1986), such as the action of getting to the gym. In the present study, we examined whether or not rating landmarks in terms of the importance of the activity performed there versus the frequency of visitation affects retrieval of spatial information (e.g., distance, route description) from memory. We expected that participants who rated the importance of activities performed at landmarks would give longer route distance estimates and produce more route perspective than survey perspective expressions in their route descriptions in comparison with participants who rated the same landmarks for frequency of visitation. Experiment 1 was conducted to test this claim. In Experiment 2, we also examined Euclidean distance estimation; in Experiment 3, we considered the consequence of thinking about landmarks by rating both dimensions prior to giving distance estimates and route descriptions. Experiment 1 In the first experiment, we examined route distance estimations and route descriptions for pairs of landmarks on the basis of ratings of frequency of visitation and importance of the activities performed at those places. Participants were first given a list of 22 landmarks on the campus of Plymouth University and were asked to rate either the frequency of visitation or the importance of the activity performed at each landmark. From these ratings, two pairs of landmarks (hereafter denoted Landmark Pair A and Landmark Pair B) were selected for each participant, each pair consisting of a landmark with the highest rating
and a landmark with the lowest rating. For each pair of landmarks, participants were asked to give a route distance estimate followed by a route description. Following Denis’s (1997) technique for route description segmentations, participants’ protocols were categorized into propositions. Each proposition can specify (1) an action prescription (e.g., Go forward ), (2) an action prescription and a landmark (e.g., Walk past the bank machine on your left), (3) a description of a landmark encountered at this point of the journey (e.g., The Students Union is in front of you), or (4) a description of the identity or the physical features of the landmark (e.g., The pub is The Duchess). The propositions were also classified in terms of perspective. Following Taylor and Tversky’s (1996) work on spatial descriptions, perspective expressions used in descriptions were defined as either route perspective expressions or survey perspective expressions. Route perspective expressions were defined as statements that describe the locations of landmarks using the speaker’s or the listener’s body as the referent (e.g., The Students Union is on my left). Survey perspective expressions were defined as statements that describe the locations of landmarks either with reference to a system of coordinates (e.g., The Mary Newman Building is north of Link Building) or in relation to one another (e.g., Walk down between the building site and the Students Union). The entire categorization scheme is shown in Table 1. Direction within landmark pairs (i.e., from the highest to the lowest rated landmark or vice versa) was counterbalanced within and between sessions so that each participant gave four distance estimates and route descriptions (one high to low and one low to high in each of the two sessions). This was done to control for possible effects of asymmetry in distance estimation, consistent with the implicit scaling hypothesis (McNamara & Diwadkar, 1997; Sadalla et al., 1980). It was predicted that participants who rated landmarks according to the importance of the activity performed at those landmarks would be more likely to trigger action-based representations associated with those landmarks, and therefore would produce longer and more accurate route distance estimations, together with route descriptions containing more route perspective than survey perspective expressions, than would participants who rated landmarks on the basis of frequency of visitation. Method
Design. Participants had the task of evaluating a series of landmarks on the university campus by giving ratings for frequency of visitation (hereafter, frequency) or importance of activity performed (hereafter, importance) at those landmarks. The direction of estimation (hereafter, direction) was counterbalanced (high to low vs. low to high) to control for direction of travel. Direction was fixed using the participants’ ratings of the landmarks. For example, most of the participants gave the Students Union and the Security Lodge ratings of 10 and 1, respectively, on both frequency and importance dimensions. These landmarks are used as examples in the text. The distance estimations could be given in either direction—that is, from the Students Union to the Security Lodge (high-to-low direction) or from the Security Lodge to the Students Union (low-to-high direction). Simple and direct questions were used during the interviews, which were tape-recorded. For distance estimation, the participants
384 Bugmann, Coventry, and Newstead Table 1 Categorization Scheme for Route Descriptions Used in Experiments 1–3 Category Introduction of new landmarks
Action prescriptions without mention of landmarks
Action prescriptions with mention of landmarks
Description of landmarks
Subcategory Use of “there is” Description of visual scene Use of egocentric point of view Use of landmark’s point of view, allocentric coordinates Proceed straight ahead Proceed pseudodistance Change of direction Maintain progress Change the current path Aim at a specific landmark Use of a specific landmark Maintain progress on a specific landmark Change the current path Proceed past a landmark Reorientation at a specific landmark Landmark identity Landmark physical features Landmark function
Examples of Utterances There is a pub You find X/You see X X is on my left/right/in front/behind X is at 11 on a clock/X is opposite a building/X is south of a building Go forward/Go straight ahead Go a bit further Turn left/right Keep going Cross over Go toward X Follow X/Take X/Go through X Keep going along the corridor Cross over the road Go past X Turn left/right at X
A pub called The Duchess A tall building/the red doors The main entrance Start position Come out of X/Leave X Destination/goal It’s there Note—X is an environmental feature (e.g., building, street, signpost, etc.).
were asked, “In walking distance, how far do you think it is in meters from the Students Union to the Security Lodge?” For route description, the participants were instructed to imagine themselves at the starting location, from which they were to describe how to reach the destination on foot. To investigate route descriptions, we used open questions (e.g., “Imagine that you are at the Students Union. How would you get from the Students Union to the Security Lodge? Would you please describe your route in as much detail as you can?”). Distance estimation was measured as the ratio between the estimates of distances and the (actual) traversed distances as described in the route descriptions. The choice of perspective used in the route descriptions was determined on the basis of a categorization of the participants’ route description protocols (described above). The experimental design was a 2 (condition: frequency vs. importance) 3 2 (landmark pair: A vs. B) 3 2 (direction: high to low vs. low to high) mixed design. The between-subjects variable was condition (frequency vs. importance), and the other variables were within subjects. Participants. Thirty-eight undergraduate students (3 males and 35 females) took part in the experiment in exchange for course credit. Two participants did not turn up at the second session, and consequently their responses were eliminated (leaving a total of 2 males and 16 females in the frequency condition and 18 females in the importance condition). The age range of the remaining 36 participants was 18–20 years (M 5 18.64, SD 5 0.68). The participants had attended the university for 1–12 months (mean length of attendance 5 3.15 months, SD 5 3.06). They were individually tested and randomly assigned to the frequency condition or the importance condition, and we ensured that there was no difference in length of attendance between conditions.3 Procedure. A list of 22 landmarks was preselected. The landmarks included a mixture of teaching, residential, and recreational buildings on the Plymouth University campus. The sequence of events experienced by the participants during tests is displayed in Figure 1. The participants were initially instructed to mark the landmarks they did not know and then to give the ratings for the remaining landmarks for the dimension corresponding to the condition to which they had been assigned (frequency or importance),
using rating scales of 1 to 10. The rating for frequency of visitation was prompted by the question, “How often do you go to each place during term time?” It was explained to the participants that a score of 1 represents never go and a score of 10 represents very frequently. The rating for importance of activity was prompted by the question, “How important to you is the activity you perform at each place?” It was explained to the participants that a score of 1 represents not at all important and a score of 10 represents very important. After each participant had rated the landmarks, a filler task (requesting demographic information) was given in order to give the experimenter time to select the landmark pairs for distance estimation and route description. First, the experimenter scanned the participants’ ratings, looking for scores of 10 and 1. On the few occasions when these extreme scores were not used, the next lowest and highest scores were considered. The experimenter then chose the two landmarks with the highest scores and the two landmarks with the lowest scores. The selected landmarks were assembled randomly into two distinct high-to-low/low-to-high pairings in order to create two different routes for distance estimation and route description. Half of the participants were first given a high-to-low pair of landmarks and half a low-to-high pair, and all the participants were asked to estimate the distance between the two landmarks of each pair. The participants were explicitly required to estimate walking distances expressed in meters (not in time). Following elicitation of the distance estimation of the first pair of landmarks, the participants were asked for a route description. The experimenter then used the same procedure for the second pair of landmarks. At the end of the session, the participants were again given the list of 22 landmarks and asked to rate the landmarks on the other dimension (i.e., those in the frequency condition were now asked to rate landmarks on importance, and vice versa). Two weeks later, the participants returned and had to do the same task, except that this time the order of landmarks in each pair was reversed to control for possible differences in estimation between landmark pairs. The procedure for the second session was identical to that used in the first session. Again, the participants were first given the landmarks and were asked to rate them, but this time the ratings were not used for selection of the landmarks, given that they had already been selected at the start of the first session. Each session lasted around 15 min.
Contextual Cues, Distance, and Cognitive Maps 385 Results The recordings of the sessions were transcribed so that the route descriptions could be categorized and analyzed. The actual distances were recorded by following the participants’ route descriptions on a scaled map of the campus (scale 5 1/1,250) with a map distance measure. These measures were then translated into meters. A proportion of the calculations were physically checked by measuring the walking distance using a pedometer, and there were no concerns regarding the accuracy of the distances calculated using the map measurements. For the analyses, the distance estimations were ratio measures. Distance ratio was obtained by dividing the estimated distance by the actual distance (both measured in meters). A distance ratio of 1 reflects perfect accuracy between estimate and actual distance, less than 1 reflects underestimation, and greater than 1 reflects overestimation. The route descriptions were categorized using the detailed categorization scheme outlined above. The aim of the categorization of route descriptions was to isolate the propositions or statements that identify route perspective (i.e., use of egocentric point of view) and survey perspective (i.e., use of the point of view of the landmark) expressions as well as other ways of talking about the spatial world.4 We were interested in the numbers of route and survey expressions and wished to establish whether the rating dimension (frequency of visitation or importance of activity) influenced the extent to which the participants used these types of perspective expressions. To do this, all the items used in route descriptions were summed for each participant, and each participant’s percentages of route items and survey items were calculated by dividing the total number of items by the numbers of route items and survey items, respectively, in that participant’s route descriptions. Preliminary analyses. Given that all the participants were students who had been on campus for the same (relatively short) length of time, the four landmarks selected for the tests by the participants in the frequency condition and those in the importance condition were almost identical. In both sessions, the participants gave frequency and importance ratings for the 22 landmarks. For each participant, the correlation between frequency ratings and importance ratings in the first session was computed and found to be highly significant for every participant. The mean correlation was r 5 .78 (range, .53–.98) for the frequency group and r 5 .88 (range, .72–.98) for the importance group. Hence, for both conditions, individual landmarks were evaluated similarly in terms of both frequency and importance.5 Distance estimation. The means and SDs for distance estimations and actual distances6 are displayed in Table 2 (collapsed across Landmark Pairs A and B). The withinparticipants correlations between actual and estimated distances were all greater than zero, and the mean correlation was r 5 .36. The mean distance ratios are displayed by condition and direction in Table 3. The distance ratio data were analyzed using a 2 (condition) 3 2 (direction) mixed ANOVA with repeated measures on the latter variable. No main effect of direction was found [F(1,34) 5 1.63, MSe 5 0.06, p . .05], but there was a significant main effect of condition
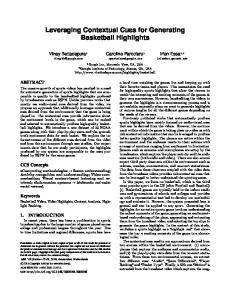
Initial Screening for Known Landmarks ↓ Ratings for Frequency/Importance ↓ Filler Questionnaires ↓ Route A, Distance Estimation ↓ Route A, Route Description ↓ Route B, Distance Estimation ↓ Route B, Route Description ↓ Ratings for Importance/Frequency ↓ General Information About the Participant (Gender, Age, Attendance)
Figure 1. Schematic representation of the test procedure used in Experiment 1.
on distance ratio [F(1,34) 5 5.08, MSe 5 0.37, p , .05]. On average, the importance group gave longer and more accurate distance estimations (M 5.92) than the frequency group (M 5 .59). The interaction between condition and direction was not significant [F(1,34) 5 2.26, MSe 5 0.44, p . .05]. Route description. Since each participant produced four route descriptions over the two sessions, in total there were 144 route descriptions (36 participants 3 2 routes 3 2 directions of estimation). The categorization of the protocols of all route descriptions across participants generated 1,635 propositions in total. The mean percentage use of each of the categories in Table 1 is displayed by condition in the Appendix. Of most interest in the route description classification is the extent to which route versus survey perspective expressions were used. The mean percentages of survey and route perspective expressions are displayed by condition and direction in Table 4. The perspective data were
386 Bugmann, Coventry, and Newstead Table 2 Mean Distance Estimations and Actual Distances (in Meters, Collapsed Across Routes), and Standard Deviations, by Condition and Direction in Experiment 1
Distance Estimation Actual
Frequency High Low to Low to High M SD M SD 147 134 181 127 252 101 303 72
Importance High Low to Low to High M SD M SD 207 153 272 190 224 93 288 98
analyzed using a 2 (condition) 3 2 (direction) 3 2 (perspective expression type) mixed ANOVA with repeated measures on the last two variables. No main effects of direction [F(1,34) 5 0.70, MSe 5 0.003, p . .05] or condition [F(1,34) 5 0.21, MSe 5 0.01, p . .05] were found. However, there was a significant main effect of perspective expression type [F(1,34) 5 33.48, MSe 5 0.006, p , .0001]. Overall, route perspective expressions were more frequently produced (M 5 12% of propositions) than survey perspective expressions (M 5 4.5% of propositions). The interaction between condition and perspective expression type was also significant [F(1,34) 5 5.30, MSe 5 0.006, p , .05]. Significantly more route perspective expressions (M 5 14%) than survey perspective expressions (M 5 3%) were produced in the importance group ( p , .001). No significant difference between the percentages of survey and of route perspective expressions was found in the frequency group (Ms 5 10% and 6%, respectively). No other pairwise comparisons were significant. Discussion There was a strong correlation between the ratings for frequency and for importance for the selected landmarks used for distance estimation and route description, indicating that landmarks that were visited frequently were also associated with important activities. A consequence of this was that the landmark pairs selected and used for distance estimation and route description were virtually identical for the frequency group and the importance group. This is not unexpected given that the participants were all university students who had been on campus for the same length of time. Therefore, any between-conditions differ-
Table 3 Mean Distance Ratios and Standard Deviations, by Condition and Direction in Experiments 1–3
Experiment 1 Experiment 2
Experiment 3
Group Frequency Importance Frequency/Euclidean Frequency/route Importance/Euclidean Importance/route Frequency/importance Importance/frequency
High to Low M SD 0.57 0.44 0.89 0.50 0.93 0.46 0.86 0.31 1.41 0.96 0.96 0.43 0.70 0.68 1.29 1.31
ences between distance estimations and route descriptions cannot be attributed to the landmark pairs used. There was also a correlation between actual distance and estimated distance for every participant, which is consistent with results from previous studies (e.g., Decety, Jeannerod, & Prablanc, 1989; Thorndyke & Hayes-Roth, 1982), indicating that the participants were sensitive to objective distances when giving their estimates. The effect of direction of estimation (i.e., the order in which landmarks were mentioned at retrieval) on distance estimation or route description was not observed in this experiment. (We pick up on this point in the General Discussion.) However, although ratings for frequency and importance were highly correlated, the cuing of frequency or importance before the participants gave distance estimates and route descriptions affected both dependent measures. The frequency group gave smaller distance estimates than the importance group. In addition, the importance group used significantly more route perspective expressions than survey perspective expressions in their route descriptions, whereas the frequency group did not differ in the percentages of route and survey perspective expressions used. These results provide evidence that context at retrieval can cue different types of information from memory, just as learning at encoding can affect distance estimation and route description (Taylor & Naylor, 2002). In relation to the interpretation of the main findings, although the participants were able to use both survey and route representations of the environment flexibly, the rating
Table 4 Mean Percentages of Survey Perspective and Route Perspective Expressions, and Standard Deviations, by Condition and Direction in Experiments 1–3
Experiment 1 Experiment 2
Experiment 3
Group Frequency Importance Frequency/Euclidean Frequency/route Importance/Euclidean Importance/route Frequency/importance Importance/frequency
Low to High M SD 0.61 0.39 0.95 0.58 0.90 0.40 0.91 0.38 1.26 0.90 0.96 0.37 0.62 0.87 1.30 0.98
High to Low Survey Route M SD M SD 5.7 6.7 9.3 0.9 2.9 3.6 14.0 9.4 12.1 7.8 6.5 6.9 9.9 6.7 5.7 5.4 7.7 5.4 6.5 6.1 8.8 5.6 8.6 6.3 8.0 5.2 5.4 7.5 5.7 6.7 10.5 9.4
Low to High Survey Route M SD M SD 5.7 5.5 11.1 8.7 4.0 5.7 14.3 11.6 9.5 8.0 12.2 22.5 7.6 4.8 7.3 6.5 8.3 5.5 10.3 4.9 7.1 6.8 8.3 5.4 3.9 6.1 10.0 6.9 6.5 6.7 13.6 12.8
Contextual Cues, Distance, and Cognitive Maps 387 dimension affected the relative extent to which each of these representations was used. However, in the first experiment route distance estimates were used as a dependent measure only. If the importance dimension cues a route perspective, then it should also be the case that the importance group will overestimate Euclidean distance more than the frequency group. If such an effect is present, it would be consistent with encoding effects. Recall that Taylor and Naylor (2002) found that participants who learned environments through navigation made more accurate route distance estimates than did those who learned the same environments through maps, whereas map learners gave more accurate Euclidean distance estimates than did navigation learners. In Experiment 2, we aimed to replicate the results for route distance estimates found in Experiment 1 while also examining the effects of rating dimension on Euclidean distance estimates and route description. Participants were asked to estimate either route distances or Euclidean distances and then to describe routes linking those landmarks. We expected to replicate the results of Experiment 1 in relation to route descriptions for the route distance estimate groups. However, for the groups that gave Euclidean distance estimates prior to giving route descriptions, it is possible that the type of distance estimation could itself cue knowledge germane to route description. In other words, participants who had just given a Euclidean distance estimate might be expected to produce more survey expressions in their route descriptions than those who had just given route distance estimates. Experiment 2 In Experiment 2, we examined whether or not the group differences in distance estimation and route description are robust across types of distance estimation. Types of distance estimation (Euclidean vs. route) were combined with condition (frequency vs. importance) to produce four groups. Method
Design. The method used was similar to that used in Experiment 1, but there were some changes. Four groups of participants were used. The design was a 2 (condition: frequency vs. importance) 3 2 (type of distance estimation: route vs. Euclidean) 3 2 (direction: high to low vs. low to high) mixed design with repeated measures on the last factor. Each participant gave two distance estimates and two route descriptions (one low to high and one high to low) in a single testing session. The distance estimation data as well as the route description data were treated in the same manner as in Experiment 1.7 Participants. Seventy-six undergraduate students took part in the experiment in exchange for course credit or payment. Each of them was randomly assigned to one of the four experimental conditions and individually tested. Four responses were eliminated due to poor quality of recordings (2 participants), inability to produce distance estimations (1 participant), and distance estimations given in one direction only (1 participant). Responses from 72 participants (15 males and 57 females— 4 males and 14 females in each of the frequency conditions, 3 males and 15 females in the importance Euclidean condition, and 4 males and 14 females in the importance route condition) were used in the analyses. The participants were 18–45 years old (M 5 21.65 years, SD 5 4.79). They had attended the university for 3–43 months (M 5 11.09 months, SD 5 8.63). There were no significant differences in age or length of attendance of participants between conditions.
Table 5 Mean Distance Estimations and Actual Distances (in Meters), and Standard Deviations, by Condition, Direction, and Estimation Type in Experiment 2
Distance
Euclidean High to Low to Low High M SD M SD
Route High to Low to Low High M SD M SD
Estimation Actual
238 181
140 51
Frequency 238 170 200 54
359 313
202 76
362 293
257 111
Estimation Actual
264 194
192 75
Importance 269 221 205 55
355 350
211 111
252 267
128 93
Procedure. In this experiment, two groups of participants were assigned to the frequency condition and two groups to the importance condition. Half of the participants in each condition gave route distance estimates, whereas the other half gave Euclidean distance estimates. All the participants gave one distance estimate and one route description for each of two distinct pairs of landmarks: one in the high-to-low direction and one in the low-to-high direction. The order of presentation of routes was counterbalanced within each group. The structured interview, which was tape-recorded, was exactly the same as in Experiment 1, but only one session was needed. Those participants who were to give Euclidean distance estimations were asked, “What is the shortest distance in meters between [Landmark A] and [Landmark B]? By shortest distance, I mean the distance between the centers of the two buildings as the crow f lies.” The experimenter made sure the participants understood the question before continuing.
Results Distance estimation. Table 5 displays the distance estimations in relation to the corresponding actual distances for the four groups. The within-participants correlations between actual and estimated distances were all greater than zero, and the mean correlation was r 5 .41. The mean distance ratios are displayed by condition and direction in Table 3. The distance ratio data were analyzed using a 2 (condition) 3 2 (type of distance estimation) 3 2 (direction) ANOVA with repeated measures on the last variable. There was no main effect of direction [F(1,68) 5 0.24, MSe 5 0.13, p . .05]. The effect of type of distance estimation was also not significant [F(1,68) 5 2.67, MSe 5 2.67, p 5 .11], although the participants giving Euclidean estimates tended to give longer estimates on average (M 5 1.12) than did those who gave route distance estimates (M 5 0.92). There was a significant main effect of condition on distance ratio [F(1,68) 5 4.05, MSe 5 0.27, p , .05]. Overall, the participants in the importance conditions gave longer distance estimates (M 5 1.15) than those in the frequency conditions (M 5 0.90). That is, the participants in the frequency condition underestimated the distances whereas those in the importance condition overestimated the distances. The interaction between condition and type of distance estimation was not significant [F(1,68) 5 1.97, MSe 5 0.54, p 5 .16], although the data showed a trend in the expected direction. Although participants in both importance groups gener-
388 Bugmann, Coventry, and Newstead ally gave larger distance estimates than participants in the frequency groups, overestimates of distance occurred only in the importance group giving Euclidean estimates (M 5 1.33; for all other groups, Ms , 1). None of the other interactions were significant (all Fs , 1). Route description. Since each participant produced two route descriptions, there were 144 route descriptions in total (72 participants 3 2 routes), which generated 3,237 propositions overall. The mean percentages of survey and route perspective expressions are displayed by condition and direction in Table 4. To test for significance in the use of perspective expressions, a 2 (condition) 3 2 (type of distance estimation) 3 2 (direction) 3 2 (perspective expression type: route expressions vs. survey expressions) ANOVA was run, with repeated measures on the last three variables. There were no significant main effects of any of the variables, and the only significant interaction was between types of perspective expressions and direction [F(1,68) 5 4.32, MSe 5 0.01, p 5 .04]. For the high-to-low direction, slightly more survey perspective expressions (M 5 10%) were found than route perspective expressions (M 5 7%), whereas the figures were similar for survey and route perspective expressions in the low-tohigh direction (Ms 5 9% and 8%, respectively). However, follow-up analyses showed that none of the pairwise comparisons was significant (all ps . .05). Discussion The data from Experiment 2 replicated those from Experiment 1 in terms of the influence of rating dimension on distance estimation. Overall, distances estimated on the basis of frequency were systematically smaller than distances estimated on the basis of importance. Although not significant, the data showed a trend whereby the importance group using the Euclidean estimation overestimated distances, whereas the other three groups underestimated distances, as would be expected if the importance group were cued at retrieval to access a route perspective. The route description data showed no significant effects involving condition on the percentage of route perspective or survey perspective expressions used. The absence of effects involving type of estimation given prior to route description indicates that the distance estimation measure itself did not affect or cue perspective when route descriptions were given, although more survey expressions were produced overall in this experiment than in Experiment 1. Experiments 1 and 2 have both shown evidence that the participants were affected at retrieval by the criterion (frequency or importance) that they used to rate landmarks prior to making distance estimates and giving route descriptions. We were interested in establishing whether or not context effects at retrieval persist when participants are given both dimensions on which to rate landmarks prior to giving route distance estimates and route descriptions. In line with anchoring bias effects in the judgment and decision making literature (e.g., Chapman & Johnson, 2002; Epley & Gilovich, 2002), we suspected that participants would be anchored by the first rating dimension given and, therefore, that participants given the importance rating dimension first
and the frequency rating dimension second would produce longer route distance estimates and more route perspective expressions in their route descriptions than those given the frequency rating dimension first and the importance rating dimension second. However, we expected that the effects may be weakened, given that route knowledge information would decay when the second dimension was given. Alternatively, it could be that the distance estimates and route descriptions are affected by the dimension cued most recently, in which case the results would be in the opposite direction to those predicted by anchoring. A third possibility is that considering both dimensions may lead to an increase in the use of both survey perspective and route perspective, and this would be most obviously observed in the increased use of route and survey perspective expressions in route descriptions. In Experiment 3, we tested which of these possibilities is the case. Experiment 3 In Experiment 3, participants were required to give individual landmark ratings for both frequency and importance at the start of the test. The same methodology was used in Experiment 3 as in Experiments 1 and 2, but with slight modifications. Two groups of participants were used. The frequency–importance group rated the landmarks for frequency and then immediately for importance, and the importance–frequency group rated them for importance and then immediately for frequency. Method
Design. The design was a 2 (condition: frequency–importance vs. importance–frequency) 3 2 (direction: high to low vs. low to high) mixed design with repeated measures on the latter factor. Each participant was tested under all levels of direction. Therefore, each participant produced two distance estimates and two route descriptions. Participants. Thirty-two undergraduate students (2 males and 30 females) 18– 45 years of age (M 5 20.31 years, SD 5 5.23) took part in the experiment in exchange for course credit. The participants had attended the university for 2–3 months (M 5 2.97 months, SD 5 0.18). They were individually tested and randomly assigned to the frequency–importance or importance–frequency groups (1 male and 15 females in each condition). Procedure. The procedure was similar to that of Experiments 1 and 2, but with slight modifications in relation to the sequence of ratings of landmarks. The participants initially screened a series of landmarks presented to them in order to establish which landmarks they knew with certainty and which they did not know. They were then asked to rate the remaining landmarks for one dimension (frequency or importance) using a 10-point rating scale, and then, immediately, to rate them for the other dimension. The distance estimation and route description tasks followed. As previously, all the participants gave a route distance estimate and a route description for each of two distinct pairs of landmarks: one in the high-to-low direction and one in the low-to-high direction. The order of presentation of routes was counterbalanced within each group. The distance estimation data as well as the route description data were treated in the same manner as in Experiment 1.
Results Distance estimation. Table 6 displays the descriptive statistics for distance estimations and actual distances for
Contextual Cues, Distance, and Cognitive Maps 389 both frequency–importance and importance–frequency groups. The within-participants correlations between actual and estimated distances were all greater than zero, and the mean r 5 .23. The mean distance ratios are displayed by condition and direction in Table 3. The distance ratio data were analyzed using a 2 (condition) 3 2 (direction) mixed ANOVA with repeated measures on the latter variable. No main effect of direction was found [F(1,30) 5 0.09, MSe 5 0.02, p . .05]. However, there was a significant main effect of condition on distance ratio [F(1,30) 5 3.63, MSe 5 1.74, p , .05]. The importance–frequency group gave larger distance estimations (M 5 1.29) than the frequency–importance group (M 5 0.67). There was no main effect of direction, and the interaction between direction and condition was also not significant (both Fs , 1). In order to establish whether or not rating both dimensions influenced distance estimation, the data were compared to those from the first session in Experiment 1, in which the participants rated only one dimension prior to giving their distance estimations. The length of time during which the participants had been on campus was used as a covariate in the analysis because this factor varied between experiments. The results of the ANCOVA with experiment as a variable produced a significant main effect of condition [F(1,63) 5 6.64, MSe 5 1.12, p , .05], but there were no significant effects or interactions involving experiment (all Fs , 1). Route description. Since each participant produced two route descriptions, there were 64 route descriptions in total (32 participants 3 2 routes), which produced 1,089 propositions overall. The mean percentages of survey and route perspective expressions are displayed by condition in Table 4. In order to assess whether condition affects the extent to which survey and route expressions are produced in descriptions, we ran a 2 (condition) 3 2 (direction) 3 2 (perspective expression type) mixed ANOVA with repeated measures on the last two variables. No main effects of direction [F(1,30) 5 0.50, MSe 5 0.007, p . .05] or condition [F(1,30) 5 2.90, MSe 5 0.006, p . .05] were found. However, there was a significant main effect of perspective expression type [F(1,30) 5 7.07, MSe 5 0.007, p , .05]. Overall, route perspective expressions were more frequently produced (M 5 10% of propositions) than survey perspective expressions (M 5 6% of propositions). The interaction between perspective expression type and direction was also marginally significant [F(1,30) 5 4.26, MSe 5 0.006, p 5 .05]. Significantly more route perspective expressions (M 5 12%) than survey perspective expressions (M 5 5%) were found for the low-to-high direction ( p , .01), but no significant difference was found for the high-to-low direction (for route perspective expressions, M 5 8%; for survey perspective expressions, M 5 7%). In order to establish whether or not rating both dimensions influenced route description, the data were compared to those from the first session in Experiment 1 for all three route description measures, with the length of time the participants had been on campus used as a covariate in the analyses. The results of the ANCOVA with experiment as
a variable produced a significant main effect of perspective expression type [F(1,63) 5 16.47, MSe 5 0.006, p , .001] and an interaction between perspective expression type and condition [F(1,63) 5 5.78, MSe 5 0.006, p , .05], but there were no significant effects or interactions involving experiment (all Fs , 1). Discussion In this experiment, participants rated both frequency and importance dimensions prior to giving distance estimations and route descriptions. The order of rating of dimensions was manipulated, and the results clearly indicate that the participants’ distance estimates and route descriptions are anchored by the first dimension they used to rate landmarks—that is, the first rating dimension dominates the retrieval process. The participants in the importance–frequency group gave longer distance estimates than did those in the frequency–importance group; in their route descriptions, with regard to percentage of route perspective versus percentage of survey perspective expressions, the participants in the two groups produced the same trend as in Experiment 1. General Discussion We set out to examine whether or not context affects retrieval of information from cognitive maps, using distance estimation and route description as dependent measures. The correlations between ratings for frequency and ratings for importance were significant for every participant tested, and a result of this was that the landmark pairs between conditions in each experiment and across all experiments were virtually identical. Any effect of condition on distance estimation or route description is therefore not attributable to differences in the landmark pairs used between conditions. The results across the experiments provide evidence that the perspective adopted by participants at retrieval does affect both dependent measures. With regard to distance estimation, although the participants were clearly sensitive to actual distance (given that actual distance and estimated distance correlated significantly for every participant), the perspective at retrieval affected the distance estimates given. In each experiment, rating the importance of the activities performed at landmarks prior to giving distance estimates resulted in larger distance estimates than when distance estimates were given after the same landmarks were rated for frequency of visitation.
Table 6 Mean Distance Estimations and Actual Distances (in Meters), and Standard Deviations, by Condition and Direction in Experiment 3
Distance Estimation Actual
Frequency–Importance High Low to Low to High M SD M SD 221 226 204 269 293 92 327 94
Importance–Frequency High Low to Low to High M SD M SD 401 454 395 308 326 112 302 103
390 Bugmann, Coventry, and Newstead Rating the importance of the activities performed at landmarks versus the frequency of visitation of the landmarks also affected the relative use of route and survey perspective expressions in the participants’ descriptions. The clearest results were found in Experiment 1, in which the importance group produced significantly more route perspective than survey perspective expressions, whereas the frequency group did not differ in the relative frequency of use of the two types of perspective expression. Although direction of estimation was included in the present experiments to control for possible asymmetry in distance estimation effects, no asymmetries were found. Thus, the results fail to replicate the asymmetry in distance estimation effects reported by Sadalla et al. (1980) and McNamara and Diwadkar (1997). Other studies have failed to find direction-of-estimation effects (e.g., Holding, 1992), and therefore it would appear that the direction effects occur only in some circumstances. One likely candidate to explain why direction effects are found in some studies and not in others is the method of measurement employed. In the present study, verbal estimates of route distances as traversed by participants were used, whereas in previous studies Euclidean distances measured by line scale estimates (Holyoak & Mah, 1982; Sadalla et al., 1980) or numerical estimates (McNamara & Diwadkar, 1997) were used. Furthermore, the present studies involved contextual manipulations different from those used in studies in which direction effects have been found. In the present experiments, the perspective at retrieval was manipulated, whereas in the previous distance estimation studies the order of landmarks was manipulated at retrieval but the perspective at retrieval was not. Given that both manipulations were used in the present experiments, it may be that the perspective-at-retrieval manipulation is more powerful than the order-of-landmarks manipulation on retrieval. The only hint of a direction effect appeared in the third experiment with route descriptions, when the time between the initial rating of importance/frequency and the measure was greatest (and therefore the initial perspective manipulation was at its weakest). Overall, these results are in line with theories of memory that point to a correspondence between encoding and retrieval processes (see, e.g., Tulving, 1983; Tulving & Thompson, 1973). Indeed, the results are similar to encoding results in which navigation learning of an environment is compared to map learning of the same environment (e.g., Taylor & Naylor, 2002; Taylor et al., 1999). Furthermore, the results go beyond previous possible explanations for retrieval effects. Recall that in the pilot experiment, in which we asked the participants to think aloud during the rating task, the participants in the importance condition produced no more words or mention of other landmarks in their descriptions than did the participants in the frequency condition, yet there were condition effects on distance estimation and on types of route perspective expressions produced. The only observable difference between groups in the pilot experiment was the number of actions referred to in the protocols. Thus, although the amount of information
cued about landmarks at retrieval may account for some effects in the literature (McNamara & Diwadker, 1997; Sadalla et al., 1979), it fails to deal with differences within experiments observed in the present study. One possible limitation of the present results is that the participants in the experiments were mostly female. Some gender differences have been observed in the cognitive map literature (e.g., Golledge, Dougherty, & Bell, 1995; Lawton, 1994; Montello, Lovelace, Golledge, & Self, 1999). For example, Montello et al., testing sex-related differences across a battery of tasks and measures, found that males performed better than females on measures of newly acquired spatial knowledge of places from direct experience (including route distance estimation). Hence, although some studies with measures similar to those used in the present experiments have not uncovered any gender differences (Taylor & Naylor, 2002; Taylor et al., 1999), one needs to be cautious with regard to whether the effects found may be gender specific. In conclusion, the present results indicate that perspective at retrieval affects the extent to which actions are cued at retrieval. It is likely that cognitive maps may not take on a single representational form (e.g., survey or route) but rather may be a composite of both types of representation, which allows flexibility of use and contextual manipulation. Alternatively, cognitive maps may be partial and incomplete representations that are more fully fleshed out when they are accessed. Learning about one’s environment over time is likely to lead to rich, flexible representations that can be accessed in different ways depending on context (Golledge & Spector, 1978). In the present study, the participants probably learned about their environments through navigation aided by maps. It is therefore likely that their cognitive maps of their environments involved either complete or partial representations of both survey and route information. Which type of information was accessed would have depended on the retrieval context. The present study pushes into sharp focus the influence of the conceptualization of landmarks that occurs prior to the retrieval of spatial information from cognitive maps. Thinking about the same landmarks in terms of actions performed at those places versus in terms of the number of times they have been visited affects judgments of distance and verbal description. These findings go beyond the implicit scaling model and other information retrieval accounts (see, e.g., Saddala et al., 1979) in that the present data showed contextual effects on the same landmarks presented in the same order. It would appear that implicit scaling is one of a wider range of types of retrieval effects, which merit much closer attention. These results have implications for investigation into cognitive maps and other forms of spatial representation. Not only does context at retrieval need to be investigated more, but researchers need to be careful to separate encoding from retrieval as possible explanations for effects under investigation. For example, in tests of acquisition of spatial knowledge, care must be taken to ensure that the task used for retrieval is not biased toward either sur-
Contextual Cues, Distance, and Cognitive Maps 391 vey responding or navigation responding. Just as retrieval is a central part of mainstream theories of memory, the relative neglect of retrieval (in comparison with encoding) in relation to cognitive maps may have narrowed the literature’s perspective of what is represented. Author Note Correspondence concerning this article should be addressed to K. R. Coventry, Cognition and Communication Research Centre, School of Psychology and Sport Sciences, Northumbria University, Newcastle Upon Tyne NE1 8ST, England (e-mail: kenny.coventry@northumbria .ac.uk). Note—This article was accepted by the previous editorial team, when Colin M. MacLeod was Editor. References Allen, G. L., & Kirasic, K. C. (1985). Effects of the cognitive organization of route knowledge on judgments of macrospatial distance. Memory & Cognition, 13, 218-227. Anderson, R. C., & Pichert, J. W. (1978). Recall of previously unrecallable information following a shift in perspective. Journal of Verbal Learning & Verbal Behavior, 17, 1-12. Burgess, N., Maguire, E. A., & O’Keefe, J. (2002). The human hippocampus and spatial and episodic memory. Neuron, 35, 625-641. Chapman, G. B., & Johnson, E. J. (2002). Incorporating the irrelevant: Anchors in judgments of belief and value. In T. Gilovich, D. Griffin, & D. Kahneman (Eds.), Heuristics and biases: The psychology of intuitive judgement (pp. 120-138). Cambridge: Cambridge University Press. Cohen, S., & Cohen, R. (1982). Distance estimates of children as a function of type of activity in the environment. Child Development, 53, 834-837. Curiel, J. M., & Radvansky, G. A. (1998). Mental organization of maps. Journal of Experimental Psychology: Learning, Memory, & Cognition, 24, 202-214. Decety, J., Jeannerod, M., & Prablanc, C. (1989). The timing of mentally represented actions. Behavioural Brain Research, 34, 35-42. Denis, M. (1997). The description of routes: A cognitive approach to the production of spatial discourse. Current Psychology of Cognition, 16, 409-458. Downs, R. M., & Stea, D. (1977). Maps in minds: Reflections on cognitive mapping. New York: Harper & Row. Engel, S. (1999). Context is everything: The nature of memory. New York: Freeman. Epley, N., & Gilovich, T. (2002). Putting adjustment back in the anchoring and adjustment heuristic. In T. Gilovich, D. Griffin, & D. Kahneman (Eds.), Heuristics and biases: The psychology of intuitive judgement (pp. 139-149). Cambridge: Cambridge University Press. Evans, G. W., & Pezdek, K. (1980). Cognitive mapping: Knowledge of real-world distance and location information. Journal of Experimental Psychology: Human Learning & Memory, 6, 13-24. Gauvain, M., & Rogoff, B. (1986). Influence of the goal on children’s exploration and memory of large-scale space. Developmental Psychology, 22, 72-77. Golledge, R. G., Dougherty, V., & Bell, S. (1995). Acquiring spatial knowledge: Survey versus route-based knowledge in unfamiliar environments. Annals of the Association of American Geographers, 85, 134-158. Golledge, R. G., & Spector, N. A. (1978). Comprehending the urban environment: Theory and practice. Geographical Analysis, 14, 305-325. Holding, C. S. (1992). Clusters of reference points in cognitive representations of the environment. Journal of Environmental Psychology, 12, 45-55. Holyoak, K. J., & Mah, W. A. (1982). Cognitive reference points in judgments of symbolic magnitude. Cognitive Psychology, 14, 328-352. Lawton, C. A. (1994). Gender differences in way-finding strategies:
Relationship to spatial ability and spatial anxiety. Sex Roles, 30, 765-779. Leiser, D., Tzelgov, J., & Henik, A. (1987). A comparison of map study methods: Simulated travel vs conventional study. Current Psychology of Cognition, 7, 317-334. Loftus, E. F., & Palmer, J. C. (1974). Reconstruction of automobile destruction: An example of the interaction between language and memory. Journal of Verbal Learning & Verbal Behavior, 13, 585-589. Magliano, J. P., Cohen, R., Allen, G. L., & Rodrigue, J. R. (1995). The impact of a wayfinder’s goal on learning a new environment: Different types of spatial knowledge as goals. Journal of Environmental Psychology, 15, 65-75. McKoon, G., Ratcliff, R., & Seifert, C. M. (1989). Making the connection: Generalized knowledge structures in story understanding. Journal of Memory & Language, 28, 711-734. McNamara, T. P., & Diwadkar, V. A. (1997). Symmetry and asymmetry of human spatial memory. Cognitive Psychology, 34, 160-190. Montello, D. R. (1991). The measurement of cognitive distance: Methods and construct validity. Journal of Environmental Psychology, 11, 101-122. Montello, D. R., Lovelace, K. L., Golledge, R. G., & Self, C. M. (1999). Sex-related differences and similarities in geographic and environmental spatial abilities. Annals of the Association of American Geographers, 89, 515-534. Nilsson, L.-G., Law, J., & Tulving, E. (1988). Recognition failure of recallable unique names: Evidence for an empirical law of memory and learning. Journal of Experimental Psychology: Learning, Memory, & Cognition, 14, 266-277. Perrig, W., & Kintsch, W. (1985). Propositional and situational representations of text. Journal of Memory & Language, 24, 503-518. Sadalla, E. K., Burroughs, W. J., & Staplin, L. J. (1980). Reference points in spatial cognition. Journal of Experimental Psychology: Human Learning & Memory, 6, 516-528. Sadalla, E. K., Staplin, L. J., & Burroughs, W. J. (1979). Retrieval processes in distance cognition. Memory & Cognition, 7, 291-296. Schacter, D. L., & Tulving, E. (Eds.) (1994). Memory systems. Cambridge, MA: MIT Press. Seifert, C. M., McKoon, G., Abelson, R. P., & Ratcliff, R. (1986). Memory connections between thematically similar episodes. Journal of Experimental Psychology: Learning, Memory, & Cognition, 12, 220-231. Sholl, M. J. (1987). Cognitive maps as orienting schemata. Journal of Experimental Psychology: Learning, Memory, & Cognition, 13, 615-628. Smith, S. M. (1988). Environmental context-dependent memory. In G. M. Davies & D. M. Thomson (Eds.), Memory in context: Context in memory (pp. 13-34). Chichester, U.K.: Wiley. Taylor, H. A., & Naylor, S. J. (2002). Goal-directed effects on processing a spatial environment: Indications from memory and language. In K. R. Coventry & P. Olivier (Eds.), Spatial language: Cognitive and computational perspectives (pp. 233-253). Dordrecht: Kluwer. Taylor, H. A., Naylor, S. J., & Chechile, N. A. (1999). Goal-specific influences on the representation of spatial perspective. Memory & Cognition, 27, 309-319. Taylor, H. A., & Tversky, B. (1996). Perspective in spatial descriptions. Journal of Memory & Language, 35, 371-391. Thorndyke, P. W., & Hayes-Roth, B. (1982). Differences in spatial knowledge acquired from maps and navigation. Cognitive Psychology, 14, 560-589. Tolman, E. C. (1948). Cognitive maps in rats and men. Psychological Review, 55, 189-208. Tulving, E. (1983). Elements of episodic memory. Oxford: Oxford University Press. Tulving, E., & Thompson, D. M. (1973). Encoding specificity and retrieval processes in episodic memory. Psychological Review, 80, 353-373. Notes 1. Throughout this article, we follow the common practice of using the term Euclidean, yet noting that in metric geometry this term does not always mean strictly straight-line distance (Montello, 1991).
392 Bugmann, Coventry, and Newstead 2. Twenty participants were asked to “think aloud” when rating a list of 22 landmarks either for the importance of the activities performed at each landmark (10 participants) or for how often they visited each landmark (10 participants) using the methodology subsequently used in Experiments 1–3. They were instructed to verbalize their ratings and to justify why they gave the ratings that they did. Each protocol was transcribed and coded blindly for number of words, number of other landmarks referred to, and number of action verbs used. Although the participants rating the importance of the activity performed at each landmark produced no more words in their protocols [t(19) 5 20.19, p . .05] and no more reference to other landmarks [t(19) 5 21.86, p . .05] than did those asked to rate the frequency of visitation to each place, they produced significantly more action verbs in their descriptions (M 5 3.4) than did those in the frequency group (M 5 1.9) [t(19) 5 22.79, p , .01], indicating that participants think about the actions they perform more frequently when thinking about importance of activity than when thinking about frequency of visitation. Examples of activities regarded as important included “doing gym and aerobic exercise” and “looking for the participants’ points board to sign up for experiments.” 3. We ran analyses for each experiment to make sure there was no difference in length of time on campus between conditions, and no significant differences were found between conditions for any of the individual experiments.
4. This scheme was subjected to internal validity using Cohen’s kappa as a measure of agreement. Twelve complete route descriptions chosen randomly from the pool of descriptions were given to two independent coders to categorize. The coders were asked to use the classification scheme as their guide for the categorization. There was a high level of agreement between coders (Cohen’s kappa 5 .78), indicating that the coding scheme could be used reliably. 5. We also computed the correlations between ratings of frequency and ratings of importance in Experiments 2 and 3, and, again, the correlations were significant for every participant. 6. Given that large distances are underestimated more than small distances (see, e.g., Montello, 1991), a 2 (group) 3 2 (direction of estimation) mixed ANOVA was run to ensure that there were no significant differences between conditions for actual distances between landmarks. There were no significant main effects or interactions. Similar analyses were run for Experiments 2 and 3, again revealing no significant differences between groups. Therefore, any subsequent results for distance ratio cannot be attributed to estimation differences as a function of actual distance. 7. Note that the actual Euclidean distances were measured from a scaled map of the campus (scale 5 1/1,250) by connecting the centers of the two buildings with a straight line. The measures of the actual route distances were the same as in Experiment 1.
Appendix Mean Frequencies and Percentage Use of Categories in Experiment 1 Category Subcategory Introduction of new Use of “there is” landmarks Description of visual scene Use of egocentric point of view Use of landmark’s point of view, allocentric coordinates Action prescriptions Proceed straight ahead without mention Proceed pseudodistance of landmarks Change of direction Maintain progress Change the current path Action prescriptions Aim at a specific landmark with mention of Use of a specific landmark landmarks Maintain progress on a specific landmark Change the current path Proceed past a landmark Reorientation at a specific landmark Description of Landmark identity landmarks Landmark physical features Landmark function Start position Destination/goal Total
Frequency Total % Use Items of Items 13 1.5 47 5.0 39 4.0 55 6.0 32 4.0 10 1.0 127 14.0 23 3.0 2 0.2 86 10.0 187 21.0 1 0.1 4 0.5 110 12.0 23 3.0 2 0.2
Importance Total % Use Items of Items 12 2.0 35 5.0
12 4 57 62 896
2 0 43 55 739
1.0 0.5 6.0 7.0 100.0
(Manuscript received June 17, 2004; revision accepted for publication January 3, 2006.)
60 24 21 18 105 22 7 79 150 3 2 85 11 5
8.0 3.0 3.0 2.0 14.0 3.0 1.0 11.0 20.0 0.5 0.5 11.0 1.5 1.0 0.5 0.0 6.0 7.0 100.0