Journal of Ecology 2009, 97, 18–22
doi: 10.1111/j.1365-2745.2008.01450.x
FORUM Blackwell Publishing Ltd
Beta diversity metrics and the estimation of niche width via species co-occurrence data: reply to Zeleny Michael Manthey1* and Jason D. Fridley2 1
Institute of Botany and Landscape Ecology, Ernst-Moritz-Arndt University, 17487 Greifswald, Germany; and 2Department of Biology, Syracuse University, Syracuse, NY 13244, USA
Summary 1. Zeleny (2008) demonstrated that the co-occurrence based assessment of species habitat specialization (introduced by Fridley et al. 2007) depends on the size of the species pool. To correct for the effect of the species pool on the estimation of species niche width, Zeleny suggested a modification of the original algorithm by replacing additive partitioning as a measure of beta diversity with Whittaker’s beta. 2. We used simulated data to show that the alternative index proposed by Zeleny (2008) will poorly represent the niche widths of species inhabiting a set of plots with a highly skewed distribution of local richness values. We therefore expand on Zeleny’s (2008) analysis by considering two additional metrics of beta diversity based on compositional similarity and by testing the performance of these indices under different local-regional richness relationships. 3. Synthesis. None of the four tested metrics of beta diversity produced unbiased estimates of niche width under curvilinear local-regional richness relationships. In this context, we provide additional guidance to potential users of co-occurrence based niche width estimates by specifying the conditions under which certain indices of beta diversity best represent niche width information. Key-words: additive partitioning, beta diversity, ecoinformatics, Jaccard similarity, multiple-site similarity, niche breadth estimation, Whittaker’s beta
Zeleny (2008) has shown that the co-occurrence based estimation of species specialization introduced by Fridley et al. (2007) is influenced by variation in the size of the species pool along an environmental or compositional gradient. To correct for this sensitivity to species pool variation, he suggests replacing the original measure of beta diversity that is based on additive partitioning of diversity components (e.g. Lande 1996; Veech et al. 2002) with Whittaker’s beta (Whittaker 1960). Zeleny’s observation is an important one that we have independently uncovered in recent cross-continental comparisons of realized niche widths of temperate trees (Manthey 2007). Because variation in species pool size is a common characteristic in community data that cover a wide variety of habitats, and co-occurrence based estimation of species specialization should be independent of species pool attributes, we here briefly expand on Zeleny’s (2008) analysis to provide additional guidance to potential users of co-occurrence based niche width estimates.
*Correspondence author. E-mail:
[email protected]
Alternative measures of beta diversity The calculation of the generalist-specialist metric proposed by Fridley et al. (2007), originally expressed as ‘theta’, is based on a measure of beta diversity calculated from a fixed number of randomly chosen plots in which a focal species occurs. Since the origin of the concept (Whittaker 1960) ecologists have used a large number of different measures to investigate the variation in beta diversity (Wilson & Shmida 1984; Koleff et al. 2003). This variety reflects differences in the basic properties of each statistic and researchers have repeatedly warned that the relevance of any metric depends on the research objective as well as properties of the community data (Koleff et al. 2003). Fridley et al. (2007) applied additive partitioning as a measure of beta diversity (Lande 1996): β a = γ − μ(α ) where γ is the total number of species encountered in a random sample of plots and μ(α) is mean alpha diversity (mean plot richness). Zeleny (2008) replaced this measure by Whittaker’s beta (Whittaker 1960):
© 2008 The Authors. Journal compilation © 2008 British Ecological Society
Beta diversity and estimation of niche width 19 βw = γ /μ(α ) Zeleny showed that Whittaker’s approach of multiplicative partitioning is independent of variation in species pool size under the condition that plot richness is a linear function of the species pool. Although we agree that there are circumstances where βw is a better generalist-specialist metric than βa, we demonstrate here that use of βw is not appropriate in some cases. In particular, βw will poorly represent the niche widths of species inhabiting plots with a highly skewed distribution of local richness values. For example, in the data set from the south-eastern US used in Fridley et al. (2007), the flooded-habitat specialist Taxodium ascendens was unrealistically highly ranked in the habitat generalist-specialist list when βw was used. The species is common to the south-eastern Coastal Plain, where it typically grows in species-poor swamp forests (Christensen 2000). In most of the plots that contain T. ascendens the species co-occurs with a few other specialized trees adapted to continuous high water levels. Additionally, it occurs rarely in low abundance in nearby species-rich floodplain forests that are flooded only periodically. Thus, the plot richness distribution of the species is strongly positively skewed. Without these scattered occurrences in adjacent habitats, γ and μ (α), as well as the resulting βw, would be very low. The few occurrences in the rich floodplain forests, however, contribute strongly to γ, whereas mean alpha is hardly affected by the few rich species plots, which leads to a strong increase in βw. Because we expect that specialists from speciespoor habitats will often have positive skewness in plot richness distribution, the resulting correlation between plot richness and a generalist-specialist metric based on βw in empirical data can be negative and decouple the beta diversity metric from actual niche width. Because neither βa nor βw are universal solutions to estimating niche widths from co-occurrence data, we consider here two additional metrics of beta diversity based on compositional similarity. The simplest such approach involves the average of pairwise similarities (e.g., Lennon et al. 2001; Condit et al. 2002) of plots containing a focal species. Here we evaluate the suitability of Jaccard’s similarity index, noting that results using the Sørensen index are qualitatively identical. In addition, we use the more recent advance of ‘multiple-site’ similarity measures that take into account species shared by more than two sites and avoid the problem of covariance between pairwise similarities (Diserud & Ødegaard 2007). Of two recent suggestions of multiple-site similarity measures, we consider only the multiple Simpson index (Baselga et al. 2007), as the multiple Sørensen index is a simple linear function of βw (Diserud & Ødegaard 2007).
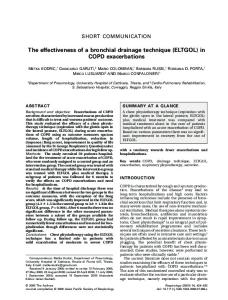
Performance of different beta diversity metrics under simulated species pool variation We simulated a gradient in species pool size by constructing a coenocline of 300 species whose optimum locations followed an exponential distribution along a single dimension of 5000 units (Fig. 1a–c). Niche shapes were constructed
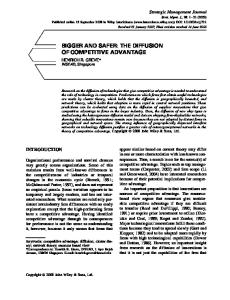
randomly using a Beta function as in Fridley et al. (2007). To focus on the sensitivity of the co-occurrence based estimation of species specialization to local richness gradients we used fixed niche widths of 1000 gradient units and restricted species optimum locations between 500 and 4500 gradient units. Species whose curves were truncated by gradient ends were excluded from further analysis. We randomly located 1000 plots along the gradient and ‘sampled’ species from each plot according to either a linear or curvilinear relationship between local and regional richness (Fig. 1d). While a linear relationship might be more common (e.g. Cornell & Lawton 1992; Caswell & Cohen 1993; Cornell & Karlson 1996), a curvilinear relationship may arise simply from small sampling scales or if perspecies stochastic extinction rates are higher than colonization rates (He et al. 2005). For the linear local-regional relationship we randomly sampled 50% of the species pool based on the simulated probability of occurrences; for the curvilinear relationship we fixed the random sample at 50 individuals. To demonstrate the effect of strongly skewed plot richness distributions on the estimation of niche width, we added five species with symmetrical, bimodal response curves to the gradient. While the total niche widths are equal to the other species, the parameters for the two modes vary regularly to produce different plot richness distributions (Table 1, Fig. 1c). For each sampling design we applied the four selected measures of beta diversity (βa, βw, multiple Simpson and Jaccard’s similarity), expressing the two similarity indices as dissimilarities. All calculations were performed in the R statistical environment (R Development Core Team 2008). The modified algorithm for the simulation and the estimation of habitat specialization including all measures of beta diversity can be found in Supporting Appendices S1 and S2. Figure 2 presents the correlation between mean plot richness and estimated niche widths, expressed by the scores of the respective measures of beta diversity, for the two sampling designs. Because niche widths are fixed in the simulated coenocline there should be no correlation between niche widths and mean plot richness. None of the four selected measures of beta diversity could reproduce such a pattern under the condition of a curvilinear local-regional species richness relationship (Fig. 2b,d,f,h). The lowest correlation coefficients, as well as the flattest slopes, are realized with βw and multiple Simpson (Fig. 2b,f ). However, for βw, the distortion of the bimodal species from the regression line is relatively high (Fig. 2b). With a linear local-regional richness relationship the correlation coefficients are low for the relation between mean plot richness and scores for βw, multiple Simpson, and Jaccard (Fig. 2a,e,g), while additive partitioning (βa) is strongly affected by the richness of plots (Fig. 2c). With increasing positive skewness of the plot richness distribution and decreasing mean plot richness, the βw scores of the bimodal species rise strongly (Fig. 2a, Table 1).
Conclusion As shown by Zeleny (2008), additive partitioning is strongly affected by species pool variation (resulting in local richness
© 2008 The Authors. Journal compilation © 2008 British Ecological Society, Journal of Ecology, 97, 18–22
20
M. Manthey & J. D. Fridley
Fig. 1. Characteristics of the simulation scenario with fixed niche widths (i.e., all niche widths are identical) and exponential distribution of species optima along the gradient: distribution of species optima (a), resulting changes in the size of species pool (b), location of response curves of five bimodal species (c), and local-regional species richness relationships for two sampling designs (d).
Table 1. Parameters of response curves of five bimodal species, skewness of plot richness distribution and mean plot richness resulting from two sampling designs with different local-regional species richness relationship. Skewness was calculated with the R package ‘e1071’ Local-regional richness relationship Linear Left mode
Right mode
Species
Width
Amplitude
Width
Amplitude
Skewness of richness distribution
1 2 3 4 5
900 700 500 300 100
30 25 20 15 10
100 300 500 700 900
10 15 20 25 30
–0.784 –0.203 0.141 0.839 2.485
gradients) under both linear and curvilinear local-regional richness relationships and should generally be replaced by other measures of beta diversity when using co-occurrences to estimate niche widths. Zeleny’s (2008) proposed alternative, βw, performs well with continuous species richness gradients
Curvilinear
Mean plot richness
Skewness of richness distribution
Mean plot richness
61.7 47.1 45.0 34.9 14.1
–1.125 –0.030 1.004 0.742 1.343
28.0 23.4 16.5 21.0 12.2
but is sensitive to species from species-poor habitats that have strongly skewed plot richness distributions (filled dots in Fig. 2a), consistent with our experience of using βw to describe the niche widths of south-eastern US tree species of wellknown habitat affinities. In contrast, co-occurrence metrics
© 2008 The Authors. Journal compilation © 2008 British Ecological Society, Journal of Ecology, 97, 18–22
Beta diversity and estimation of niche width 21
Fig. 2. Results of the application of four measures of β-diversity to the simulation scenario with two contrasting sampling designs. All figures display the correlation between mean plot richness and calculated generalist-specialist scores. Figures in the left column display results for the sampling design with linear local-regional species richness relationship and figures in the right column show results for the curvilinear relationship. Measures of beta diversity: βw (a, b), βa (c, d), multiple Simpson (e, f ), Jaccard (g, h). The large filled dots in each figure represent the respective scores for five bimodal species. © 2008 The Authors. Journal compilation © 2008 British Ecological Society, Journal of Ecology, 97, 18–22
22
M. Manthey & J. D. Fridley
based on compositional similarity were robust to richness gradients and species of strongly skewed or bimodal distribution (Fig. 2e,g). Our recommendations for choosing an appropriate beta diversity index in the estimation of relative niche widths from co-occurrence data can be summarized as follows. First, no beta diversity metric is immune to problems that arise when a community is either highly saturated ecologically (e.g., when competition strongly decouples realized and fundamental niches) or ‘appears’ saturated due to a very small sample of individuals (see Fridley et al. 2006; Palmer et al., in press). In such cases co-occurrence data are a poor descriptor of habitat affinities, and experimental data are required to delimit niche widths. Second, where plot richness distributions among species are non-skewed, βw, along with similarity indices, provide a more robust description of relative niche widths than the original βa used by Fridley et al. (2007). A more usual case, however, is that at least some species will exhibit strongly skewed richness distributions (see the example of T. ascendens mentioned above) that βw cannot handle but are relatively inconsequential to metrics based on similarity. We therefore advocate that the original formulation of co-occurrence based estimates of niche widths based on βa be replaced with similarity indices like pairwise Jaccard or more recent multisite similarity techniques. Like the original Simpson index the multiple Simpson approach ignores complete nestedness as a difference between sites (Lennon et al. 2001; Koleff et al. 2003, Baselga et al. 2007). Thus, the choice of similarity index will depend in part on whether researchers choose to interpret nestedness patterns as ‘turnover’ in the sense of habitat variation.
References
Diserud, O.H. & Ødegaard, F. (2007) A multiple-site similarity measure. Biology Letters, 3, 20–33. Fridley, J.D., Peet, R.K., van der Maarel, E. & Willems, J.H. (2006) Integration of local and regional species-area relationships from space-time species accumulation. The American Naturalist 168, 133–143. Fridley, J.D., Vandermast, D.B., Kuppinger, D.M., Manthey, M. & Peet, R.K. (2007) Co-occurrence based assessment of habitat generalists and specialists: a new approach for the measurement of niche width. Journal of Ecology, 95, 707–722. He, F., Gaston, K.J., Connor, E.F. & Srivastava, D.S. (2005) The local-regional relationship: Immigration, extinction, and scale. Ecology, 86, 360–365. Koleff, P., Gaston, K.J. & Lennon, J.J. (2003) Measuring beta diversity for presence-absence data. Journal of Animal Ecology, 72, 367–382. Lande, R. (1996) Statistics and partitioning of species diversity, and similarity among multiple communities. Oikos, 76, 5–13. Lennon, J.J., Koleff, P., Greenwood, J.J.D. & Gaston, K.J. (2001) The geographical structure of British bird distributions: diversity, spatial turnover and scale. Journal of Animal Ecology, 70, 966–979. Manthey, M (2007) Cross-continental niche comparison of large woody species: does competition matter? Cultural Landscapes – Changing Landscapes – The International Association for Vegetation Science: Delegate Handbook of the 50th Annual Symposium (eds H. Thomas et al.), p. 17. The University of Swansea. Palmer, M., McGlinn, D. & Fridley, J.D. (in press) Artifacts and artifictions in biodiversity research. Folia Geobotanica. R Development Core Team (2008) R: a Language and Environment for Statistical Computing. R Foundation for Statistical Computing, Vienna, Austria. Available at: http://www.r-project.org/. Veech, J.A., Summerville, K.S., Crist, T.O. & Gering, J.C. (2002) The additive partitioning of species diversity: recent revival of an old idea. Oikos, 99, 3 – 9. Whittaker, R.H. (1960) Vegetation of the Siskiyou mountains, Oregon and California. Ecological Monographs, 30, 279–338. Wilson, M.V. & Shmida, A. (1984) Measuring beta diversity with presenceabsence data. Journal of Ecology, 72, 1055–1064. Zeleny, D. (2008) Co-occurrence based assessment of species habitat specialization is affected by the size of species pool: reply to Fridley et al. (2007). Journal of Ecology, doi: 10.1111/j.1365-2745.2008.01394.x. Received 27 June 2008; accepted 16 September 2008 Handling Editor: David Gibson
Supporting information
Baselga, A., Jiménez-Valverde, A. & Niccolini, G. (2007) A multiple-site similarity measure independent of richness. Biology Letters, 3, 642 – 645. Caswell, H. & Cohen, J.E. (1993) Local and regional regulation of species-area relations: a patch-occupancy model. Species diversity in ecological communities (eds R.E. Ricklefs & D. Schluter), pp. 99–107. The University of Chicago Press, Chicago. Christensen, N.L. (2000) Vegetation of the Southeastern Coastal Plain. North American Terrestrial Vegetation (eds M.G. Barbour & W.D. Billings), pp. 397– 448. Cambridge University Press, Cambridge. Condit, R., Pitman, N., Leigh, E.G. Jr., Chave, J., Terborgh, J., Foster, R.B., Nunez, P., Aguilar, S., Valencia, R., Villa, G., Muller-Landau, H.C., Losos, E. & Hubbell, S.P. (2002) Beta-diversity in tropical forest trees. Science, 295, 666 – 669. Cornell, H.V. & Karlson, R.H. (1996) Species richness of reef-building corals determined by local and regional processes. Journal of Animal Ecology, 65, 233 – 241. Cornell, H.V. & Lawton, J.H. (1992) Species interactions, local and regional processes, and limits to the richness of ecological communities: a theoretical perspective. Journal of Animal Ecology, 61, 1–12.
Additional Supporting Information may be found in the online version of this article: Appendix S1. R code implementing the generalist-specialist metric with five alternative measures of beta diversity. Appendix S2. R code for simulated coenocline for testing different beta-diversity measures in the generalist-specialist metric. Please note: Wiley-Blackwell are not responsible for the content or functionality of any supporting materials supplied by the authors. Any queries (other than missing material) should be directed to the corresponding author for the article.
© 2008 The Authors. Journal compilation © 2008 British Ecological Society, Journal of Ecology, 97, 18–22