An olivine fabric database: an overview of upper mantle fabrics and seismic anisotropy Walid Ben Ismaı¨l, David Mainprice * Laboratoire de Tectonophysique, ISTEEM, CNRS (UMR 5568)=Universite´ de Montpellier II, F-34095 Montpellier cedex 5, France Accepted 24 June 1998
Abstract We present a unique database of 110 olivine petrofabrics and their calculated seismic properties. The samples come from a variety of the upper mantle geodynamic environments (ophiolites, subduction zones, and kimberlites) with a wide range of micro-structures. A phenomenological relationship is established between P- and S-wave seismic anisotropy and the degree of crystal alignment (fabric strength). Seismic anisotropy increases rapidly at low fabric strength before reaching a near saturation level of 15 to 20% for P-waves and 10 to 15% for S-waves. Despite a large variation in the symmetry of fabric patterns, the average seismic properties of the different fabric, micro-structural and geodynamic settings have similar anisotropies in both magnitude and symmetry. Hence it would seem possible to determine some measure of fabric strength from seismic anisotropy if the dimensions of the anisotropic region are known, but not geodynamic environment or details of the petrofabric pattern. A simple pattern of seismic anisotropy characterises the average sample of the database, which has the following features: the polarisation plane of the fastest S-wave is parallel or sub-parallel to the foliation plane; the maximum shear wave splitting is parallel to the Y structural direction (in foliation plane and normal to the lineation); the maximum of the P-wave velocity is parallel to the high concentration of [100] axes, which is sub-parallel to the lineation. The [100] orientation distribution has the greatest influence on the P-wave seismic anisotropy. The [100] and [001] orientation distributions have the greatest influence on the symmetry of S-wave anisotropy, although the magnitude of anisotropy is influenced by the distribution of all three principal axes. Although the database only contains olivine petrofabrics, this statistical study clearly shows that seismic anisotropy can be used to deduce the orientation of the structural frame in the upper mantle. 1998 Elsevier Science B.V. All rights reserved. Keywords: lattice preferred orientation (LPO); olivine deformation; rock fabric; seismic anisotropy; SKS-waves
1. Introduction The upper mantle is known to be seismically anisotropic from azimuthal anisotropy of Pn velocities in the oceanic upper mantle (Hess, 1964; Raitt et al., 1969; Shearer and Orcutt, 1986) and polariŁ Corresponding
sation anisotropy in long-period surface waves (e.g. Anderson, 1961; Aki and Kaminuma, 1963; Nataf et al., 1984). The role of this anisotropy has become increasingly important in understanding the evolution of the upper mantle. Seismic anisotropy in the upper mantle is due to the elastic anisotropy of the volumetrically dominant phases olivine and orthopyroxene, and the strong statistical alignment of their crystal axes or lattice-preferred orientation (LPO) (e.g.
W.B. Ismaı¨l, D. Mainprice / Tectonophysics 296 (1998) 145–157
Nicolas and Christensen, 1987). Recent investigations of teleseismic shear-wave splitting (Vinnik et al., 1984, 1989; Silver and Chan, 1988) and petrophysical studies (Mainprice and Silver, 1993; Barruol and Mainprice, 1993; Weiss and Siegesmund, 1998) have shown that relationships between petrofabric and anisotropic shear wave seismic properties allow the determination of the directions of plastic flow, opening the way for tectonic studies of the upper mantle. The above petrofabric studies are restricted to a small number of samples. For decades LPO has been used as a structural indicator of shear sense in plastically deformed rocks (e.g. Nicolas et al., 1973; Schmidt and Casey, 1986). The 230 petrofabrics used in this paper are from samples of ophiolites, subduction zones, and kimberlites, with various microstructures, which have been measured over the last 25 years by past and present members of our lab (see Table 1). In order to study the seismic properties of different geodynamical contexts and to evaluate the influence of the deformation on the seismic properties we present here a compilation of this unique olivine petrofabrics database and related seismic properties. First, we describe the numerical methods to quantify the petrofabric strength and calculation of the seismic properties from the petrofabric. Secondly, we discuss the different parameters which influence the seismic anisotropy. Finally, we compare the averages
for the different geodynamics contexts and discuss the implications for the interpretation of seismic data.
2. Methodology In order to characterise the LPO, we need to evaluate the fabric strength and the distribution density of the principal crystallographic axes. To quantify petrofabrics (see Bunge, 1982 for further details) using the original universal stage data we defined an orientation matrix g which describes the rotation of the crystal from some standard orientation (e.g. structural reference frame — lineation X, pole to foliation Z ) to its measured orientation. We used the Orientation Distribution Function (ODF) (Bunge, 1982) to describe the complete crystal orientation. This mathematical representation of the LPO allows us to define the fabric strength (Bunge, 1982) as: Z J D f .g/2 dg where J is the index (a dimensionless number), f .g/ is the density in the ODF at orientation g, and dg D d'1 d d'2 sin =8³ 2 , where .'1 ; ; '2 / are the Euler angles (using the definition given by Bunge, 1982). The J-index has a value of 1 for a random fabric and a value of infinity for a single crystal. However, the J-index has a maximum of about 250
Table 1 Percentage of samples of each geodynamic environment in the database, micro-texture and related proportion in each geodymanic and the geographical localisation of the samples and the respective references Geodynamic environment of samples
Percentage of samples
Micro-structure and respective percentage
Geographic zone and reference of the original works
Canadian Cordillera and Alaska (Shaocheng et al., 1994)
Subduction zone
12.7
W.B. Ismaı¨l, D. Mainprice / Tectonophysics 296 (1998) 145–157
in our calculations because of the truncation of the spherical harmonic series at an expansion of 22. A pole figure can be analytically defined by the density of crystallographic orientation in any direction of the structural reference frame, and is described by the fundamental relationship of texture: Z 1 f .g/d Ph i .y/ D 2³ h i ky where h i is a crystallographic direction corresponding to the normal of a low-index lattice plane with Miller indices h 1 , h 2 , h 3 and d a unit element of solid angle in the unit hemisphere of the projection. In order to evaluate how many single-crystal measurements are needed to accurately represent fabric strength, the fabric strength versus the number of measured grains (Fig. 1) has been plotted. This figure clearly shows that one requires at least 100–150 grains to be measured to stabilise the fabric strength. When 50 grains are measured, only 60% of the full fabric strength are quantified and between 85% and 95% with 100 grains. In the last 20 years, 230 fabrics were measured in our laboratory, but the condition that at least 100 grains were measured was fulfilled by 110 samples. These 110 samples were selected for the present study of seismic anisotropy.
147
The elastic properties of the polycrystal may be calculated by integration of the anisotropic single crystal elastic properties over all crystallographic orientations present in the polycrystal (see Mainprice and Humbert, 1994 for further details). Measurements of the Twin Sisters Dunite by Crosson and Lin (1971) have shown that the seismic velocities calculated with the Voigt average give the closest agreement between velocities calculated using petrofabric data and laboratory measurements, and hence the Voigt average has been used in all calculations presented here. Although the choice of the method used for estimating the polycrystalline elastic constants is important for velocity studies it is of secondary importance for anisotropy studies as one is only dealing with relative values. To evaluate the seismic anisotropy, the convention of Mainprice and Silver (1993), has been used. Anisotropy of the P-waves (δVp ) is defined as percentage by 200 .Vp;max Vp;min /=.Vp;max C Vp;min /, and anisotropy of the S-waves .δVs / is defined in a similar way. The seismic anisotropy of the upper mantle is an average of the contributions of the different mineral phases (see Nicolas and Christensen, 1987 for a review). At the present time our database only contains data on olivine, which is the volumetrically dominant phase (70%) in the upper mantle. The effect of additional phases (e.g. orthopyroxene and garnet) will be to reduce the overall seismic anisotropy but does not change the anisotropy patterns (e.g. Mainprice and Silver, 1993; Barruol and Mainprice, 1993). All seismic calculations have been carried out using the single crystal elastic constants of olivine given by Kumazawa and Anderson (1969) at upper oceanic mantle temperature (1000ºC) and pressure (300 MPa), where most of the samples are situated. The derivatives of elastic stiffness dCi j =dT and dCi j =dP are linear, therefore the P–T conditions effect the velocity values, but leave the anisotropy unchanged.
3. The database 3.1. Fabric strength and seismic properties Fig. 1. Relationship between the fabric strength (J-index) and the number of measured grains. The fabric strength stabilises after 100 measured grains.
The variation of seismic properties of the upper mantle are controlled by the modal composition, the orientation of the structural frame and the strength
148
W.B. Ismaı¨l, D. Mainprice / Tectonophysics 296 (1998) 145–157
of lattice-preferred orientation (e.g. Birch, 1961; Babuska, 1972; Nicolas et al., 1973; Christensen and Lundquist, 1982; Mainprice and Silver, 1993). As we cannot measure the strain of the naturally deformed samples, the fabric strength (J-index) is used to evaluate the influence of the LPO on the seismic properties. The LPO is the manifestation of plastic deformation, dynamic recrystallisation, and annealing (e.g. Nicolas and Poirier, 1976). The J-index cannot be used to discriminate between the different processes. Mainprice and Silver (1993) showed that the J-index increases with increasing axial strain using the experimental data of Nicolas et al. (1973), and hence to a first approximation it can be used as an indicator of plastic strain. For all our olivine aggregates, the fabric strength varies between 3.2 and 27.0, with a mean value of 7.8 and a standard deviation of 4.5. The seismic anisotropy of P-waves varies between 4.0% and 21.4%, with a mean value of 12.2% and a standard deviation of 3.9. The seismic anisotropy of S-waves varies between 3.3% and 17.4% with a mean value of 9.4% and a standard deviation of 2.6 (Fig. 2). A diagram showing the seismic properties as a function of fabric strength (Fig. 2) displays an exponential relationship between the J-index and seismic anisotropy of both P-waves and S-waves.
Fig. 2. Relationship between seismic anisotropy and the fabric strength for Vp and for Vs anisotropy for 110 olivine aggregates. The exponential relationship for the P- and S-waves suggests a saturation in naturally deformed olivine of the J-index versus the seismic anisotropy (Vp or Vs ).
3.2. Micro-structure and seismic properties Boullier and Nicolas (1975) and Mercier and Nicolas (1975) established a classification of microstructures according to the degree of plastic deformation. In their scheme based on the micro-structure of olivine, increasing deformation is indicated by the number of different generations of grain shape, grain size, grain boundaries and intra-crystalline deformation. Using this classification, the samples in the database have been assigned to a micro-structural type based on the original descriptions given by var-
Fig. 3. Relationship between Vp (A) and Vs (B) seismic anisotropy and the fabric intensity (J-index) for the different micro-structures. No clear relationship is apparent except that grain growth micro-structures have very strong fabrics.
W.B. Ismaı¨l, D. Mainprice / Tectonophysics 296 (1998) 145–157
149
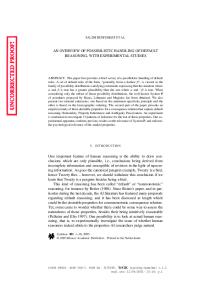
Fig. 4. Characteristic LPO patterns, (010)[100] slip system (A), (010)[100] slip system (B), (0kl)[100] slip system (C), and a weak LPO (D). All crystallographic pole figures and seismic velocities are plotted in the structural frame .X Y Z /, where X is the lineation, Z is the pole to foliation and Y is normal to the lineation in the foliation plane. Contours are in multiples of uniform distribution.
150
W.B. Ismaı¨l, D. Mainprice / Tectonophysics 296 (1998) 145–157
ious members of our laboratory. The most abundant micro-structural type in the database is the porphyroclastic texture (see Table 1). The micro-structural classification allows us to evaluate the influence of the plastic deformation on the seismic properties. In Fig. 3, the relationship between the P- and S-wave seismic anisotropy and the fabric strength for the different micro-structures has been plotted. It should be noted that the major part of this database has been collected for kinematic (shear sense) studies, which may explain why fabric strengths of less than J D 5 are poorly represented. The porphyroclastic samples cover almost the entire range of fabric strength and seismic anisotropy. Samples displaying an ‘exaggerated grain growth’ have a strong fabric strength and a strong seismic anisotropy. These samples are dunites from the transition zone in the Oman ophiolite, a region which is characterised by important fluid percolation (Boudier and Nicolas, 1995). These dunite samples represent a restricted region of the upper mantle beneath mid-oceanic ridges and are unlikely to be representative of the deep upper mantle. For the other micro-structures there is no obvious systematic distribution in the Vp and Vs plots (Fig. 3). There is no clear relationship between the micro-structural types and the seismic properties. 3.3. Fabric pattern and seismic properties The database shows a large variation of fabric patterns. Four types of fabric pattern symmetry used to illustrate the database. Type 1 (Fig. 4A) is characterised by a point maximum distribution of [100], [010] and [001] parallel to the X (lineation), Z (pole to foliation) and Y structural directions, respectively. Type 2 (Fig. 4B) is the partial ‘fibre texture’ (Bunge, 1982) which has axial symmetry with the [100] as a rotational axis of symmetry with [010] and [001] forming girdles in the .Y Z / structural plane normal to the lineation. This type may have maxima of [010] and [001] parallel either to the Y and Z directions as in Fig. 4B, or to the Z and Y directions, respectively. Type 3 (Fig. 4C) has girdles of all three
pole figures, with [100] forming a girdle in the plane .XY /. Another type of ‘fibre texture’ is represented in type 4 (Fig. 4D), with [010] as symmetry axis parallel to the foliation pole .Z /. We may classify these fabric types by the crystallographic axes which are found parallel to the lineation .X/ and normal to the foliation .Z /. In this classification [X] : [Z ] type 1 is [100] : (010), type 2 is [100] : (0kl), type 3 is [100][001] : (010) and type 4 is [100] : (010). Notice that in all cases there is a strong alignment of [100] axes parallel or sub-parallel to X. Olivine single-crystal P-waves anisotropy exhibits a relationship with the principal crystallographic axis (Fig. 5A). The maximum, intermediate and minimum P-velocity are respectively parallel to the [100], [001], and [010] axes. The seismic properties corresponding to the various LPO types (Fig. 5) show a good correspondence between the maximum concentrations of the [100] axes and the maximum P-wave velocities, as described by Birch in 1961. Dispersion of the [100] axes induces a decrease in the P-wave anisotropy (Fig. 5D). The maximum P-wave velocity is a good proxy for the lineation. A dispersion of the [010] and [001] axes in the .Z Y / plane introduces a low anisotropy in this plane and it should be the slower plane for the propagation of the P-waves (Fig. 5C). The orientation of the [010] and [001] has an important effect on the minimum P-wave velocities patterns. The birefringence patterns are much more complicated, the maximum olivine single-crystal S-wave splitting (0.9 km=s or 18.1%) is in a direction between the [100] and [001] axes (Fig. 5A). When the olivine [001] axis forms a girdle in the .Z Y / plane (Fig. 4B), the resulting δVs (Fig. 5C) has two maxima girdles on each side of the [001] girdle at approximately 45º to the lineation .X/. For the other fabrics types the δVs maximum is parallel to the Y structural direction. The dispersion of the [100] and [001] axes induces a decrease in the S-wave splitting (Fig. 5D). There is a correlation between the orientation of the [100] and [001] axes and the maximum of the shear wave splitting.
Fig. 5. Seismics properties of the most characteristic LPO patterns in Fig. 4. The single olivine crystal (A), (010)[100] slip system (B), (010)[100] slip system (C), (0kl)[100] slip system (D), and a weak LPO (E). The dispersion of the [100] axes reduce the P-waves seismic anisotropy and the [001] axes orientation have an important effect on the shear wave splitting patterns.
W.B. Ismaı¨l, D. Mainprice / Tectonophysics 296 (1998) 145–157
151
152
W.B. Ismaı¨l, D. Mainprice / Tectonophysics 296 (1998) 145–157
Fig. 6. Relationship between seismic anisotropy and the density of the three principal crystallographic axes (see text for details of calculation) for Vp (A) and for Vs (C) anisotropy; exponential curve fit for the crystallographic densities (B) and (D) as a function of the seismic properties. The [100] have a greatest influence on the seismic properties.
The direction of polarisation of the fastest S-wave is parallel to the olivine [100] axis. Whatever the orientation of the propagation direction, the polari-
sation of the fastest S-wave should give information about the orientation of the foliation plane .XY /. Strictly speaking the polarisation is parallel to the
W.B. Ismaı¨l, D. Mainprice / Tectonophysics 296 (1998) 145–157
maximum concentration of [100] axes which is not exactly parallel to the lineation. The orientation of the polarisation plane of the fastest S-wave systematically marks the orientation of the great circle containing the maximum concentration of [100], for all the fabric patterns (Fig. 5). In order to quantify the contribution of the different crystallographic axes on the seismic anisotropy, we define the maximum density distribution of the different crystallographic axes as multiples of a uniform distribution. In the database, the [100] axis maximum density varies between 3.0 and 19.0, with a mean value of 7.7 and a standard deviation of 3.8. The [010] maximum density varies between 4.0 and 15.0, with a mean value of 6.9 and a standard deviation of 2.7. The [001] maximum density varies between 5.0 and 10.0, with a mean value of 5.3 and a standard deviation of 1.9. In Fig. 6A,C, the relationship between the maximum density of the crystallographic axes and the seismic anisotropy for the P-waves and S-waves has been plotted. The seismic anisotropy of P-waves (Fig. 6B,D) and the [100] axes maximum densities have a trend similar to the J-index. The [010], [010] and [001] maximum densities have a similar trend to the J-index for the S-waves. These trends are in agreement with the LPO pattern observations: increasing alignment of the [100] axes induces an increase of the P-wave seismic anisotropy, whereas the orientation of the [010] and [001] axes have only a secondary effect. Although the trend is observed for S-wave seismic anisotropy, it is clear that all three axes influence the magnitude of S-wave anisotropy. 3.4. Geodynamic environments and seismic properties As the samples in the database come from different geodynamic environments we can seek to characterise the seismic signatures of these environments. The different geodynamic environments have been plotted (Fig. 7) as a function of the P- and S-wave seismic anisotropies versus fabric strength. The J-index does not show any coherent variation as a function of the geodynamic environment (Fig. 7). This conclusion may be partly biased by the fact that 69.4% of the samples come from a fast spreading ridge (see Table 1). The calculated mean seismic
153
Fig. 7. Relationship between Vp (A) and Vs (B) seismic anisotropy and the fabric intensity (J-index) for various geodynamic environments. There is no systematic difference between the geodynamic environments on the basis of seismic anisotropy and the fabric strength (J-index).
properties of the different geodynamic contexts show little difference between the various environments (see Table 2 for the average elastic constants), the maximum P-wave velocity of about 8.5 km=s, is systematically close to the lineation .X/ (Fig. 8) and the minimum P-wave velocity is close to the pole to foliation plane .Z /. The P-wave anisotropy is very similar for the different geodynamic environments; it varies between 10.6%, for the mean sample of subduction zone volcanism, to 8.2% for the mean sample of xenoliths from kimberlites. For the S-waves the minimum shear wave splitting region is close to lineation .X/ in all samples. There is a slight tendency for the minimum value to be
154
W.B. Ismaı¨l, D. Mainprice / Tectonophysics 296 (1998) 145–157
W.B. Ismaı¨l, D. Mainprice / Tectonophysics 296 (1998) 145–157 Table 2 Elastics constants .Ci j / in GPa of an average of the total database (110 samples), of an average of 72 olivine aggregates from peridotites of fast spreading ridges, of an average of 13 olivine aggregates from xenoliths brought up by subduction volcanism, and of an average of 17 olivine aggregates from xenoliths in kimberlitic eruptions
slightly inclined with respect to the lineation in the XY plane. The maximum shear wave splitting region is close to the Y structural direction, being slightly spread out in the XY plane. Whatever the orientation of the propagation direction, the polarisation of the fast S-wave should give information about the orientation of the foliation plane .XY /. 3.5. Total database average seismic properties The average seismic anisotropy of all samples in the database (Fig. 8A) is dominated by the samples from the fast ridge environment. Despite the large number of samples with the possibility of
155
errors in individual measurements and sample reference frame determination the average sample is very anisotropic. The average P-wave velocities varies between 7.84 km=s perpendicular to the foliation and 8.47 km=s parallel to the lineation. The average P-wave anisotropy is about 9.5%. For S-waves, the birefringence varies between 0.1 km=s (0.2%) close to the lineation and 0.3 km=s (6.6%) perpendicular to the lineation in the foliation plane. Whatever the orientation of the propagation direction, the polarisation of the fast S-wave should give information about the orientation of the foliation plane .XY /. The overall symmetry pattern is very simple, which should allow the orientation of the structural frame from seismic anisotropy measurements.
4. Conclusions The role of seismic anisotropy in understanding the evolution of the upper mantle has become increasingly important. We have shown the olivine upper mantle seismic properties are a function of the lattice-preferred orientation intensity with changes in the details of fabric pattern having only a second-order effect and geodynamic environment and micro-structural types having little effect. Seismic anisotropy increases strongly at low fabric intensity and then rapidly saturates. The [100] axes distribution has the greatest influence in the seismic anisotropy of P-waves. The distribution [100] and [001] crystallographic axes has the most important effect on the symmetry of shear wave anisotropy, but the magnitude of shear wave anisotropy is effected by distribution of all three axes. The maxima of P-waves velocity and S-wave splitting combined with the fastest S-wave polarisation plane provide the means to determine the orientation of the structural reference frame. The maximum P-wave velocity indicates the position of the lineation. The maximum shear wave splitting is oriented close to the Y structural direction (normal to the lineation in the foliation plane). The polarisation
Fig. 8. Average seismic properties of 110 samples of this database (A), average of 72 olivine aggregates from fast spreading ridge peridotites (B), average for 13 olivine aggregates from xenoliths of subduction volcanism (C) and average of 17 olivine aggregates from xenoliths in kimberlitic eruptions (D).
156
W.B. Ismaı¨l, D. Mainprice / Tectonophysics 296 (1998) 145–157
plane of the fastest S-wave is parallel or sub-parallel to the foliation plane. Although this database is currently limited to olivine it does provide the first statistical overview of the potential use of seismic anisotropy as a tool for determining the structural geology of the upper mantle.
Acknowledgements We thank G. Barruol, F. Boudier and A. Vauchez for useful discussions and reviews of this work. Special thanks go to F. Boudier, A.M. Boullier, S. Ji, A. Toublanc, D. Jousselin, G. Barruol, J.F. Viollette, D. Cassard, and D. Secher who provided the majority of the original universal stage measurements as part of their theses or publications. We thank IDYL ‘Tomographie 3D de la lithosphere’ for financial support. Special thanks go to Paul Silver for his continued interest and encouragement of the construction of a database of the upper mantle petrofabrics for seismic studies. Finally the authors thank V. Babuska for his critical and constructive review which helped to improve the presentation of the shear wave splitting.
References Aki, K., Kaminuma, K., 1963. Phase velocity of Love Waves in Japan (part 1): Love waves from the Aleutian shock of March 1957. Bull. Earthquake Res. Inst. 41, 243–259. Anderson, D.L., 1961. Elastic wave propagation in layered anisotropic media. J. Geophys. Res. 66, 2953–2963. Babuska, V., 1972. Elasticity and anisotropy of dunite and bronzitite. J. Geophys. Res. 77, 6955–6965. Barruol, G., Mainprice, D., 1993. A quantitative evaluation of the contribution of crustal rocks to shear-wave splitting of teleseismic SKS-waves. Phys. Earth Planet. Inter. 78, 281– 300. Birch, F., 1961. The velocity of compressional waves in rocks to 10 kbar, Part 2. J. Geophys. Res. 66, 2199–2224. Boudier, F., 1969. Le massif lherzolitique de Lanzo (Alpes Piemontaises). Etude structurale et petrologique. The`se de doctorat, Universite´ de Nantes, 163 pp. Boudier, F., Nicolas, A., 1995. Nature of the Moho Transition Zone in the Oman Ophiolite. J. Petrol. 36, 77–796. Boullier, A.M., Nicolas, A., 1975. Classification of textures and fabrics of peridotite xenoliths from South African kimberlites. Phys. Chem. Earth. 9, 467–475. Bunge, H.J., 1982. Texture Analysis in Materials Science. Butterworths, London, 599 pp.
Cassard, D., 1980. Structure et origine des gissements de chromite du massif du sud (Ophiolites de Nouvelle-Cale´donie). The`se 3e`me cycle, Universite´ de Nantes, 239 pp. Christensen, N.I., Lundquist, S.M., 1982. Pyroxene orientation within the upper mantle. Geol. Soc. Am. Bull. 93, 279–288. Crosson, R.S., Lin, J.W., 1971. Voigt and Reuss prediction of anisotropic elasticity of olivine. J. Geophys. Res. 76, 570–578. Hess, H., 1964. Seismic anisotropy of the uppermost mantle under oceans. Nature 203, 629–631. Jousselin, D., 1998. Cartographie structurale et modellisation sismique des diapirs de manteau, dans l’ophiolite d’Oman. The`se, Universite´ de Montpellier II, 250 pp. Kumazawa, M., Anderson, O.L., 1969. Elastic moduli, pressure derivatives, and temperature derivatives of single-crystal olivine and single-crystal fosterite. J. Geophys. Res. 74, 5961– 5972. Mainprice, D., Humbert, M., 1994. Methods of calculating petrophysical properties from lattice preferred orientation data. Surv. Geophys. 15, 575–592. Mainprice, D., Silver, P.G., 1993. Interpretation of SKS-waves using samples from the subcontinental lithosphere. Phys. Earth. Planet. Inter. 78, 257–280. Mercier, J.C., Nicolas, A., 1975. Textures and fabric of upper mantle peridotites as illustrated by xenoliths from basalts. J. Petrol. 16, 454–487. Nataf, H.C., Nakanishi, I., Anderson, D.L., 1984. Anisotropy and shear-velocity heterogeneities in the upper mantle. Geophys. Res. Lett. 11, 109–112. Nicolas, A., Boudier, F., Boullier, A.M., 1973. Mechanisms of flow in naturally and experimentally deformed peridotites. Am. J. Sci. 273, 853–876. Nicolas, A., Christensen, N.I., 1987. Formation of anisotropy in upper mantle peridotites — a review. In: Fuchs, K., Froideveaux, C. (Eds.), Composition, Structure and Dynamics of the Lithosphere–Asthenosphere System. Am. Geophys. Union, Geodyn. Ser. 16, 111–123. Nicolas, A., Poirier, J.P., 1976. Crystalline Plasticity and Solid State Flow in Metamorphic Rocks. Wiley, New York, 444 pp. Raitt, R.W., Shor, G.G., Francis, T.J.G., Morris, G.B., 1969. Anisotropy of the Pacific upper mantle. J. Geophys. Res. 74, 3095–3109. Schmidt, S.M., Casey, M., 1986. Complete fabric analysis of some commonly observed quartz c-axis patterns. In: Heard, H.C., Hobbs, B.E. (Eds.), Mineral and Rock Deformation Laboratory Studies — The Paterson Volume. Am. Geophys. Union, Geophys. Monogr. 36, 263–286. Secher, D., 1979. Etude de la fracturation dans le nodules de pe´ridotite des basaltes. Diplome d’e´tudes approfondies de ge´ologie applique´e, Universite´ de Nantes, 44 pp. Secher, D., 1981. Les lherzolites ophiolitiques de nouvelle-cale´donie et leurs gissements de chromite. The´se 3e´me cycle, Universite´ de Nantes, 228 pp. Shearer, P.M., Orcutt, J.A., 1986. Compressional and shear wave anisotropy in the oceanic lithosphere — the Ngendei seismic refraction experiment. Geophys. J.R. Astron. Soc. 87, 987– 1003. Shaocheng, J., Xiaou, Z., Francis, D., 1994. Calibration of shear-
W.B. Ismaı¨l, D. Mainprice / Tectonophysics 296 (1998) 145–157 wave splitting in the subcontinental upper mantle beneath active orogenic belts using ultramafic xenoliths from the Canadian Cordillera and Alaska. Tectonophysics 239, 1–29. Silver, P.G., Chan, W.W., 1988. Implications for continental structure and evolution from seismic anisotropy. Nature 335, 34–39. Toublanc, A., 1992. Petrofabrique de xenoliths de kimberlites, proprie´te´s sismique du manteau sub-continental. Diplome d’e´tudes approfondies, Universite´ de Montpellier. Vinnik, L.P., Kosarev, G.P., Makeyeva, L.I., 1984. Anisotropiya, litosfery po nablyudeniyam voln SKS and SKKS. Dokl. Akad. Nauk SSSR 278, 1335–1339.
157
Vinnik, L.P., Farra, V., Romanowicz, B., 1989. Azimuthal anisotropy in the earth from observations of SKS at geoscope Nars broad band stations. Bull. Seismol. Soc. Am. 79, 1542–1558. Violette, J.F., 1980. Structure des ophiolites des Philippines (Zambales et Palawi) et de chypre — Ecoulement asthe´nosphe`rique sous les zones d’expension oce´anique. The`se 3e`me cycle, Universite´ de Nantes, 152 pp. Weiss, T., Siegesmund, S., 1998. Seismic, structural and petrological models of the subcrustal lithosphere in Southern Germany: a quantitative revaluation. Pure Appl. Geophys. (in press).
An olivine fabric database: an overview of upper mantle ... - CiteSeerX
duction zones, and kimberlites, with various micro- structures ... Micro-structure and respective percentage ..... Although the trend is observed for S-wave seismic.
of its development was back in HP Labs Bristol as an investigation of OCR for ... analysis technology that was used in products, (and therefore not released for ...
Consequently, the minimum pulse width of these serial data streams have decreased to less ... for a semiconductor capital equipment company. He received a ...
region of the histogram, then fits the data with a Gaussian histogram that best coincides with the tail region. ..... power spectral density (PSD). The RJ component ...
digital communications systems. ... signature that repeats at a fixed frequency. ... algebraically add to the desired signal, and can slightly alter its bias depending ...
travel round the body. They normally flow freely in the ...... 18 The International Chronic Granulomatous Disease Cooperative. Study Group. A controlled trial of ...
Education (B Cohen BSc), St Bartholomew's and the Royal London ... function of the immune system in recognising, repelling, and eradicating pathogens and ...
resolutions of remote sensing systems and through the analytical and data integration ... technologies can be linked together into a synergistic system that is ...
national structure and policy of vocational education and training (VET) in Australia. ... of online technology on the teaching practice of teachers employed in ...
Page 1 ... Abstract: In the design of a parallel resonant induction heating system, choosing a proper capacitance for the resonant circuit is quite ..... Wide Web,.
As such, they are available as domains for any kind of operation, including ... ii. whenever stress is assigned to a foot or any other domain, it is assigned via the.
[1] We assess the upper mantle structure under the Tibetan plateau from a S-to-P converted waves receiver functions study. Contrary to the Ps receiver functions ...
Dec 6, 2003 - the dual necessity (or certainty) degree N(Ï) = 1 â. â. (¬Ï) which .... scientists have discovered some new life forms, called Glacyceas, in the arctic ocean .... Do you expect this Worm, with more than one year of life expectanc
family of possibility distributions satisfying constraints expressing that the situation where ... value in {T, F} to each formula in L according to the classical rules of.
2 Center for Agricultural and Rural Development, Iowa State University, ..... Alternative energy sources should, therefore, become competitive as time goes by.
examination of several open issues and the future prospects of biofuels. ... production trend depicted in figure 2 shows a slow albeit steady growth up to the beginning of the ...... in calculating their proposed corporate average fuel economy (CAFE)
Central banks face enormous amounts of uncertainty. â» Greenspan (2003): ... Parameters. â» How take this uncertainty into account when setting monetary.