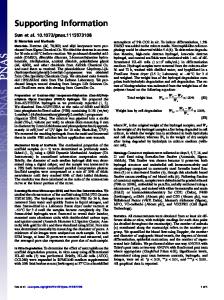
Supporting Information D’Arcy et al. 10.1073/pnas.1008595107 SI Materials and Methods Polyaniline Nanofiber Synthesis. Aniline (0.16 mL, 1.75 × 10⁻³ mol,
Sigma-Aldrich®) in 8 mL of 1 M HCl (Solution A), ammonium peroxydisulfate (0.1002 g, 4.39 × 10⁻⁴ mol, Fisher®) in 8 mL of 1 M HCl, and N-phenyl-1,4-phenylenediamine (0.0032 g, 1.74× 10⁻⁵ mol, Sigma-Aldrich®) in 1 mL of methanol were combined. This polymerization proceeded overnight and was purified via dialysis. Polyaniline Nanofiber Film Growth. Typically, a volume ranging between 0.3 and 1.0 mL of an aqueous colloidal dispersion (4 g∕L) of partially doped polyaniline nanofibers was mixed with 3 mL of DI water. Then 6 mL of chlorobenzene (or chloroform) was added and shaken vigorously. The substrate, a clean microscope glass slide, was introduced into the container and shaken for 10 s. Polymer film growth started once the container was left motionless. Film adhesion to a substrate increases via temperature annealing at 55 °C for 48 h. Deposition on Nonactivated Hydrophobic Surfaces. A plastic polyvinyl chloride slide (7.5 × 25 mm2 ) was coated by using 3 mL of an aqueous dispersion of polymer nanofibers [4 g∕L] and 7 mL of a fluorocarbon such as Fluorinert FC-40®. After 1 min of agitation, the substrate was dried under ambient conditions. Polyaniline Nanofiber and Single-Walled Carbon Nanotube (SWCNT) Composite Film. Water dispersible SWCNTs (0.0070 g) and
20 mL of DI water were mixed via sonication for 30 min. This dispersion was then centrifuged (112 × g∕20 min), diluted by half, and sonicated for 15 min, yielding a stock aqueous dispersion. A 1 mL aliquot was combined with 1 mL of polymer and used to coat multiple glass slides with a transparent hybrid film— please refer to the protocol for polyaniline nanofiber film growth described in SI Materials and Methods. Cyclic Voltammetry of Polyaniline Nanofiber Films. A polyaniline nanofiber film was grown on an ITO-glass substrate and dried for 12 h at 25 °C followed by 48 h at 55 °C. A dried, blue-colored film was then immersed in the electrolyte and cycled from −0.2 to þ1.2 V and then back to −0.2 V by using a scan rate of 50 mV∕s. The CVs collected were reproducible for more than ten cycles. When the films are dried in a vacuum oven at 55 °C for 1 week, nanofiber films are less prone to delamination from the surface of ITO after prolonged and repeated cycling.
Discussion Accompanying Figs. S1 A and B, S2, S3, S4, and S7.
films (Fig. S2) are conductively continuous across their entire surface area as tested by 2-point probe. Conductivity measurements of polyaniline nanofiber films. Films of para-toluene sulfonic acid (p-TSA) partially doped polyaniline nanofibers on glass substrates were used for measuring conductivity (Fig. S3A). The protocol followed for film formation is presented in SI Materials and Methods. In a typical experiment 0.35 mL of a 4 g∕L aqueous dispersion of polymer, 3 mL water, and 5 mL of chlorobenzene were vigorously agitated. The mixture was then set aside to grow an upward spreading film. Water, organic solvent, and polymer nanofibers were combined in a plastic container which can snugly fit a microscope glass slide, such as a 60 mL polypropylene Falcon® conical tube. Gold electrodes were deposited on a dry film (Fig. S3 B and C), the polymer was redoped, and conductivity was measured via 4-point probe analysis. Film thickness was determined by measuring the film’s cross-section using a scanning electron microscope (SEM). Images were collected at a tilt angle of 52°, using an SEM (FEI Nova 600—FIB system) capable of providing accurate nanometer size measurements. A nanoscale morphology comprised of monolayers results from growing partially doped nanofibers on a glass substrate (Fig. S3 D and E). Aggregates develop in the film’s morphology if doped nanofibers are used, possibly due to a high degree of protonation in the polymer backbone. Noncovalent interactions such as hydrogen bonding between nanofibers, as well as between the nanofibers and substrate, determine the homogeneity of the morphology at the nanoscale. An average thickness of 100 nm is representative of homogeneous monolayer films of nanofibers of p-TSA partially doped polyaniline possessing conductivities up to 3 S∕cm; films are conductively continuous across the entire surface of the substrate. Patterning. A piece of polydimethylsiloxane (PDMS) was firmly and evenly pressed against the surface of glass, heated at 55 °C for 5 min, and allowed to cool to room temperature. The PDMS stamp was peeled off and the substrate dipped into a mixture comprised of chlorobenzene, water, and polyaniline nanofibers. A film was collected as described in SI Materials and Methods. Patterning of a conducting film of polyaniline nanofibers on the surface of a hydrophilic substrate is made possible by altering the surface energy. When the substrate and the PDMS stamp are in contact, PDMS molecules deposit on the surface of the substrate and make it hydrophobic; thus the selective deposition of a film occurs due to the preferential wetting of hydrophilic regions during film growth (Fig. S4).
Control of film morphology by tailoring interfacial surface tension.
The interfacial surface tension differential of biphasic mixtures of water and oil were studied by comparing two different interfaces, that of carbon disulfide/water (∼48 dyn∕cm) and nitrobenzene/water (∼25 dyn∕cm). The lower interfacial tension system leads to monolayers, with a relatively homogeneous 2-dimensional side-by-side stacking of nanofibers (Fig. S1A). Carbon disulfide provides a large interfacial surface tension with water and the film morphologies are characterized by a large mass of deposited nanofibers (Fig. S1B). The packing density appears to increase proportionally with the interfacial surface tension. Growing thin films of conducting polymers on nonactivated hydrophobic surfaces. Polypropylene, polyethylene, oriented polyester, and
polyvinyl chloride nonactivated surfaces have been coated with transparent conducting polymer nanofiber films in 1 min; these D’Arcy et al. www.pnas.org/cgi/doi/10.1073/pnas.1008595107
Control of film morphology by tailoring the polymer nanofiber concentration. The effect of polymer nanofiber concentration on film
morphology was studied by comparing films made from different concentrations of nanofibers. Films were deposited on glass slides, and tilted SEM images collected (Fig. S7). The polymer concentration of nanofibers that is used for growing a film controls the nanofiber packing morphology; the number of nanofibers present in a given area increases proportionally with concentration. Excess nanofibers lead to nanofibrillar aggregates. Typically 3 mL of water and 5 mL of chlorobenzene were mixed along with different concentrations of p-TSA partially doped polyaniline nanofibers: low (0.18 mL of 4 g∕L aqueous dispersion), medium (0.4 mL), and high (0.8 mL) concentrations. Packing of nanostructures occurs in two dimensions whereby monolayers of nanofibers spread and stack side by side across the 1 of 5
substrate surface. High concentrations of nanofibers lead to high packing densities of polymeric nanostructures in the film morphology (Fig. S7A). Conversely, as the polymer concentration
is gradually lowered, the deposited nanofiber mass decreases proportionally (Fig. S7 B and C).
Fig. S1. Interfacial surface tension differentials can be used to control film morphology. The nanoscale morphology of a p-TSA partially doped polyaniline nanofiber film on glass. (A) Nitrobenzene and water lead to a homogeneous nanofiber monolayer deposition. If all parts are equal, the nanofibers experience a force proportional to that of the surface tension differential between the water and oil interface (∼25 dyn∕cm). In the case of a nitrobenzene/water system, the spreading force leads to the assembly of a tightly packed single monolayer of nanofibers. (B) Nanofibers at the interface between carbon disulfide and water experience a stronger force (∼48 dyn∕cm) causing nanofibers to collide, leading to some nanofibrillar aggregation. (C and D) Controlling the two-dimensional nanofiber packing morphology by varying the available interfacial surface area. The interfacial surface area between an oil and a water layer varies proportionally with the diameter of the containment vessel, and p-TSA partially doped polyaniline nanofiber films were grown using bottles of two different diameters: wide containers (aspect ratio ¼ 2) and narrow containers (aspect ratio ¼ 3.3). (C) Narrow containers lead to films with low packing density of monolayers of nanofibers. (D) Wide containers produce films comprised of a higher packing density of monolayers of nanofibers.
D’Arcy et al. www.pnas.org/cgi/doi/10.1073/pnas.1008595107
2 of 5
Fig. S2. Thin polyaniline nanofiber films on hydrophobic substrates. Vinyl slides were taken out of the box and films were deposited by mixing water, nanofibers, and a fluorocarbon such as Fluorinert FC-40®. (A) Transparent and flexible films of conducting material were homogeneously deposited on the surface of the substrate in one minute under ambient conditions. (B) A scanning electron micrograph of a camphorsulfonic acid (CSA) doped polyaniline nanofiber film grown on a vinyl substrate. (Inset) UV-visible (UV-vis) spectra of a CSA doped polyaniline nanofiber film on a vinyl substrate; double-sided (larger absorbance) and single-sided films are shown.
Fig. S3. Polyaniline nanofiber films on glass for conductivity measurements via 4-point probe. Partially doped p-TSA polyaniline nanofiber films are deposited, dried, and redoped for analysis. (A) Pristine films on glass prior to electrode deposition have a light transmission greater than 70%. (B) Evaporated gold electrodes are spaced at 0.75 mm from each other. (C) A schematic representation of the electrode geometry. (D and E) A representative scanning electron micrograph of a cross-section of p-TSA partially doped polyaniline nanofiber film on glass. By controlling the doping level in polyaniline, the nanoscale morphology of a film can be tailored. (D) A partially doped aqueous colloidal dispersion of polymer leads to monolayers of nanofibers on a glass substrate. (E) A close-up image shows a cross-section of the film, with a thickness ranging from 68 to 103 nm. A scanning electron microscope with a focused ion beam (FEI Nova 600) provides accurate cross-sectional measurements at a tilt angle of 52°.
D’Arcy et al. www.pnas.org/cgi/doi/10.1073/pnas.1008595107
3 of 5
Fig. S4. Selective deposition of a polyaniline nanofiber film after stamping the substrate surface with a piece of PDMS. The polymer film grows only on hydrophilic surfaces because the poor wetting of a PDMS stamped region does not allow film deposition to occur.
Fig. S5. UV-vis of initiator assisted polymerized P3HT. The nanofibers were dissolved in chlorobenzene and the spectrum shows typical absorption pattern of solvated P3HT (1).
1 Fraleoni-Morgera A, Marazzita S, Frascaro D, Setti L (2004) Influence of a non-ionic surfactant on the UV-vis absorption features of regioregular head-to-tail poly(3-hexylthiophene) in water-based dispersions. Synth Met 147:149–154.
Fig. S6. Flow process diagram. (A) An array of bottom-contact gold electrodes on SiO2 ∕Si and (Top Right) a close-up illustration of the electrode geometry. (B) A self-adsorbed monolayer (SAM) of octadecyltrichlorosilane (OTS) is deposited on SiO2 by immersion into a 1% solution in toluene for 1 h. (C) The treated electrode is immersed in a container with a solution of P3HT in chlorobenzene and a fluorocarbon such as Fluorinert FC-40®. This container is vigorously agitated in order to form an emulsion of droplets that upon contact with the OTS SAM coalesce and lead to the deposition of a P3HT film. (D) The coated electrode is taken out after 1 min of agitation and immediately annealed on top of a hot plate at 110 °C for 15 min.
D’Arcy et al. www.pnas.org/cgi/doi/10.1073/pnas.1008595107
4 of 5
Fig. S7. Surface packing of nanofibers in film morphology as a function of polymer concentration in the film growth solution. Films were grown on glass using three different polymer concentrations. The nanoscale morphology of p-TSA partially doped polyaniline nanofiber film was controlled; the two-dimensional nanofiber packing changes proportionally with polymer concentration. (A)–(C) Three different polymer concentrations were compared: (A) high (0.8 mL of a 4 g∕L aqueous dispersion of polyaniline nanofibers); (B) medium (0.4 mL); and (C) low (0.18 mL).
Movie S1. After being agitated and set to rest, a polyaniline nanofiber film rapidly spreads up the wall of a glass vial. This system is comprised of polyaniline nanofibers, water, and chlorobenzene in a 1:3 ratio. Movie S1 (MOV)
Table S1. Concentration of polymer in solution versus deposited film surface area Concentration of solids in solution, mg 0.04 0.08 0.12 0.16 0.20 0.24 0.28 0.32 0.36 0.40 0.56 0.64
Film surface area, mm2 0 100 200 275 288 675 688 925 1,675 1,704 1,775 1,850
Table S2. The strength of adhesion of a polyaniline nanofiber film on various surfaces Number of peels,* 25 °C Soda glass Borosilicate glass Quartz ITO Mica Aluminum foil
9 8 7 7 5 4
Number of peels,* 55 °C 10 9 7 8 5 7
*3M Scotch removable tape
D’Arcy et al. www.pnas.org/cgi/doi/10.1073/pnas.1008595107
5 of 5