Ratio and Proportion
Ratio and Proportion
Research and Teaching in Mathematics Teachers’ Education (Pre- and In-Service Mathematics Teachers of Elementary and Middle School Classes)
David Ben-Chaim The Technion- Israel Institute of Technology, Israel Yaffa Keret The Open University of Israel, Israel Bat-Sheva Ilany Beit Berl Academic College, Israel
A C.I.P. record for this book is available from the Library of Congress.
ISBN: 978-94-6091-782-0 (paperback) ISBN: 978-94-6091-783-7 (hardback) ISBN: 978-94-6091-784-4 (e-book)
Published by: Sense Publishers, P.O. Box 21858, 3001 AW Rotterdam, The Netherlands https://www.sensepublishers.com/
Printed on acid-free paper
All Rights Reserved © 2012 Sense Publishers No part of this work may be reproduced, stored in a retrieval system, or transmitted in any form or by any means, electronic, mechanical, photocopying, microfilming, recording or otherwise, without written permission from the Publisher, with the exception of any material supplied specifically for the purpose of being entered and executed on a computer system, for exclusive use by the purchaser of the work.
TABLE OF CONTENTS
Chapter 1:
Introduction ........................................................................................ 1
PART I: STRUCTURE OF BOOK AND TEACHING MODEL 5 Chapter 2: Structure of Book................................................................................ 7 Chapter 3: A Model for Teaching Ratio and Proportion Using Authentic Investigative Activities .......................................... 13 PART II: THEORETICAL BACKGROUND 21 Chapter 4: A Mathematical Perspective of Ratio and Proportion ...................... 23 Chapter 5: Proportional reasoning—A psychological-didactical view .............. 49 Chapter 6: Research and new approaches in pre- and in-service mathematics teacher education ........................................ 61 PART III: AUTHENTIC INVESTIGATIVE ACTIVITIES, INCLUDING DIDACTIC COMMENTS AND EXPLANATIONS 71 Chapter 7: Authentic investigative activities— Introduction ............................. 73 Chapter 8: Group 1: Introductory activities........................................................ 83 Chapter 9: Group 2: Rate activities .................................................................... 95 Chapter 10: Group 3: Ratio activities ................................................................. 125 Chapter 11: Group 4: Stretching and Shrinking: Scaling Activities ................... 145 Chapter 12: Group 5: Indirect Proportion Activities .......................................... 181 Chapter 13: Group 6: Additional Activities for Practice and Enrichment (All topics) ........................................ 195 PART IV: ASSESSMENT TOOLS 219 Chapter 14: Introduction to Assessment Tools .................................................. 221 Chapter 15: Questionnaire: Attitude Toward Ratio and Proportion ................... 225 Chapter 16: Diagnostic Questionnaire in Ratio and Proportion ......................... 233 Chapter 17: Assessing Research Reports and Building a Student Portfolio ........................................................... 245 PART V: ANNOTATED RESOURCES AND BIBLIOGRAPHY 253 Chapter 18: Annotated Resources ...................................................................... 255 Chapter 19: Bibliography ................................................................................... 269
v
CHAPTER 1
INTRODUCTION
The concepts of ratio and proportion are fundamental to mathematics and important in many other fields of knowledge. Many phenomena can be expressed as some proportional relationship between specific variables, often leading to some new, unique entity. Conceptualization and comprehension of these concepts, not to mention skills and competence in using them, facilitate mathematic awareness. Even more importantly, these skills foster the ability to use relational reasoning, otherwise known as proportional reasoning, which is crucial to the development of analytical mathematical reasoning. Studies world-wide have shown that most pre- and in-service mathematics teachers not only have insufficient understanding of basic mathematical content knowledge, they also lack basic pedagogic-didactic abilities for the mathematical subjects taught in primary and middle schools. Their comprehension of mathematics is predominantly technical and schematic, and they have neither assimilated understanding nor formulated knowledge at such levels that can lead to sufficient and adequate fluency in the concepts. In other words, the difficulties that many pre- and in-service mathematics teachers have in understanding the concepts of ratio and proportion result in the inability to properly teach them. The intrinsic difficulty that pre- and in-service teachers alike have in understanding the concepts of ratio and proportion, combined with the general lack of instruction for teachers, ultimately results in teachers with negative attitudes towards teaching this subject, especially amongst those teaching mathematics in elementary school. Unfortunately, most teaching institutions world-wide do not provide teachers destined for teaching mathematics in elementary or middle schools any systematic, in-depth, comprehensive instruction of these mathematical topics from a psychodidactic perspective. This book comes to solve this problem. While this book is primarily intended for use by instructors in teachertraining institutions who are preparing pre- and in-service teachers to teach mathematics in elementary and middle school, it is also suitable for use in continuing teacher education programs, and for anyone interested in teaching or studying the subject of ratio and proportion. This book is an ideal sourcebook for constructing a comprehensive teaching unit on the subject of ratio and proportion by applying and adapting the unique teaching model presented. This teaching model combines theoretical instruction with practical investigative activities, thus offering teachers firsthand experience in
1
CHAPTER 1
solving authentic problems along with the deeper understanding that results from analyzing published research reports. (These reports offer, among other things, varied and diverse solutions to problems that may arise when actually teaching the subject in class.) By giving novice (and experienced) teachers deep pedagogic mathematical understanding combined with concrete, hands-on experience, a positive change in attitude and confidence is elicited, improving their ultimate teaching experience, and benefitting both teacher and student alike. Briefly, this book comprises the following sections. Part One: Structure of Book and Teaching Model, describes this book and the teaching model developed following five years of research preparing and giving courses to pre- and in-service teachers in several Israeli teacher colleges and universities' departments of education. During those years, the teaching concept was developed, authentic investigative activities were prepared and tested, and a pioneering project was carried out to test the necessity of such a book. The premises put forth were presented at international conferences and validated through discussions with colleagues worldwide. Part Two: Theoretical Background presents three chapters dealing with the mathematical, psychological-didactic, and teacher-training aspects of ratio and proportion. The mathematical perspective explains how the study of ratio and proportion progresses through the three sources of knowledge: intuitive (identification of the existence of some proportional relationship in various comparisons), formal (comprehension of the different types of proportional problems and the strategies needed for solving them), and procedural (the perception and understanding of the mathematical-numerical solutions required to solve any of a wide range of proportional problems). The psychological-didactic aspect of the topic explains the results of research concerning the development of proportional reasoning, the strategies used for solving proportional problems, and sources of difficulties in understanding the subject. The chapter on training teachers reviews various studies and approaches in order to round out and give deeper insight to the instruction of ratio and proportion. Part Three: Authentic Investigative Activities, is the major content of this book, and presents a wide, comprehensive range of authentic investigative activities in ratio and proportion. The activities are divided into five types, from easiest to most difficult: introductory activities, rate activities, ratio activities, scaling activities, and activities dealing with inverse proportion. Within each type, various levels of difficulty are offered, ranging from problems that presume no familiarity whatsoever with the subject, and culminating with complicated, difficult ones. Some of the activities also include a second stage, which presents an even greater level of complication, and which incorporate additional, higher-level mathematical concepts, such as percentages, functions, and more. Some activities suggest additional assignments that can be used for further practice and enrichment. In addition, many of the activities show how problems of ratio and 2
INTRODUCTION
proportion are linked to other mathematical concepts and to other fields of knowledge. While the activities in this book are specifically meant for training teachers, they are all easily adapted for use in elementary and middle schools classes. This book, therefore, especially this section (Part Three), can serve as a valuable source for primary-school mathematics teachers. Part Four: Assessment Tools, provides questionnaires to test the abilities and attitudes of the participants for evaluation and diagnostic purposes. By conducting the evaluation tests both at the beginning (pre-testing) and end (post-testing) of the course, an accurate measure of progress can be made. Also included in Part Four are explanations and instructions on analyzing research reports, plus detailed information on the purpose, benefits, and required content of a student portfolio. Part Five: A List of Annotated Sources, offers articles from the professional literature and other resources concerned with the topics of ratio and proportion. The course instructor can integrate these resources into the teaching process in a number of ways: by assigning appropriate, timely articles from this section for analysis; by incorporating these additional resources as part of assigned homework; or by suggesting these additional sources for in-service teachers to adopt and present in their classes at school. A comprehensive bibliography follows. To the best of our knowledge, there is no book currently available that not only comprehensively covers the subject of ratio and proportion, but that also presents a unique teaching model that uses an extensive variety of authentic investigative activities. As it goes without saying that firsthand, direct experience leads to the broadest, deepest comprehension of any subject, this book on ratio and proportion should prove to be a valuable addition to the curriculum of any pre- and in-service teacher training or professional development program in mathematics education.
3
PART ONE
STRUCTURE OF BOOK AND TEACHING MODEL
CHAPTER 2
STRUCTURE OF BOOK
The information presented in this chapter, combined with the authors’ rationale presented in the introduction, above, provides the conceptual framework of the book, and provides the basis for preparing and organizing courses in ratio and proportion for both pre- and in-service elementary and middle school mathematics teachers: initial training for the former and professional development for the latter. The book is structured to facilitate flexibility in constructing any teaching program demanded by various pedagogic-didactic goals, easily facilitated by referring to the teaching model described in Chapter 3. Subject matter is modular, and course content can easily be drawn as required from the three major sections: Part Two: Theoretical Background; Part Three: Authentic Investigative Activities; and Part Four: Assessment Tools. In addition, Part Five presents a variety of annotated sources and an overall reference list that can be incorporated into the curriculum. DETAILED STRUCTURE OF THE BOOK
After this present overview of the structure of the book and the chapter on the teaching model (Part One), this book presents the topic of ratio and proportion theoretically (Part Two), practically (Parts Three and Four), and as combined theory and applied investigation (Part Five), enabling course instructors to create an all-embracing combination between theory and practice. The fusion of theory, both mathematical and that obtained from examining research reports written by various researchers, with actual first-hand experience obtained from authentic investigative activities allows course participants to successfully develop and understand the concepts of ratio and proportion. Each part begins with a brief didactic introduction with additional comments and explanations regarding its structure and content, along with suggestions for appropriate didactic methods, adapted according to the instruction model illustrated and described below. Part One: Structure of Book and Teaching Model The present section (Part One) begins with Chapter 2: Structure of the Book, which gives an overview of the various parts of this text. Along with explaining the content of each of the sections in this book, Part I also suggests how that content can be combined within the framework of the various teaching settings.
7
CHAPTER 2
Chapter 3: A Model for Teaching Ratio and Proportion, follows, to provide a detailed description of the teaching model developed by the authors. Part Two: Theoretical Background The three chapters of Part Two give an in-depth summary of the subject of ratio and proportion from the mathematical, psychological-didactic, and pedagogic aspects. Chapter 4: A Mathematical Perspective of Ratio and Proportion. Many concrete examples of ratio and proportion problems are presented, along with various solution strategies, ranging from strategies suitable for students in elementary school, and up to formal strategies suitable for teenagers and adults. Chapter 5: Proportional Reasoning—A Psychological-didactic View. This chapter includes results of various studies in proportional reasoning, and describes the stages in the development of proportional reasoning in children and teenagers, strategies for solving problems in ratio and proportion, and sources of problems and difficulties that can be encountered when attempting to solve such problems. Chapter 6: Research and New Approaches in Pre- and In-Service Mathematics Teacher Education. In this chapter, research studies and various new approaches for training pre- and in-service mathematics teachers are presented and discussed, as are the reasons that the decision was made to use authentic investigative activities based on the model presented below. The three chapters in Part Two clarify the theoretical basis of the authors’ approach to teaching ratio and proportion to pre- and in-service mathematics teachers. In most of the authentic investigative activities presented in Part Three, suggestions for including relevant material from Part Two are made. These inclusions are suggested during the course of instruction in order to sum up the concepts and expand the activity, as is suggested in the teaching model. Part Three: Authentic Investigative Activities Part Three begins with Chapter 7: Authentic Investigative Activities—An Introduction. Thereafter, are five chapters of actual authentic investigative activities, organized into groups, each group having a number of modular activities that may be presented in any order appropriate. Each activity comprises a worksheet to be handed out to the participants, followed by didactic comments and explanations—sometimes detailed, sometimes less so—pertaining to the activity. These comments include didactic clarifications; instructions on how to respond to the various answers that students may come up with; remarks on the difficulties encountered and strategies required for arriving at a solution; and suggestions for incorporating sections from the research papers detailed in Part Four (annotated sources) into the learning process. These authentic investigative activities form the core of the model (illustrated below) for teaching the concepts of ratio and proportion. As suggested in the 8
STRUCTURE OF BOOK
model, the course should begin with at least one activity from the first group. Next, activities should be chosen from groups 2, 3, and 4, all of which are modular, and all of which may be introduced in any order desired. Finally, some activities from group 5 should be presented. While it is not compulsory to include all the activities, it is highly recommend that at least one activity from each group be included. The final chapter in Part Three presents a plethora of additional activities for extra practice or homework. Chapter 8: Introductory Activities. This group comprises three introductory activities that present the topic of ratio and proportion before actual formal instruction is commenced. Any or all of the activities, depending on what the instructor deems appropriate for the participants, can be used. It is recommended that the course commence with at least one introductory activity. Chapter 9: Activities Pertaining to Rate. This group comprises six activities pertaining to the concept of rate, such as price per unit, distance travelled per liter of gasoline, number of articles in a unit of volume, density (number of items per unit of area), and more. Chapter 10: Activities Pertaining to Ratio. This group comprises five activities pertaining to the concept of pure ratio, such as comparison of ratios, division of the whole according to a given ratio, strategies for using ratio to solve problems, finding the part based on the whole, and dividing profit between investors. Chapter 11: Activities Pertaining to Scaling. This group comprises seven activities pertaining to scaling, including enlargement or reduction of a shape (including area or volume), calculating actual size according to the scale given, and using scale to compare between sizes. Chapter 12: Activities Using Indirect Proportion. This group comprises three activities using indirect proportion, such as equilibrium of an equal-arm balance, etc. Chapter 13: Additional Activities for Practice and Enrichment, gives a large selection of additional exercises that can be used for extra practice, homework assignments, enrichment, and evaluation. Part Four: Assessment Tools Following an introductory chapter (Chapter 14: Introduction to Assessment Tools), Part Four presents tools to assess the attitudes and mathematical and pedagogic/didactic knowledge of the pre- and in-service teachers. Various ways of utilizing these evaluation tools within the course are discussed at the beginning of the section. Also included in Part Four are guidelines on how to evaluate research papers and how to organize a student portfolio. Chapter 15: Attitude Questionnaire. Statements of attitude are presented in four different categories: i. Teaching mathematics in general; ii. Confidence in ability to deal with ratio and proportion; iii. Difficulties in teaching ratio and proportion; and iv. The importance of teaching ratio and proportion. The 9
CHAPTER 2
questionnaire also includes open-end questions that request didactic discussion of the concepts of ratio and proportion. Chapter 16: Diagnostic Questionnaire on Content Knowledge. This questionnaire checks the mathematical and pedagogic/didactic content knowledge of the concepts of ratio and proportion on three sub-topics: rate, ratio and scaling. The questionnaire also includes exercises with fractions. It can also be given in whole or in part after the course to test the students’ understanding and achievements. Chapter 17: Assessing Research Reports and Building a Student Portfolio. In the first part of the chapter are guidelines detailing the stages in the assessment of a research report, which will aid students in relating to the main points presented therein, help them develop critical unbiased reading skills, and encourage generalization in order to allow the practical application of the results. The evaluation tool is suitable for both theoretical and empirical research reports. The second part presents a comprehensive discussion of the advantages of using a portfolio as an alternative method of assessment, with specific guidelines for creating one. Not only will the student portfolio serve as an unbiased method of assessment, the finished product will be a valuable resource for the student later in their teaching career. Part Five: Annotated Resource and Bibliography Finally, Chapter 18: Annotated Resources presents a list of annotated references and research studies appropriate to the course, and which the course instructor may choose to include into the didactic presentation of the teaching process of ratio and proportion, or as assignments to be given within the course of study. Because combining theoretical background and investigative results into the learning process is so important, the authors go into detail in suggesting various ways that these references can be integrated into the various stages of instruction. Chapter 19: Bibliography, concludes the book. INCORPORATING MATERIAL INTO THE COURSE
The layout of the book has been purposely arranged to make it as simple as possible to incorporate the wide variety of material into various teaching frameworks. Incorporating Theoretical Material While the focus of most courses will undoubtedly be on the content presented in Part Three, it is important that the information presented in Part Two (Theoretical Background) not be skipped, especially in the case of a pre-service course for qualifying mathematics teachers. While one might be apt to consider theoretical background either partly or totally optional, incorporating it in its entirety into the program will greatly enhance the development of proportional reasoning, will 10
STRUCTURE OF BOOK
provide a firm base of knowledge, and will broaden and deepen the participants’ understanding of the material. The material in Part Two can be incorporated in a variety of ways. For example, participants in a course designed to qualify pre-service teachers for teaching mathematics in elementary and middle school might benefit from having to research and present information in the format of a “scientific report.” Sections of Part Two could be assigned to various students who would analyze the information and present it for discussion in front of the rest of the class. By being actively involved in presenting certain aspects of the theoretical information, the participants incorporate and assimilate the theoretical background along with the practical methods. The layout of Part Two also proves its worth should some difficulty arise in the understanding of one or another of the authentic investigative activities. In such a case, the instructor can easily locate and present the appropriate theoretical section(s) that discusses the various strategies for solving the problem or that explains the source of the difficulty and how to overcome it. Additionally, when teaching a course for the professional development of inservice elementary and middle school teachers, the instructor can be on the lookout for any gaps in the participants’ mathematical background knowledge or any difficulty they might have in understanding certain topics. When these arise, appropriate sections from Part Two can be introduced to enhance and clarify any deficiencies. For example, should the instructor feel that participants are not wellversed in the wide range of strategies available for solving ratio and proportion problems, the section on problem-solving strategies can be introduced, leading to a discussion comparing the strategies presented in the literature and those presented in class. Another example might be if participants are not fully cognizant of why students might misunderstand a topic. Again, the relevant section from Part Two can be located and assigned for reading and summarization. Using the Authentic Investigative Activities As far as choosing the authentic investigative activities when structuring courses, the modular structure of the book allows instructors to choose and combine the activities as required. Because the activities are divided by type and presented from easiest to most difficult, the instructor can maintain a certain order to the course, presenting at least one introductory activity (or more) to acquaint the participants with the topic; following that with various rate, ratio, and/or scaling activities— their content and difficulty based on the participants’ requirements; and ending with the most difficult—activities dealing with inverse proportion. The number of activities ultimately used will depend, of course, on the students’ previous knowledge, the time allotted, and the purpose of the course. Further details regarding the myriad activities and how to incorporate them into the course structure will be found in the following section, Chapter 3: A Model for Teaching Ratio and Proportion Using Authentic Investigative Activities.
11
CHAPTER 3
A MODEL FOR TEACHING RATIO AND PROPORTION USING AUTHENTIC INVESTIGATIVE ACTIVITIES
The model presented below is the basis used for constructing an instructional unit on the topic of ratio and proportion, whether for pre-service mathematics teachers or for in-service mathematics teachers participating in a professional development course. This model reflects the authors’ theoretical perspective on the method of teaching ratio and proportion, a method that can, in their opinion, lead to a deeper understanding of the concepts, when those concepts are based on sound mathematical and psychological/didactic principles. In accordance with this rational, the core of the model is based on a process of experimentation, solving authentic investigative activities, during which students are exposed to the concepts while attempting to develop their awareness of proportional reasoning abilities. Additionally, theoretical and practical knowledge are merged, as practical knowledge combined with tools to integrate between that and the theoretical, will allow pre-service teachers to build on that theoretical knowledge and to use it as a conceptual framework for their professional knowledge (Leinhardt, Young, & Merriman, 1995; Ball & Cohen, 1999; Even & Ball, 2009). BACKGROUND
Following a number of studies that demonstrated the difficulties that mathematics teachers in the elementary and middle schools had in understanding and teaching ratio and proportion, it seemed imperative to develop a teaching model to rectify this problem (Keret, 1999; Ben-Chaim, Ilany, & Keret, 2002; Berk et al., 2009). An experimental teaching model was developed and employed in three research projects that were carried out in two teaching colleges in Israel over the course of three years (2000-2003). In all three studies, the model was used as a basis for a course conducted to pre-service teachers in training to teach mathematics. The studies assessed changes in their mathematical and pedagogic/didactic knowledge of ratio and proportion, along with changes in attitude towards the importance of the topic, difficulties they anticipated in teaching it and confidence in their ability to teach the topic in elementary and middle school after participating in the course. The results of the studies indicate that a course on ratio and proportion based on our model allowing exposure to and practice in authentic investigative activities, combined with theoretical and practical knowledge – produces teachers who 13
CHAPTER 3
successfully solve the questions in the diagnostic questionnaire, and are able to suggest more methods for solving the problems, along with providing high-quality explanations for those methods. In addition, there was a remarkable improvement in their attitude to the topic from all standpoints (Ben-Chaim, Ilany, & Keret, 2002; Keret, Ben-Chaim, & Ilany, 2003; Ilany, Keret, & Ben-Chaim, 2004). THE COMPONENTS OF THE TEACHING MODEL
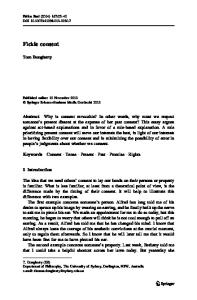
The model has four interactive components. The main component, the core of the model, is the authentic investigative activities. Around this core are three supporting components: the first (Unit 1) gives a general description of the structure of the activities; the second (Unit 2) describes the structure of the didactic element, and the third (Unit 3) presents evaluation tools for use in the course. By keeping in mind the information in each of these units, the instructor can organize the presentation of the activities to advantage. In addition, there is a fifth component involving basic mathematical concepts (fractions, percentages, scale, etc.) which the instructor must consider when preparing the lesson.
Figure 1. Teaching Model Using Authentic Investigative Activities for Teaching Ratio and Proportion
14
TEACHING MODEL
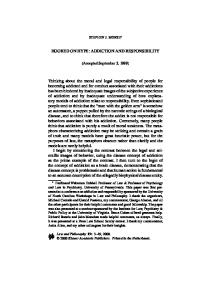
CORE OF THE MODEL: AUTHENTIC INVESTIGATIVE ACTIVITIES
The core of the model is the wide range of authentic investigative activities presented in Part Three that present realistic situations of problems of ratio and proportion in the real world of the students, teachers, and their community, at various levels of difficulty. It also includes incorporation of research reports to augment and enhance the instruction.
Figure2. Core of the Teaching Model
The Five Types of Authentic Investigative Activities 1. Introductory Activities. The purpose of these is to take the studentteachers out of the realm of their present knowledge and to bring them to a first consolidation of the concepts involved in ratio and proportion. For example, one of the exercises presents a situation in which a teacher in elementary school finds herself in difficulty teaching the subject of ratio because the students are not homogenous in their understanding of mathematical concepts. Some are still at the level of additive thinking, while their classmates have already advanced to multiplicative thinking and are thus mature enough to learn the topic. Experiencing this investigative activity will lead to a discussion of this problem, and subsequent suggestions on how to overcome it. 2. Activities pertaining to rate. The purpose of these activities is to provide experience dealing with concepts that are expressed as a rate of change of a unit, 15
CHAPTER 3
such as rate, power, density, etc. There are many examples of these in day-to-day living. For example, finding the price per unit of some item (book, beads, kilogram of potatoes, price per meter of fabric, etc.), finding the most economical car based on mileage (kilometers driven per liter gasoline), or deciding what is the fastest form of transportation (kilometers per hour). Perhaps the information sought is the number of residents in a square kilometer in the city in which we live (population density). From a mathematical standpoint, these activities provide experience in making quantitative comparisons and finding missing values of a given proportion, using the rules, properties and methods of ratio and proportion. 3. Activities pertaining to ratio. These activities provide experience solving situations in which there is a need to compare between sizes or amounts (as numerator and denominator) with similar properties. For example, making a comparison between the number of girls and boys in a class, or a comparison between the amounts of juice and water in a pitcher, and so on. The results of such comparisons (which are comparisons of ratio) allow the division of a whole according to a given ratio, as in, for example, the division of profits between partners, or the division of a pizza among children. Mathematically, these activities also provide experience in applying quantitative comparisons and for finding the missing value in a given proportion, using the rules and methods of ratio and proportion. 4. Activities pertaining to scaling. These activities provide experience in situations that require the need for enlarging or reducing a given shape, area or 3-D model, without distortion of the basic shape. Examples are finding the enlargement ratio required along with the scale used; finding and using the scaling ratio after the resizing of a picture; resizing on the first (linear—shapes), second (quadratic— area), and third (cubic—volume) levels; finding the actual (life-sized) measurement according to the scale of a model; using scale to compare between sizes, and more. 5. Activities pertaining to indirect proportion. These activities provide practice in problems that involve indirect proportions. For example, when we want to lift a heavy weight using a crane, the center of gravity for the object must be found. Or, to give a situation that is closer to the world of children, to understand when equilibrium occurs with an equal-arm balance, how to use equilibrium to find the weight of an object, and so on. These activities lead to a deeper, broader understanding of the subject. Research Reports. The experience gained with the authentic investigative activities is enhanced by examining articles on ratio and proportion that discuss both mathematical and pedagogic-didactic aspects. Mathematically, the aim is to use the required mathematical knowledge to develop the concepts. The pedagogicdidactic aspect is expressed by examining research papers and using the results of that research to broaden understanding and to analyze teaching methods that are appropriate to teaching the topic in the schools.
16
TEACHING MODEL
Choosing the Activities This teaching model suggests beginning a course for teachers or a program for professional development in ratio and proportion by introducing at least one authentic investigative activity from the introductory activities. After presenting the topic to the students, the order in which the various activities (groups 2, 3 or 4) are presented can be chosen to engage the students with at least two activities from each type. At this point, the model suggests summarizing mathematically the activities of direct ratio, and then having the students do at least one activity using inverse proportion, to broaden, deepen and complete their insight into the topic. The three types of activities (groups 2, 3, and 4) are modular, but in accordance with the findings of the studies amongst young learners and adult learners throughout the world, it was discovered that the activities could be divided according to the difficulty rating: easy, which could be problems of pace and rate; medium, problems dealing with ratio, and the hardest, problems with scaling, which were the hardest (Ben-Chaim et al., 1998). First Core-supporting Unit: Structure of the Activity. All activities are uniform in structure. They are set up as authentic investigative problems which are relevant to the world of the pre-service teachers and elementary and middle school students. This supporting unit relates to the structure of each activity from three separate perspectives: 1. Form (Gestalt) Perspective. The uniform structure of each activity should be noted. First, a description of the authentic situation is presented, stating the relevant facts for solving the problem under investigation. Second are topics for discussion, including questions and hints that will help in analyzing the situation and discovering a solution; some concern finding the mathematical solutions, others concern the didactic difficulties in teaching the topic, and others deal with the need to find strategies in keeping with the various cognitive thinking levels of the students to solve the problem. 2. Content Perspective. Here the mathematical content of the assignment is focused on. The activities include tasks and problems of ratio and proportion, some for developing the concepts and some to broaden and deepen understanding. They include all three components of knowledge that are essential to comprehending ratio and proportion: intuitive knowledge, formal knowledge and algorithmic knowledge (see Part Two, Chapter 5: Proportional Reasoning—A Psychologicaldidactical View). The students deal with the three types of tasks that research literature has reported as being suitable for evaluating proportional reasoning: a) missing variable problems, in which three values are given, and the fourth must be found; b) quantitative comparison problems, in which the ratio of components is given, and comparisons must be made between them, (for example, which is the greater ratio); and c) problems of quantitative estimation and comparison, which require comparisons which are not dependent on quantitative values (for example, determining whether the density of animals greater in the north or south of the country). 17
CHAPTER 3
3. Didactic Perspective. Here, the uniform teaching process for each of the activities is examined. This process includes the following four stages: a) Teamwork. The initial introduction to each authentic investigation will be done in groups of 4-6 students, so that they may combine their intuitive knowledge, based on past personal experience, both as students and as teachers. The instructor can use this knowledge as a basis for developing the concepts to be taught. The members of the group summarize and present their suggestions for solving the problem. b) Discussion. The discussion opens after the presentation of the suggestions that the groups developed. During this discussion, the instructor will introduce mathematical and pedagogic/didactic content, along with appropriate research reports which will enhance the topic. c) Conclusion. Following the discussion, the instructor will sum up the activity both mathematically and pedagogically/didactically. A similar summarization, but broader and more encompassing, will be done after a group of assignments relating to a single topic has been completed. (Further explanation can be found immediately below, in the section on the didactic supporting unit.) d) Homework. Assignments are handed out for practice, and to broaden the understanding of the topic. Second Core-supporting Unit: Didactic Element. The instructional process in the model is based on a number of didactic elements. The didactic unit has three dimensions and may span more than one lesson. 1. Authentic investigative activities. Every didactic unit comprises a number of investigative activities that relate to the same concept and are presented in a combined mathematical and pedagogic/didactic view. For example, a didactic unit whose purpose to develop the concept of ratio, must include activities which relate to the concept of ratio in its broad definition, another activity that uses this concept for dividing a given whole, one for finding the whole depending on the given ratio, and an additional activity that presents a number of ways of comparing quantitative data, when the ratio is given or it is possible to calculate it. 2. Assessing a research report. The didactic unit includes a mathematical or pedagogic/didactic article in the course of study. Assessing the report will be done by the students as part of their assignments (see Part Four: Assessment Tools, and Part Five: A List of Annotated Sources), to be presented before their peers. 3. Summary. The instructor will present a summary of the topic/concept of the didactic unit, from both a mathematical and pedagogic/didactic viewpoint, while including research results that were mentioned in the reports and analyzed. The purpose of this concluding activity is to organize the knowledge acquired during the experiential stage of the authentic investigative activities, and to tie in the theory relating to the concept to actual experience. Third Core-supporting Unit: Evaluation. The model illustrates three assessment tools that can be introduced before, during, and after the course (for details, see Part Four: Assessment Tools). 18
TEACHING MODEL
1. Attitude questionnaire. This is a questionnaire with various statements about mathematical and pedagogical attitudes about ratio and proportion, and also concerning teachers’ confidence in teaching the topic. It also includes an open-end questions section that asks the participant to supply original examples of the concepts studied and to illustrate them. 2. Questionnaire for assessing mathematical knowledge: This is a questionnaire with short mathematical investigative questions that pertain to the different aspects and types of ratio and proportion. It evaluates the didactic knowledge that the pre- or in-service teacher has regarding teaching the subject in school. These two questionnaires are invaluable tools for the instructor to assess the knowledge and the progress of the pre- or in-service teachers over the duration of the course. 3. Instructions for assessing research reports and building a portfolio. By having the skills to use reports, the participants in the course become able to combine the practical experience gained during their investigations with theoretical knowledge presented in the reports. Gathering and presenting the course material into a portfolio aids in consolidating the information learned. Both the analyses of the research reports and the final portfolio serve as a means for the instructor to assess his students’ skills, knowledge and progress in the course. These guidelines will also be invaluable to the participant after the course.
19
PART TWO
THEORETICAL BACKGROUND
CHAPTER 4
A MATHEMATICAL PERSPECTIVE OF RATIO AND PROPORTION
THE CONCEPT OF RATIO
Mathematical Definition of “Ratio” The concept of ratio has many uses in mathematics and is of great importance in other areas of knowledge (Ben-Chaim, Keret, & Ilany, 2007; Avcu & Avcu, 2010). Lemon (2007) states that of all the topics in the school curriculum, fractions, ratios, and proportions arguably hold the distinction of being the most protracted in terms of development, the most difficult to teach, the most mathematically complex, the most cognitively challenging, the most essential to success in higher mathematics and science, and one of the most compelling research sites (p. 629). In mathematics, the concept of ratio is fundamental to many topics. Children encounter the concept in the earliest years of elementary school, even if they are not introduced to the actual word. They first learn the specific word “ratio,” in Grade 6. In fact, many sections of the elementary and middle school curriculum refer to, directly or indirectly, the concept of ratio. Price per item, fractions, percentages, probability, problems in motion, measurement, enlargement and reduction of shapes and figures, and π as a ratio between the circumference of a circle and its diameter, are just a few examples of ratios in the mathematics curriculum of elementary and middle school. In junior and high school, many of the phenomena studied can be defined as a ratio between two magnitudes. For example, in geography, the concept of “population density” can be defined as the ratio between the number of individuals and the area they occupy. The concept of “scale” in cartography (map-making) is essentially the ratio between a unit of length on a map and that same unit in reality. In the sciences – especially physics and chemistry – ratio is used to define various phenomena, such as velocity, acceleration, power, specific gravity, gravitational force, and concentration. “Ratio” is used in economics and statistics to calculate profit-and-loss and probability; and in technological studies for calculations in engineering, mechanics, robotics, computer science, among others.
23
CHAPTER 4
In mathematical notation a:b or
a , when b ≠ 0. b The definition can be expanded to:
a:b:c:d:e or a / b / c / d / e, when a ≠ 0, b ≠ 0, c ≠ 0, d ≠ 0, e ≠ 0. Ratio can be used explicitly in many ways as can be seen in the following examples. - In a bouquet of flowers, the ratio between tulips to roses is 1:3. For every 4 flowers in the bouquet, 1 is a tulip and 3 are roses; or, of all the flowers in the bouquet, ¼ are tulips and ¾ are roses. If there are 3 tulips in the bouquet, then there will be 9 roses. - The ratio between the number of boys and girls in a class is 3:4, meaning that for every 7 students in a class, 3 are boys and 4 are girls; or, 3/7 of the students are boys, and 4/7 are girls. If, say, there are 18 boys in a class, then the total number of students would be 42, of which 24 are girls. - The score of a football game, 2:3, represents the ratio between the numbers of goals scored by one team (2) to the number of goals scored by the other (3). In other words, the losing team scored 40% (= 2/5) of the total number of goals, while the winning team scored 60% (= 3/5). - The ratio between flour and sugar in a recipe is 2:1. That is, for every 2 cups of flour, 1 cup of sugar is used. - The ratio between the length and width of a rectangle is 2:1. That is, the length is twice the width, or, conversely, the width is half the length. - The ratio between the numbers of pizzas to the number of diners at a table in a restaurant is 8:10. If there are ten children at the table, they must divide 8 pizzas among them, and each child will get 4/5, or 80% of a pizza. There are many instances where “ratio” is not explicitly obvious, and prerequisite knowledge is required to perceive that the concept is actually based on a ratio between two terms. For example:
24
MATHEMATICAL PERSPECTIVE
- “Velocity” can be defined as the ratio between the distances that a car travels to the time it takes to travel that distance. - “Scale” (in measurement) can be defined as the ratio between a unit of measure on a map and the real distance (using the same unit of measurement). - “Population density” is the ratio between the numbers of inhabitants to a given unit of area. - “Equilibrium” on an equal-arm balance is obtained when there is an inverse relationship between the lengths of the arms and the masses of the weights at each end. In other words, the product of each pair is constant. - “Gasoline consumption” is measured as the ratio between kilometers (miles) traveled to liters (gallons) of gasoline used (km/l or m/g); conversely, gasoline consumption can also be expressed by liters per kilometer (l/km) or gallons per miles (g/m). In mathematics, “ratio” is the quantification of a multiplicative relationship that is calculated by dividing (or multiplying) one quantity by another. The multiplicative quantifier is determined by dividing (or multiplying) two magnitudes. For example, if there is twice the number of hours of instruction in an advanced course as compared to a basic course, then we can compare mathematically the hours in the advanced and basic courses. In this case, the ratio 2:1 is the quantification of the multiplicative relationships between the two units. There are other relationships in mathematics that are not multiplicative. Some examples are additive (or subtractive) relationships (those where the difference between two measurements remains constant, that is, one is consistently larger or smaller than the other by a same amount, k); logarithmic relationships; and trigonometric relationships.
Explanations on the Definition of Ratio Ways of representing ratio. A ratio can be depicted in a number of ways. For example, we can write that the number of red beads to white beads in a necklace as 3 to 5, or 3:5, or 3/5. But are all three expressions the same? At first glance, each expression shows that for every 3 red beads, there are 5 white ones. That is, the three expressions express the same situation. However, mathematically, each form presents a different emphasis. - “3 to 5” describes the situation verbally, without any mathematical implication. - “3:5” describes the pattern using the concept of ratio. - “3/5” is a fraction, and thus implies that the given relationship can be defined in this case as the rational number 3/5. Actually, if given that the ratio between red beads to white beads in a necklace is 3:5, then it is possible to present this ratio in five different forms: - For every 3 red beads there are 5 white.
25
CHAPTER 4
-
For every 8 beads in the necklace, there are 3 red and 5 white beads. 3/8 of all the beads are red and 5/8 are white. Red beads are 3/5 the number of white beads. White beads are 5/3 the number of red beads.
Zero as a quantity in a ratio. In the previous paragraph, one definition of ratio was given as the mathematical procedure of division (quotient). Thus, certain restrictions will fall on the values with which the ratio is expressed. The division operation in mathematics (as are all other mathematical operations) is a binary operation, that is to say, two components (the numerator and the denominator) connected by an operating symbol. The result of this operation must be a unique one and within the domain of the group of numbers defined. In mathematical notation, the operation of division is written as a:b = c. The two components are a and b, the operating symbol is , and the result, c, must be unique and within the domain of numbers in which the operation is taking place (natural, whole, rational, or real numbers). It can immediately be deduced that zero (0), as one of the values in our mathematically expressed ratio, can only appear in the numerator, e.g. 0:7. In other words, only in a ratio of 0 to any other number that is not zero (0:a , a ≠ 0). Why? According to the laws of mathematics, a zero in the denominator position will result in an undefined result. An expression with a zero denominator has two possibilities: (1) the numerator is any number but zero (a: 0, a ≠ 0), or (2) the numerator is zero (0:0). In the first case, the result of the ratio is undefined, based on the definition of a binary operation. For example, for 7:0, there is no number for c that can satisfy the equation, 7:0 = c because there is no value, c, that can fit the expression, c × 0=7. In the second case (the numerator is zero), this is again an undefined value, but for a different reason: here, there is no unique solution for c, since the expression 0 × c = 0—the criteria for checking division by multiplication – is true in an infinite number of cases, which is also contrary to the definition of a binary operation. For this reason, a ratio must always be defined as a:b, b ≠ 0. Additionally, because ratios generally involve specific sizes and quantities, we may infer that neither component “a” nor component “b” will be a negative number. Since “ratio” is usually a concept expressing real-life occurrences, there are many examples where the mathematical definition above applies logically. However, there will also be situations that cannot be defined mathematically, even though they do actually exist. For example, if a certain quantity, a, is divided between two people so that the first person receives nothing, and the second, everything, we can easily write the ratio “0:a” to describe the situation. However, if the first person receives everything, and the second, nothing, then the ratio actually becomes a:0, which, as has been explained, is mathematically meaningless, despite the fact that it is describing a real occurrence that can be expressed verbally. Of course, we can reverse the relationship, and again write 0:a, and thus find ourselves back in familiar territory. That is to say, if the relationship between a:b is 2:3, it is possible to say that the relationship is also actually 26
MATHEMATICAL PERSPECTIVE
between b:a, and is 3:2. The conclusion is that it is necessary to distinguish between the verbal description of certain situations and their mathematical expressions. The complexity of describing the concept of ratio verbally alongside its mathematical depiction (i.e., using the operation of division, quotient, which leads to an expression of a fraction) becomes more obvious in a situation where two values that make up the relationship of the ratio are partitioned equally. For example, if a certain quantity, a, is divided equally between 2 people, the ratio between them is a a : , 2 2
or more generally, 1:1. There are innumerable examples in daily life that illustrate such a situation: For example, two people, A and B, each have $1,000,000. What is the ratio between them? Of course, the answer is 1:1, showing that it is equal. Mathematically speaking, as long as they both have the same amount (even if it is only 1 cent each), the ratio is 1:1. (For that matter, if they are both in debt for a million dollars each, the ratio is still 1:1.) But what happens if the two individuals have no money whatsoever, (and this is certainly a real possibility). The mathematical relationship is now 0:0, which, as we have shown, is mathematically meaningless. That is to say, this situation cannot be represented mathematically, despite the fact that it is very real, and that it is not so different from the other situations in which they had specific amounts of money or debt. Another real-life situation, and one that is certainly familiar to many, is the games result of the goals scored by two teams. Alongside results such as 3:2, those such as 0:0 and 3:0 are also common. However, in this situation, the concept of a fraction (as discussed earlier) is not implied and the verbal description of the situation is what is important. The point here is not to present an unequivocal or single definition for the concept of ratio. The point is to show that the mathematical definition of “ratio” is quite arbitrary. Hence, from the moment that the expression is defined mathematically, some specific situations are appropriate, and some are not. It becomes apparent that in any situation in which zero is one of the components, there is no point in depicting the relationship mathematically as a quotient, since there is no indication of how much bigger one value is than the other (or vice versa). In fact, it is quite possible that in this case the relationship will be an additive one, and the object is to describe how much larger (or smaller) one value is than the other. With a score of 3:0, it is understood that one team got 3 goals more than the other (an additive relationship), and not how many times one scored compared to the other (multiplicative).
The quantitative mathematical meaning of a given ratio. The concept “ratio” infers a multiplicative relationship between two values. Without additional 27
CHAPTER 4
quantitative data, it is, in fact, impossible to conclude what the actual values of the components of the ratio are. If we are given that the ratio of red to white beads in a necklace is 3:5 without any other information, it is impossible to know exactly how many beads are in the necklace. We can only know that for every 8 beads, there are 3 red and 5 white; or, that for every 3 red beads, there are 5 white ones. However, once a quantitative value is supplied, such as the number of red or white beads, or the difference between the total numbers of each, it becomes possible to make inferences regarding actual numbers. In our example, if we are given that the ratio of red to white beads is 3:5, and we are also given that the difference between the numbers of white beads to red is 6, then we can calculate that there are exactly 24 beads in our necklace. [For each unit of 8 beads—3 red and 5 white—there are 2 more white than red. Since the total difference is 6, there must be 3 units of 8 beads, thus the total amount of beads is (3 × 8) 24, 9 of which are red (3 × 3), and 15 of which are white (3 × 5).]
Additive thinking leading to addition and subtraction vs. multiplicative thinking leading to multiplication and division. Problems requiring comparison of sizes or quantities are commonly encountered in mathematics. If the goal is to find how much a certain quantity is larger or smaller than the other, addition or subtraction is used. Comparison by addition or subtraction is the first method encountered by pupils in primary school and for many this concept continues to dominate any situation that requires comparative thinking. However, the types of problems in which addition or subtraction will not be effective are many, and a multiplicative strategy that involves understanding the concept of ratio is required. For example, in which store is it more advantageous to buy a CD: store A, offering 7 CDs for $40, or store B, at 6 for $39? The ratios of 40/7 and 39/6 are easily derived. However, students with only additive reasoning skills will think that the two relationships are equal; since it appears that the difference between the numerators is equal to the difference between the denominators. Such a misconception obviously leads to an incorrect solution. Simple subtraction is not appropriate here. A multiplicative relationship is required to compare between the two stores, and this can be calculated in a number of ways: 1. the price per CD in each store ($5.71 in Store A, and $6.50 each in Store B); or 2. the ratios of the price per number of CDs as fractions—to determine which fraction is larger/smaller (40/7 for Store A, 39/6 for Store B); or, 3. the number of CDs that can be bought in each store with a given amount of money. For example, $78 will buy 13 CDs in A with a residual of some change and 12 CDs in B, or alternatively, 4. how much the same number of CDs will cost in each store (42 CDs in A will cost $240 and in B, $273). In every case, the conclusion will be that store A gives the better value (or A gives “the better buy”).
28
MATHEMATICAL PERSPECTIVE
Types of Ratio From the ideas conveyed by Freudenthal (Freudenthal, 1978, 1983), comparing between two or more values can be carried out in one of three methods: - Comparing magnitudes of different quantities with an interesting connection, as in ‘kilometers per liter,’ ‘people per square kilometer,’ ‘kilograms per cubic meter,’ or ‘unit price.’ As a rule, these comparisons are not called ratios, but rather rates or densities. - Comparing two parts of a single whole, as in ‘the ratio of girls to boys in a class is 15 to 10’; or ‘a line segment is divided in the golden ratio.’ - Comparing magnitudes of two quantities that are conceptually related, but are not naturally considered as parts of a common whole, as in ‘the ratio of sides of two triangles is 2 to 1.’ Such comparisons are often referred to as scaling, and they include problems of stretching or shrinking in similarity transformations. These categories illustrate, in essence, the multiplicative relationships that produce ratio. There is a difference to note, though, between the first one and the last two. In other words, in principle, two unique types of ratio exist, as will be discussed below (Karplus, Pulos, & Stage, 1983a).
Ratio as a Rate. The first type defined by Freudenthal, above, is known as rate, and illustrates a comparison between two variables with different units. It is produced by a multiplicative relationship depicting some natural physical phenomenon, or from some new arbitrary concept defined for a functional purpose. A ratio of this sort produces a unique, new concept with its own entity, and this new concept is usually not considered a ratio, per se, but a rate or density. Examples of ratios that derive new physical concepts are the following: - The ratio between the distance traveled by a car and the time it takes to travel that distance s v = . t
1) This ratio produces the concept of “speed” or “velocity”. - The ratio between the weight of a body to its volume gives the density of a material, and produces the physical concept of “specific gravity.” - The ratio between the length of the arm of a balance and the weight of the mass at the end of the arm (in this case the constant ratio is a constant product with a new special unit) is responsible for achieving “equilibrium” on an unequal arm balance. “Equilibrium” is attained when there is a proportion of indirect ratio between the lengths of the arms and the weights of the masses at the ends. That is to say, there is a constant ratio between the length of the arm and the weight of the item for both arms.
29
CHAPTER 4
Intensive and extensive quantities. Regarding the concept of rate, the phrases “extensive quantities” and “intensive quantities” are found in the professional literature (Thompson, 1994; Kaput & West, 1994; Lesh, Post, & Behr, 1988; Howe, Nunes, & Bryant, 2010a,b). For example, Kaput and West (1994) state that they use the convention that the “extensive quantities” mentioned in a problem statement consist of numbers and referents, where the referent identifies the measure, in some unit, of some aspect of an entity, situation, or event (length, area, temporal duration, monetary value, weight) ….Two extensive quantities can be used to construct an intensive quantity such as 3 pounds per cubic foot, 5 miles per hour, 3 pounds per 5 dollars, 3 parts of oil for 5 parts vinegar. We therefore use the phrase intensive quantity as a blanket term to cover all the types of quantities typically described in our culture as rates (speed, density, price), all manner of ratios (e.g., seven pieces of silverware for every four pieces of china), unit conversion factors (e.g., 3 ft/yd), scale conversion factors (1ft/in), and so on. Most of these can be described using the “x per y” locution (p. 239). The type of ratio that is rate remains constant for the system in question, no matter what the system’s size, or the size of the variables within. For example, the “specific gravity” (intensive quantity) of a body does not change even if its dimensions (weight and volume—extensive quantities) are enlarged or reduced. Similarly, if a given speed (intensive quantity) is constant, it remains constant over the different portions (distances and time—extensive quantities) of a journey. Following are examples of functional ratios that are also called rates (intensive quantities): - “Price per unit” is a new concept created to allow comparison between the prices of items, and is the ratio of total price to the number of items bought. - Kilometer per liter of gasoline (km/l) expresses the efficiency of a car. It is the ratio of the kilometers that a car traveled to the number of liters of gasoline used. - Number of items per area is a new concept measuring population density and represents the ratio of number of individuals to a given area, for example, number of deer/ km2.
“Pure” Ratios. In the second and third categories mentioned by Freudenthal, the ratio compares sizes or quantities with identical units (i.e., both the numerator and denominator have the same unit). In this case, the result has no units, similar to a fraction or unit-less number (this is called by us “pure ratio”). Examples of such comparisons are comparing between two parts of a particular whole, or between sizes of two quantities which are conceptually connected, but are not naturally considered as parts of a whole. By representing the ratio as a fraction, the reduction and enlargement properties of fractions can be applied to different situations.
30
MATHEMATICAL PERSPECTIVE
For example, - In a class, the ratio between boys (numerator) to girls (denominator) is 15/20 (or ¾).The ratio is expressed as a unit-less fraction. This is a comparison of two parts of a whole. - A scale of 1:200,000 is the relationship between 1 cm on the map to 200,000 cm (or 2 km) in actuality. In this case, the fraction 1/200,000 is obtained (no units). - The relationship between the circumference of a circle (P) and its diameter is π: (π =
P 2r
).
In this case, both values have the same unit (length) and yet the ratio that is created is an irrational number, meaning that it is impossible to write it as a quotient of two whole numbers. We can thus conclude that there are ratios that cannot be expressed by a fraction in which both the numerator and denominator are whole or rational numbers, but must be expressed as an irrational number. It will be remembered that trigonometric functions describe relationships between the lengths of sides of a triangle, and for many angles, the values obtained by these functions are irrational. - The relationship between the length of the sides of a right-angled triangle and its hypotenuse is, for example, 2/3. Again, the relation is represented by a fraction without units. This is a comparison between two elements connected conceptually (in the same triangle), but are not naturally considered parts of a common whole. - Enlargement and reduction uses ratios to keep the proportions of items constant. For example, if a picture that is 2 cm wide by 2.4 cm long needs to be enlarged so that the length is 7.2 cm, what must the new width be so that the picture will not be distorted? Since the relationship between the width and length of the picture after enlargement must not be changed, it will stay 2:2.4. This is a ratio expressed by a fraction and it is possible to expand or reduce at will. Reduction by a factor of 2 will result 1:1.2 and enlargement by a factor of 3 will result 6:7.2. (One can also express these in whole numbers, such as 5:6 or 30:36). This type of ratio, will be dealt with separately (in Part Two of the book), and especially with respect to the many uses made in geometry (similarity) and geography (scale). This type of ratio is known in the professional literature as scaling. The complexity of ratio concept and difficulty in the differentiation between its types is expressed in the following paragraph from Thompson (1994): Although there is an evident controversy about distinctions between ratio and rate, each of these distinctions seems to have at least some validity. My explanation for this controversy is that these distinctions have been based largely upon situations per se instead of the mental operations by which 31
CHAPTER 4
people constitute situations. When we shift our focus to the operations by which people constitute rate and ratio situations, it becomes clear that situations are neither one nor the other. Instead, how one might classify a situation depends upon the operations by which one comprehends it (p.190). Thompson and Thompson (1994), and Kaput and West (1994) studied the conception of ratio among children in a situation describing the intensive value, speed (V = S:T). As stated, an intensive value is a rate ratio derived from two extensive values: the distance that a body travels (S) and the time required to travel that distance (T). The researchers differentiated between various levels of conceptualizing the ratio, where the highest level involved the child’s grasp of the mathematical value as a measurable multiplicative relationship, at a level of an intrinsic relationship. At this high level, the child understands that the speed of the object traveling some certain distance (intensive value), is measurable as a quantity and does not change along various sections of the route, regardless of the length of those sections (which are extensive values that are changing constantly) or their position. Such understanding allows the student to compare quantitative relationships at different sections over the length of the route and to find a mathematicalquantitative solution for a missing value, using the proportional relationship. In other words, if a person is at a stage where he is not able to understand the relationship as an intensive quantity, then he will relate to it as an extensive quantity and the concept will be conceived as a ratio. At a later stage, when the person is able to understand the relationship as an intensive quantity, then the quantity can be identified as rate. Further discussion and clarification of this issue can be found in Lamon (2007, pp. 633–635). THE CONCEPT OF PROPORTION
Mathematical Definition of “Proportion” Like “ratio,” the concept of “proportion” is often used for solving problems in mathematics and other fields. Proportional problems involve situations in which the mathematical relationships are multiplicative (as opposed to additive) in nature and allow the formation of two equal ratios between them. The ability to solve such problems indicates the existence of proportional reasoning, which leads to abstract thinking. In mathematics, pupils in middle school are already beginning to use “proportion” to solve a wide range of problems, though it is not always explicitly stated as such. In grades seven and eight, they learn to solve problems in algebra (such as dividing quantities into unequal parts, pricing, profit and investment, percentages, motion, and energy). In grade nine, they meet equations expressed as a proportion (for example: 20 / 4 = × / 7 × = 35) and, they use proportion explicitly in geometry, as in the case of Thales’ theorem and triangles similarity. In the upper levels of high school, proportion is used in almost all domains, but again, not always explicitly. Proportion is implicit in trigonometry as in the law of sine: 32
MATHEMATICAL PERSPECTIVE
a b = , sin α sin β
in algebra (problems of price, percent, velocity, power, work, concentrations of solution), in economics, in mathematical analysis, and in the definition and calculations of functions (such as the linear function, y = k x, where k, the slope, is defined as the ratio between Δy and Δx ). Besides mathematics, and especially in the exact sciences, there is virtually no subject that does not involve the use of proportion in some way, though, again, not always explicitly. In elementary school science, many phenomena in nature and technology, even simple mechanics (the wheel, the simple crane, the inclined plane), require a basic understanding of the concept of proportion. In geography, proportion is used to calculate distance according to a scale. In middle and high school, many of the phenomena learned in physics, chemistry, biology, geography, and economics can be defined using “proportion.” The rules and properties of proportion are often used to calculate probability, acceleration, and equilibrium; they play a part in statistical calculations, cartography (map drawing to scale), profit and loss, and more. Below are two definitions of proportion.
In mathematical notation, this means that four variables, a, b, c, and d (a ≠ 0, b ≠ 0, c ≠ 0, d ≠ 0) will form a proportional relation in the following two situations: 1. When a / b = c / d. This is direct proportion: the quotient of the two parts of the ratio, a and b, is constantly equal to that of c and d. 33
CHAPTER 4
2. When a × b = c × d. This is indirect proportion: the product of the two parts of the ratio, a and b, is constantly equal to that of c and d.
Explanations and Comments on the Definition of Proportion Another look at the concept of proportion. The Collins Dictionary of Mathematics (Borowski & Borwein, 1989) also adds another aspect to the definition of proportion. It states that proportion is a direct or indirect linear relationship between two variable quantities. This means that corresponding elements of two sets are in proportion when there is a constant ratio (either direct or indirect) between them. For example, according to the gas laws, pressure is directly proportional to temperature: the quotient derived from pressure (numerator) and temperature (denominator) will be constant; however, pressure is inversely proportional to volume, meaning that the product between volume and pressure will be constant. Examples of direct and indirect proportions,. An example of direct proportion is the quotient obtained when a car travels a distance (s) over a certain time (t), giving us a relationship (s/t) that defines the velocity (v) of the car (v = s/t). Up to this point, we are defining a ratio. However, if we specify that this ratio remains constant over time (that is, the quotient—the velocity—is constant), then an increase or decrease in distance, will yield an increase or decrease the time by the same factor (the change is in the same direction). Thus, the distance traveled and the time it takes to travel that distance are “directly proportional”, and the velocity s1 s 2 is constant ( = ). t1 t 2 An example of indirect proportion is the multiplicative relationship between the velocity of the car and the time needed to travel a distance. This is a “ratio” if the distance remains constant, meaning that the product of velocity and time is constant. However, here the relationship is an indirect one, because if the speed increases by a certain factor, then the time will decrease by the same factor, and vice versa. The change is in opposite directions, and thus the relationship between velocity and time (v1 / v2 = t2 / t1) is said to be “inversely, or indirectly, proportional”. In this case, the constant value is the distance traveled, and v1 × t1 = v2 × t2. How students might recognize proportional relationships. Students will be able to recognize that there is a proportional connection between two or more of the variables in a problem when they are able to identify the two criteria (below) that identify a problem as one of proportion. Once they are able to do this, they will be able to discover a solution based on proportional reasoning. The two criteria are as follows: 1. There must be a multiplicative relationship (a ratio) between the two values. In other words, the relationship can be expressed mathematically as either the product or the quotient (ratio) between two or more values. For example, in
34
MATHEMATICAL PERSPECTIVE
problems of speed, there is a multiplicative relationship between speed and time (v × t—multiplication) or distance and time (s / t—division). 2. The multiplicative relationship must be constant, either in the same (direct proportion), or opposite (inverse proportion) direction. Once a multiplicative relationship has been recognized, the student must also understand that this relationship remains constant at all times. In the case of direct proportion, where the multiplicative relationship is expressed as a constant quotient between the two values, the constant never changes. (In other words, if the numerator increases, then the denominator will increase by the same amount. Similarly, a decrease in the numerator will lead to a decrease in the denominator. The change is in the same direction.) In the case of inverse proportion (indirect proportion), the multiplicative relationship is expressed by the constant product between the two values, which stays constant. (In case of positive variables, if one of the values increases, the other one decreases, and vice versa. The changes are in opposite directions.) A student who can identify such multiplicative relationships is said to possess multiplicative reasoning skills and will usually be able to correctly solve such problems. Young children, who are still at the additive-reasoning level, will generally not recognize the multiplicative aspect of the problem. They will relate instead to the difference between the quantities, leading to an incorrect solution.
Further Insights into Direct and Inverse (Indirect) Proportion Direct proportion
Examples 1. If a map with a scale 1:100,000 shows a road to be 5 cm long, the actual road is 5 km. (Note that the units must be equal, so the scale means 1 cm to 100,000 cm, or 1 cm to 1 km.) Because the multiplicative relationship between the length of a road on the map and the real length of a road is directly proportional, if another road on the map is longer or shorter by a factor m (say, 2), the actual road will also be longer or shorter by a factor of 35
CHAPTER 4
m than the 5-kilometer road. In other words, if a “new road” on the map is now 10 cm long (a factor of 10/5 = 2) the actual road will also be twice as long, i.e. 10 km. 2. A car travels 60 km in one hour at constant speed. In other words, the car travels at 60 km/hr. The proportional relationship between the distance traveled and the time needed for the car to travel this distance is direct. If the distance to travel is increased by a factor, m, then the time needed to travel it (without changing the speed) must also be increased by a factor of m. To be more specific, if the distance to be traveled is increased by, say, m=5 (i.e. to 300 km) then the time needed to travel those 300 km will be 1 hour times 5: it will need 5 hours to travel 300 km at the same speed. Inverse (indirect) proportion
Examples 1. Equilibrium of an equal-arm balance occurs when the products of the length of the arms (p) times the weights of the item on the corresponding trays (w) are equal. To keep the balance, an increase in the weight of an item on one of its arms by factor m, must be followed by a decrease the length of that arm by factor m. Conversely, if we reduce the weight of the item by factor m, we must increase the length of the arm by factor m. Equilibrium of a balance has an inverse proportional relationship between the lengths of the arms of the balance (p) to the weight of the item on them (w). Mathematically this is written: w1 / w2 = p2 / p1 or w1 × p1 = w2 × p2. 2. A car traveling a specific distance exhibits an inverse proportion between velocity (v) and time (t). If the car speeds up by factor m, then the time needed to travel that distance will be reduced by factor m, and vice versa. In other words, the product of the speed × the time remains constant. (s = v × t). Mathematically: v1 / v2 = t2 / t1 or v1 × t1 = v2 × t2. 3. For any job, there exists an inverse proportion between the number of workers (n) and the number of days (t) required to do that job. If the number 36
MATHEMATICAL PERSPECTIVE
of workers is increased by factor m, the number of days required to do that job will be reduced by factor m; if the number of employees is reduced by factor m, the time required will be increased by factor m. In other words, the product of the number of workers and number of days remains constant. Mathematically: n1 / n2 = t2 / t1 or n1 × t1 = n2 × t2. STRATEGIES USED FOR SOLVING RATIO AND PROPORTION PROBLEMS
Studies investigating strategies used for solving problems of ratio and proportion discovered a wide range of strategies being used. In keeping with the developmental process of the proportional scheme, the older an individual is, the higher the level of sophistication of the chosen strategy, progressing from preformal strategies (yielding qualitative solutions) up to formal ones (eliciting a mathematical-quantitative solution). For more details, see the next chapter on the development of proportional reasoning. It is important to point out that in order to correctly solve problems of ratio and proportion, the strategy chosen must have a multiplicative orientation; an additive strategy generally leads to incorrect solutions (except for those instances where it is possible to divide the total amount into equal groups with a whole number of items.) As stated before, strategies can be divided into pre-formal and formal strategies (by proportional equation). To illustrate the different strategies, the different strategic thinking processes that can be used for a specific problem and solutions arrived thereby are presented and analyzed below. The following problem will be used:
Pre-formal Strategies Pre-formal strategies to solve ratio and proportion problems are typical of children in elementary school (see details in following chapter.).
1. Intuitive strategies. These are suitable for very simple proportional problems and demonstrate an intuitive grasp of multiplicative relationships. Children may arrive at the correct solution using direct experimentation without being aware of the equality that exists between the two ratios. In our example, the students will guess the number of items each person gets. It is possible that after a number of trials, the correct answer will be found.
37
CHAPTER 4
2. Additive strategies. Additive strategies are typical of young children with additive reasoning skills (generally in the lower grades of elementary school). Here, the focus is on the quantitative differences between the values in the problem rather than the ratio between them. When it is impossible to divide the total items in the problem equally into groups with identical whole numbers, or if the total is a very large number, this strategy is not effective and the children will almost certainly err. In our case, the solution will be a tangible one. The children will gather 35 items (e.g. 35 beads, or a diagram of 35 beads). They will take 7 items from the pile, and divide them up – A getting 3, and B getting 4. They will then take 7 more items, and again divide them, 3 to A and 4 to B. They will continue this procedure until they have run out of ‘beads.’ In our example, it is possible to extract exactly 5 groups of 7 items each. Often, a table formation will be used, as the following: Table 1.Using additive strategy
Group No.
A
B
Total
1
3
4
7
2
3
4
7
3
3
4
7
4
3
4
7
5
3
4
7
Total
15
20
35
The addition of the items received in each group, yields the number of items each person receives.
3. Division by ratio. This strategy requires that the student be aware of the given ratio, and appreciates the multiplicative relationship that exists between the values given in the problem. In our case, the student understands that the ratio 3:4 describes a situation in which a group would contain 7 items (i.e. 3 items for A and 4 for B). The student also understands that this ratio, 3:4, will be preserved for the entire amount, and also for any group within the whole. The student will then calculate how many groups are in the whole, arriving at 5 groups (35:7). A receives 5 groups, each one with 3 items, therefore, A 3 × 5 = 15 items B receives 5 groups, each one with 4 items, therefore,
38
MATHEMATICAL PERSPECTIVE
B 4 × 5 = 20 items Tangibly, this problem could be visualized as follows. Before us are 35 items, and a number of drawers. Each drawer is divided into one section for A and one for B. Into the first drawer we place 3 items in A’s section, and 4 in B’s. We continue to fill drawers until all the items have been distributed. The result is that 5 drawers, each with 3 items for A and 4 for B, have been filled. In essence, this strategy is simply a generalization of the additive one, bearing in mind that multiplication and division are essentially generalizations of addition and subtraction. However, here the act of division has replaced the repeated subtractions of the additive strategy, and then, multiplication has replaced the repetitive additions of the additive strategy.
4. Finding the unit (sometimes using a corresponding table). In both this strategy and the one following (finding the part from the whole), the student defines the ratio as the unit, or a part of the whole, in order to calculate the entire amount or the amount of each portion, and then builds his solution on that. Here, the student is aware of the fact that 35 items make up the whole. The student divides the whole into 7 units (3 + 4) and then concludes that in every unit there will be 5 (35/7) items. Continuing in this way, the student calculates the portion that each receives: A receives 3 units out of 7, therefore A 5 × 3 = 15 items B receives 4 units out of 7, therefore
B 5 × 4 = 20 items Or, using a corresponding table to find the unit 35-------------------7 ?--------------------1 (the unit), Giving
? = (35 × 1)/7 = 5 items. That is, in every unit there are five items, and the solution continues as above. In order to comprehend the difference between this strategy and the previous one (division by ratio) we return again to the model presented above. Again, there are 35 items, but this time we choose 7 drawers (3 + 4) since the ratio given is 3:4. After filling the drawers equally, A will receive the items in 3 of the drawers, and B will receive those in the remaining 4. And while both this and the previous strategy use the same mathematical function (35:7), the intrinsic understanding is 39
CHAPTER 4
different for each: in the previous strategy the result comes from the number of groups of 7 items, each group comprising 3 items for A and 4 for B. In the present strategy, there are 7 identical groups, of which 3 go to A and 4 go to B. Here, division is used to find the amount that must be equal for all groups. The difference between the two divisions operations are expressed in the two methods discussed: division by inclusion (relative division) and division by partitioning (determining the basic unit).
5. Determining the part from the whole. In our example there is 7/7 parts (3 + 4) in the whole and there are 35 items, therefore: A receives 3/7 of the total (35) items. That is A 35 × 3/7 = 15 items B receives 4/7 of the total items. That is
B 35 × 4/7 = 20 items 6. Missing Value Problems. Missing value problems are an extension of tables, and are often very effective. Difficulties arise when students attempt to solve inverse proportion problems using the same method as for direct proportion 3 4
---------
x 35-x
Therefore: 4x = 3 × (35 – x)
A x = 15 items; B 35-x = 20 items. Note: Since solving algebraic equations is usually learned in middle school, children in elementary school will solve problems with algebraic equations using other strategies.
Formal Strategies – The Proportion Formula Using formal strategy, that is, using the proportion formula a c = , (a, b, c, d ≠ 0) . b d
This is typical of adolescents and adults and indicates the existence of proportional reasoning and abstract thinking. At this stage the student will be capable of using algebraic symbols to represent proportion, and will succeed at finding the correct quantitative answer to a problem by using the rules and properties of algebra. In our example,
40
MATHEMATICAL PERSPECTIVE
x = the numbers of items for A 35 – x = the number of items for B. The ratio between them is 3:4, in other words, they have a proportional relationship. In order to find the number of items each gets, we use the fact that the proportionality between the numbers of items of each can be expressed by the proportion formula thus:
x 3 = . 35 − x 4 Solving the equation algebraically, we get: A 4x = 3 × (35 – x) 15 items. B 35 – x = 20 items. Note: Similar to the missing value problem strategy (see 6. above), an algebraic equation is obtained. Students in elementary school do not know how to solve such equations and thus must resort to other strategies. MATHEMATICAL PROPERTIES OF THE CONCEPTS OF RATIO AND PROPORTION
Adaptation of the Laws of Fractions on Ratios A ratio between two quantities can be represented by a fraction, and thus the laws of fractions can be applied to ratios, as is explained below. Reduction and expansion of a ratio (a, b, m ≠ 0) Given the ratio a / b, it is possible to expand the ratio by m to get a / b = (m × a) / (m × b), or to reduce the ratio by m to get a / b = (m:a) / (m:b). Reducing or expanding fractions (ratios) in the process of solving a ratio-and-proportion problem is common; for example, if the ratio can be reduced (simplified) to get a simpler ratio, calculations with smaller numbers are enabled. Alternatively, when the given variables are not whole numbers, the ratio can be expanded so as that the numerator and denominators are whole numbers. Addition and subtraction of ratios (a, b, c, d, ≠ 0). Given a ratio a / b and a ratio c / d, it is possible to create new ratios of a c ± b d by adding or subtracting the values. For example, the addition of two ratios is required in the following: Students in a class are divided into groups depending on their achievements. Group 1 students 41
CHAPTER 4
are high-level achievers, group 2 students are average, and group 3 students are weak achievers. The ratio between the number of weak achievers and the total number of students is 1:3, and the ratio between number of average achievers and the total number in the class is 1:4. What is the ratio between the number of high achievers and the entire class? To arrive at the solution, the ratios 1 3
1
+
4
must first be added, and the result subtracted from 1. Thus, 1−
7 12
=
5 12
If the ratio of the combined number of weak and average achievers to the entire class is 7:12, and the ratio of just the weak students to the entire class, is 1:3, and the ratio of the average achievers to the entire class is desired, then subtraction would be used as follows: 7 12
−
1 3
Multiplication of ratios: (a, b, c, d ≠ 0). If a ratio a / b is given and a ratio c / d is given, it is possible to form a new ratio by multiplication: a c × b d
This property would be used in a problem in which two ratios must be considered concurrently. For example, a restaurant has two types of tables: large tables with 10 places, and small tables with 8. The owner wishes to have a ratio of large to small tables of 9:5, and to have room for exactly 390 diners. How many tables of each must there be? In this case, the “common ratio” between the two given ratios must be derived. The first ratio, 10:8 represents the numbers of places at each type of table (10 places at the large table to 8 at the small). The second ratio, 9:5, represents the ratio of the number of tables overall (9 large tables for every 5 small). The common ratio will thus be 10 9 10 × 9 90 × = = 8 5 8 × 5 40
which, in fact, is the ratio of the number of places around a group of 9 large tables (10 × 9) and 5 small tables (8 × 5) – a total of 130 places in the group. Since the owner wants 390 places altogether, then we require 390:130 = 3 groups of 9 42
MATHEMATICAL PERSPECTIVE
(large) + 5 (small) tables. That is, he will require 27 (9 × 3) large tables and 15 (5 × 3) small tables. Division of ratios: (a, b, c, d ≠ 0). Given a ratio a / b and a ratio c / d, it is possible to form a new ratio by division of the ratios: a c : b d
a×d b×c
This property is used when the purpose of the exercise is to find how much larger (or smaller) one ratio is than the other. The Rules and Properties of Proportion Given a proportion a c = , (a, b, c, d ≠ 0) b d then a × d = b × c. This can be proven algebraically by cross-multiplication. Similarly, it is possible to inverse the ratio components of the proportion and get b d = a c
From this first rule, we arrive at an important property: one can exchange variables b and c (internal terms), and variables a and d (external terms). That is, if the given proportion is a c = , (a, b, c, d ≠ 0) b d
then the proportions a b d c = and = c d b a
are also true. This property demonstrates that it is possible to present a proportion in four different ways. It is important to note that there are 24 combinations possible when arranging 4 values. Thus, there is much room for students to err when attempting to match the proportional variables. Another rule applies in the case where a number of ratios are given. The rule states that a ratio that results from addition or subtraction of the numerators and the addition or subtraction of the denominators is equal for each of the given ratios. Mathematically, this is written: 43
CHAPTER 4
a c e g a±c±e± g = = = = (a, b, c, d , e, f , g , h ≠ 0) b d f h b±d ± f ±h
For example, if a c = b d
then a a+c = b b+d By using cross multiplication it follows that a × b + a × d = a × b + b × c, therefore a × d = b × c, and so a c = b d Other rules can also be derived from algebraic manipulation: For example, given the proportion a c = , (a, b, c, d, ≠ 0) b d the value of 1 (or actually, any other number) may be added or subtracted from each ratio: a c ±1 = ±1 b d By finding the common denominator for each side, we arrive at a±b c±d = b d
Application of the Rules and Properties of Proportion Finding the fourth proportional value in proportional equations. When a proportional relationship exists between 4 variables, and 3 of the variables are known, the fourth proportional may be found by using the rules and properties of proportions. Example 1: Given a/b = c/x. Therefore x = b × c/a. Similarly, if given x/b = c/d, then x = b × c/d, and so on. 44
MATHEMATICAL PERSPECTIVE
Example 2: The value of x in a given proportion is as follows: (x – 2)/x = (x + 4)/15. By using cross multiplication, 15 × (x – 2) = x(x + 4) x2 – 11x + 30 x1 = 5; x2 = 6. Of course, in this case, it is imperative to know how to solve quadratic equations. Missing value problems—finding the fourth proportional in proportional problems. Here, a proportion between 4 variables is given, where the values of three are known, and the fourth must be found. In fact, in order to solve this problem, the ratios must be compared. Example: In a course given in a school, 12 students are from outside the city, and 20 live within. This ratio happens to be the same in a second course given concurrently. How many seats must be reserved on the bus if 25 students in the second course live in the city? Let x be the number of students in the second course that live outside the city. Accordingly, the ratio 12/20 is equal to the ratio x/25 (x/25 = 12/20). The proportional equation is then solved, resulting in 15 students in the second course that live outside the city. Thus, bus seating for 27 (12 + 15) must be arranged. Freudenthal (1978, 1983) pointed out that missing variable proportion problems and value comparison problems can be solved using three different approaches: - Comparing ratios of the same variable or term, e.g. two lengths, two times. He calls this approach the use of “internal ratios” or “scalar method.” - Comparing the ratios of two different variables or terms, as, for example, distance and time. He called this approach “external ratios” or using the “functional method.” - Refraining from computation until the result has been found formally, or set up as a relationship that involves all the given data. The intention is to use algebraic notation for all the quantities and to formally isolate the missing value, and only then to “plug in” the actual values and compute. Examples of direct proportion 1. A car travels 135 km in 3 hours. What distance will it travel in 12 hours (at the same speed)? Solution: Here the quotient of distance over time must remain constant. That is, there is a direct proportional relationship between distance and time. Mathematically: x/12 = 135/3 x = 540 km. 2. A bookstore offers 5 textbooks for $135. How much will it cost a teacher to purchase 32 textbooks for his/her class? Solution: Here the quotient of price over number of books must remain constant. That is, there is a direct proportional relationship between price and number. Mathematically: x/32 = 135/5 x = $864
45
CHAPTER 4
Example of indirect (inverse) proportion A car travels 540 km at an average speed of 108 km/h. How long will it take a truck to travel the same distance if its speed is 1/3 that of the car? Solution: Here there is a constant product (the distance) between speed and time. That is, there is an inverse relationship between the speed and time. Mathematically: The speed of the truck is 1/3 the speed of the car, and is thus 36 km/h. The car travels 540 km in 5 hours (540/108=5). Let x be the time the truck requires. The proportion becomes: x/5 = 108/36 x = 15 hours. Comparing two ratios. Using the property that enables expansion and reduction of the ratio allows the comparison of two ratios. Example 1: Which fraction, 3/14 or 4/15, is greater? This may be solved by comparing the two fractions mathematically by expanding them to find a common denominator. Mathematically: 3 3 × 15 45 4 4 × 14 56 = = < = = 14 14 × 15 210 15 15 × 14 210
that is, 3 4 < 14 15 However, it is possible to compare the fractions by other methods. For example, a common numerator can be compared: 3 3 × 4 12 4 × 3 12 = = < = . 14 14 × 4 56 15 × 3 45 In this case, the numerators in both fractions are the same (12), and since the fraction with the smaller denominator is larger in value, 12/45 (4/15) is the larger value. Example 2: In comparison problems, the same properties of reduction and expansion are used. For example, car A travels 180 km in 3 hours, and car B travels 400 km in 5 hours. Which car is faster? Solution: The ratio of car A (distance to time) is 180/3. The ratio of car B is 400/5. We compare the ratios and get: 400/5 = 80km/h > 180/3 = 60 km/h. That is, car B is the faster one. Other applications of proportion. Proportionality between quantities is apparent in many areas. The rules of proportion can be used in solving many of these 46
MATHEMATICAL PERSPECTIVE
problems. For example, in Euclidian geometry, the relationship between proportional segments according to Thales’ Theorem can help find the properties of similar triangles. In elementary school geometry, the proportional relationship between the circumference of a circle and its diameter or between the length of the side of a square and its perimeter allows the discovery of missing values, such as the radius of the circle, or the length of the side of the square. In technology, inverse proportion between the lengths of the arms of a balance and the weights is used to find the center of gravity. In physics, multiplicative relationships exist between distance and time, defining speed, and allowing the calculation of one of the values (speed, time or distance) when only two of them are given; and between the weight and volume of a body, representing its specific gravity. In gas laws, there is a direct ratio proportional relationship between pressure and temperature, and an inverse ratio between pressure and volume. In geography, the ratio between distances on the map to real distance gives us the scale, and ultimately allows users to orient themselves in space.
47
CHAPTER 5
PROPORTIONAL REASONING—A PSYCHOLOGICALDIDACTICAL VIEW
Proportional reasoning is the human ability to make use of an effective form of the proportional scheme. This ability has a central role in the development of mathematical thinking, and is frequently described as a concept that, on the one hand, is a cornerstone of higher mathematics, and, on the other hand, is the peak of the basic tenets of mathematics (Lesh, Post, & Behr, 1988). According to the NCTM Curriculum and Evaluation Standards (1989), the ability to reason proportionally develops in students throughout grades 5– 8. It is of such great importance that it merits whatever time and effort that must be expended to assure its careful development (p.82). In 2000, the NCTM claimed that proportionality “is an important integrative thread that connects many of the mathematics topics studied in grades 6–8” (p.217). Thompson and Bush (2003) indicate that students traditionally develop and sharpen proportional reasoning skills during late elementary school and through middle school. Proportional reasoning adeptness provides later support for algebraic and scientific concepts at the secondary school level. According to Fuson and Abrahamson (2005) and Lamon (2007), proportional reasoning with the concepts of ratio and proportion are widely regarded as a critical bridge between the numerical, concrete mathematics of arithmetic and the abstraction that follows in algebra and higher mathematics. Proportional reasoning has an important practical function: it is a method for solving problems with proportional relationships between quantities in many and varied domains of knowledge. Proportion is used in mathematics (geometry, trigonometry, statistics, probability, etc.), physics (mechanics, electricity, etc.), chemistry (concentration calculations, balancing chemical equations, etc.), economics, and more. Fischbein (1994) refers to three basic components of a productive mathematical reasoning as a human activity: the intuitive, the algorithmic, and the formal. 1. Intuitive component. This includes intuitive cognition, intuitive understanding, and intuitive solution. These reflect the ideas and confidence regarding mathematical entities, and the mental images that we use to represent mathematical ideas. Regarding proportion, it also includes the ability to recognize a proportional relationship, either direct or indirect, between the variables.
49
CHAPTER 5
2. Algorithmic component. This includes the procedures, properties, and methods that are used for the calculations. Regarding proportion, it includes the ability to use algorithms and mathematical techniques to find a quantitative mathematical solution for a proportional problem. 3. Formal component. This aspect includes knowing the axioms, basic principles, definitions, propositions, and proofs connected to the relevant concept. Regarding proportion, this knowledge includes the ability to express the multiplicative relationship of the proportion with mathematical models. This ability is expressed by “quantifying” the first relationship of the ratio and comparing it to the second ratio, and then, according to the type of proportion exhibited in the situation (direct or indirect), correctly representing the four proportional variables in the “proportion formula.”
Acquiring and being able to use and combine the knowledge of these three components leads to conceptualization of the concepts of ratio and proportion and allows the user to correctly solve various types of problems: quantitative, with given variables, and quantitative, requiring qualitative comparison. Conversely, Fischbein (1994) claims that the inability to combine intuitive and formal knowledge may result in, among other things, invalid perceptions of the problems to be solved, cognitive conflicts, and incorrect use of algorithms. It is important to note that the integration of the three above components endow a certain mental flexibility and a wider understanding of the structure of mathematical understanding. Thus, it is important that pre-service teachers know how to support accepted calculation procedures, both formally and intuitively (Tirosh & Tsamir, 2004). THE DEVELOPMENT OF PROPORTIONAL REASONING
Lamon (2007) shares the view of many scholars by stating that proportional reasoning is a long-term developmental process in which the understanding at one level forms a foundation for higher levels of understanding (p.637). In an another previous research report, Lamon (1994) claimed that the domain represents a critical juncture at which many types of mathematical knowledge are called into play and a point beyond which a student's understanding in the mathematical sciences will be greatly hampered if the conceptual coordination of all the contributing domains is not attained (p.90). Inhelder and Piaget were the first researchers to show that the proportional scheme develops in three stages: The first is the intuitive stage (ages 3–7), when reasoning is intuitive, and there is no presence, yet, of the ability to correlate between two variables. Next is the concrete stage (ages 8–12), when there is an ability to connect two variables that are closely attached to a directly experienced 50
PSYCHOLOGICAL-DIDACTICAL VIEW
concrete situation, but without any understanding of the rules and properties, nor any ability to generalize any formal mathematical principles. If such a connection between two variables leads to a multiplicative relationship (rather than an additive one), then an understanding of the proportional relationship between the two variables has been deduced, indicating an existence of a potential proportional scheme, which will allow the solution of simple proportional problems. The third stage is the formal stage (ages 12–15), when the laws of proportional relationships are understood and an actual, developed proportional scheme exists that can be used as an efficient mental tool for solving proportional problems. These findings led researchers to conclude that the proportional scheme, like other operational schemes, matures naturally at adolescence, when formal thinking processes develop, and then is used as a strategy for solving problems and deriving general, abstract conclusions. This theory points to proportional reasoning as a main indicator of operational development during the stages of formal development. This approach to cognitive development claims that, having matured naturally by the formal stage, the proportional scheme will be chosen spontaneously when problems having a proportional relationship are encountered, leading to a rational, logical, intelligent plan of action. Furthermore, before this formal stage, such action is impossible. Moreover, many studies have shown that young pupils, while they are in various stages of learning in other areas of knowledge, will have difficulty understanding ratio-and-proportion principles and finding a correct solution to such problems (Hart, 1981; Tourniaire & Pulos, 1985; and others). With adults, the results are similar. For example, studies have shown that many pre-service teachers have difficulty solving a variety of verbal problems, including those of ratio and proportion (Tirosh & Graeber, 1990; Lawton, 1993; Ben-Chaim, Keret, & Ilany, 2007; Ben-Chaim, Ilany, & Keret, 2008); and that many mathematics teachers have the same difficulties as the pre-service teachers (Fisher, 1988). Similarly, there is proof that a great number of individuals never master proportional thinking (Hoffer, 1988). Studies examining the developmental process of the proportional scheme based on Inhelder and Piaget’s theory support the three stages of development but are divided on the developmental approach presented. The main criticism focuses on the problems that were assigned in the study, and their dependence on knowledge of physics. Additionally, the critics claimed that the researchers paid little attention to the judgment strategy and verbal explanations, leading them to conclusions that were too general and that failed to clearly present the developmental process (Keret, 1999). Already in the seventies it was suggested that development was continuous and gradual, yet dependent on learning the proportional scheme specifically when children were at the concrete stage (Fischbein, Manzat, & Barbat, 1975). These findings were eventually accepted in the eighties, when studies by Noelting (Noelting, 1980a,b) and others used problems that did not require knowledge in physics, and when Fisher (Fisher, 1988) studied in-service mathematics teachers in elementary and middle schools. In the nineties, researchers began to study the 51
CHAPTER 5
thought patterns of young children (Lamon, 1993) and to search for patterns that develop before formal strategies are learned. Results of the studies show that a learning process that allows for the development of such formal patterns aids in the development of proportional reasoning (Harel & Confrey, 1994; Thompson & Thompson, 1994; Ben-Chaim et al., 1998). The approach to development described in the above studies extends Inhelder and Piaget’s theory that proportional reasoning develops gradually and does not suddenly manifest at adolescence. As pupils mature, they learn new skills in school that enable solving increasingly challenging problems. This learning is contingent on appropriate practice that stimulates the development of this potential proportional scheme at maturity. Moreover, various studies found that some students at the concrete stage have a latent potential proportional scheme, and that, through a learning process including appropriate explanations, practice, and exercises, can be developed into an effective cognitive tool to be used in the solution strategy. It is important to emphasize that at this stage the students are in an elementary or middle school framework and they are apt to encounter many difficulties in understanding the learned material. Thus, the role of the teacher in this process is very important. Nevertheless, research has shown that not only do junior high school students have difficulty acquiring proportional reasoning skills (Post, Behr, & Lesh, 1988; BenChaim et al., 1998), many pre-and in-service elementary mathematics teachers also lack the content-pedagogical knowledge to teach it (Sowder et al., 1998; Keret, 1999). Another important didactic conclusion arising from these studies pertains to the explanations given to the students. Researchers believe that understanding informal methods for solving ratio-and-proportion problems will strengthen the intuitive foundation of the proportional scheme and will encourage students to solve problems using informal strategies before formal instruction is given (Ben-Chaim et al., 1998; Adjiage & Pluvinage, 2007). In addition, one must take into account the “realistic knowledge” that student acquire out of the classroom, as findings indicate that this knowledge has vast impact on the development of proportional reasoning (Greer, 1993; Verschaffel, De Corte, & Lasure, 1994; Nunes, Schliemann, & Carraher, 1993). According to Freudenthal (1978, 1983), proportional problems can be divided into three general categories: 1. Comparing two parts of a single whole. In this equation a ratio is obtained for two quantities that usually have the same unit, as in the “ratio of girls to boys in a class is 15 to 10,” or a “segment divided in the golden ratio.” A ratio of this type is usually represented by a fraction. 2. Comparing magnitudes of different quantities (and different units) with an interesting connection. Often, a new dimensional unit is created from such a ratio. Examples of this are distance over time (this ratio presents “speed,” and the new unit is “km/hr”), the price per number of items (“unit price”), or number of individuals in a given area (“population density”).
52
PSYCHOLOGICAL-DIDACTICAL VIEW
3. Comparing magnitudes of two quantities that are conceptually related, but are not naturally considered as parts of a common whole, as in “the ratio of sides of two triangles is 2 to 1.” Such comparisons are often referred to as scaling or calibration and include problems of stretching or shrinking in similarity transformations. The literature also reports three types of problems for evaluating proportional reasoning (Cramer, Post, & Currier, 1993): 1. Missing value problems, where three pieces of information are given and the task is to find the fourth or missing piece of information. 2. Numerical comparison problems, where rates/ratios are given and they are to be compared to find if they are equal, greater, or smaller. 3. Estimation problems which require comparisons not dependent on specific numerical values. For example, if today Dana uses less juice concentrate and more water in her lemonade, will the lemonade be stronger, weaker, or the same as yesterday, or, is there not enough information to decide (Ben-Chaim et al., 1998). STRATEGIES FOR SOLVING RATIO-AND-PROPORTION PROBLEMS—A BRIEF REVIEW OF THE LITERATURE
Common to all the studies investigating problem-solving strategies used for ratioand-proportion problems was the vast array of strategies demonstrated by the students. Investigators studied a wide range of students: young and adolescent pupils in elementary and middle schools (Hart, 1981; Lamon, 1993, 1994, 2007; Ben-Chaim et al., 1998; Empson & Turner, 2006; Adjiage & Pluvinage, 2007; Panoutsos, Karantzis, & Markopoulos, 2009; Avcu & Avcu, 2010); children and adults that did not have formal schooling and that made their living in the markets of Brazil (Nunes, Schliemann, & Carraher, 1993); pre-service teachers (Lawton, 1993; Keret, 1999; Ben-Chaim, Keret, & Ilany, 2007); and in-service teachers (Fisher, 1988; Berk et al., 2009). Strategies were found that ranged widely in their quality and sophistication. No strategy was found that could be called more “natural” for solving ratio-and-proportion problems (Karplus, Pulos, & Stage, 1983a,b). In addition it was found that the choice of a certain strategy could lead to a correct or wrong solution. Studies show (Tourniaire & Pulos, 1985) that it is possible to predict when an incorrect answer will be obtained, and when conditions will lead to a correct solution. An incorrect answer to ratio-and-proportion problems will usually result either when an additive strategy is chosen (e.g. calculating the difference or sum of two parts of the ratio, and an attempt to divide the whole by the difference or the sum); or when a multiplicative strategy, which could be used for solving the problem, is used incorrectly (e.g. using a direct proportional formula in problems of inverse proportion). Incorrect use may be due to lack of proportional reasoning or from flawed procedural skills. 53
CHAPTER 5
Correct answers to ratio-and-proportion problems will usually be obtained when appropriate multiplicative strategies are used, and used correctly. Correct use indicates that there is an intuitive awareness of the type of ratio, that the variables are successfully positioned in the chosen model, and that the procedure is successfully followed to arrive at the quantitative or qualitative solution required. The multiplicative strategies used might be of the following forms: 1. Pre-formal strategies (common with younger children), such as intuition based on and developed through life experience, using “building-up” strategies (developing the strategy according to the situation), using the ratio as a unit (unitizing); finding the unit; division by ratio (relative distribution/division), corresponding tables, missing value problems, and more (see pages 38–39). 2. Formal strategies using the proportional formula. This strategy is common to adolescents and adults with formal abstract thinking. The proportional formula a c = b d allows the solution of both direct and indirect ratio-and-proportion problems (see pages 38–39). 3. Other multiplicative strategies that can be expressed as algebraic formulae based on linear relationships, such as the formula for distance, s = v × t (Fisher, 1988). 4. Other multiplicative computational strategies derived outside the classroom. Such strategies are content-dependent and of a non-formal character (Nunes, Schliemann, & Carraher, 1993). Often, these have been successfully invented by students and are based on multiplicative reasoning (Lamon, 1994). Strategy Quality In addition to investigating which strategy was used, researchers also examined its quality (efficiency), and tried to determine whether the quality of the strategy was an indication of the developmental level of proportional reasoning. Inhelder and Piaget were the first that correlated the quality of the chosen strategy to developmental levels (Inhelder & Piaget, 1958). They claimed that the quality of the chosen strategy is expressed in its level of sophistication. As the student gets older and develops higher levels of proportional reasoning, the level of sophistication of the chosen strategy rises, beginning with intuitive reasoning, continuing through pre-formal strategies with qualitative solutions, and culminating in formal strategies with quantitative-mathematical solutions. With the appearance of proportional reasoning, the earlier strategies characterizing lower quality skills will be abandoned and the student will chose the formal proportional formula to find a quantitative mathematical or qualitative solution for the problem.
54
PSYCHOLOGICAL-DIDACTICAL VIEW
Fischbein (1987, 1994) emphasizes the importance of a qualitative intuitive perspective in the problem-solving process. The intuitive perspective, that which expresses a person’s ability to identify a direct or indirect ratio between the variables of a problem, combined with the formal, procedural techniques that make up the formal elements of the solution, will indicate the quality of the proportional reasoning of the chosen strategy. Additionally, it is important to point out that there are many variables which influence the type and quality of the strategy chosen and the ability to use it properly: previous knowledge, actual experience, personal preference, realm of knowledge, verbal content, revealed proportional connection, and difficulty of the problem, to mention a few (Keret, 1999; Harel, Behr, Post, & Lesh, 1994; Kaput & West, 1994; Steinthorsdottir, 2006; Panoutsos, Karantzis, & Markopoulos, 2009). The quality of the strategies can be analyzed as follows. Pre-formal strategies. Using a pre-formal strategy for solving ratio-and-proportion problems is typical for children in elementary school. At a very young age, this strategy is expressed as a logical-sensible intuition (Lamon, 1993). The use of common sense in using proportional reasoning is low. They do not recognize a multiplicative relationship, but use existing intuitive thinking that usually deals directly with only one value in the problem. An intuitive solution can be obtained for actual problems though, by direct experimental activity. At the beginning of the concrete stage, when the child still thinks in the additive manner, strategies are based on the differences between the sizes of the values in the problem, instead of on the ratio between them. While common sense might lead to a form of proportional reasoning, this reasoning is qualitative only, without any abstraction or quantitative thinking. This level of the proportional scheme represents an incomplete understanding of the concept of ratio (Thompson, 1994); the student is unable to understand the quantitative relationship between the values as a multiplicative connection, and uses the proportional scheme only qualitatively. Results of studies (Resnick, 1983; Kaput & West, 1994; Lamon, 1993, 1994, 2007) show that at this stage children are developing mental patterns built on the concept of ratio, such as finding the unit that can serve as a basis to developing quantitative proportional reasoning. Even before formal study, children will exhibit conceptual understanding and procedural ability much greater than their symbolic capacity. In fact, they do not use symbols, but their previous knowledge and accompanying logic assist them in forming creative, yet informal, solutions to ratio and proportion problems. As a result of these finding, the suggestion was made for teachers in elementary school to expose students to the nature of ratio in multiplicative situations, using a wide variety of examples. Activities should be developed to teach strategies and to develop proportional reasoning, and to encourage students to use pre-formal strategies, such as using the ratio as a unit, to develop ratio thinking. Such a framework, it has been claimed, would be beneficial in nurturing multiplicative thinking and proportional reasoning skills.
55
CHAPTER 5
Formal strategies: the proportional formula. Use of the formal proportional formula a c = , (a, b, c, d ≠ 0) b d is typical of adolescents and adults. Proper use of this formula to solve problems of direct and indirect ratio, points to the educated application of the proportional scheme, that is to say, the existence of proportional reasoning. The ability to think in terms of numeric transformation is an advanced stage in the quantitative development of the child; when a mathematical value is conceived as a multiplicative-numeric relationship that is measurable, the child is ready to use quantitative, multiplicative strategies (Harel, Behr, Lesh, & Post, 1994). This process takes place at the formal stage and is expressed by solving problems using quantitative proportional strategy, that is, students will use algebraic symbols to represent the proportion, will solve the problem using the proportional formula, and will exhibit understanding of functional and scalar ratios (Lamon, 1993). Fisher (1988) sums up recommendations to teachers by concluding that teachers must be familiar with the wide range of proportional-scheme strategies available, be aware of proportional problems that present themselves in the different domains of study, and be able to solve a particular problem using more than one strategy. They must begin the teaching-learning process using pre-formal strategies that help build a better conceptual understanding in the student and that support the problem-solving process up to the point that the student understands the general principle and can successfully apply the proportional formula. More details on strategies for solving problems in ratio and proportion can be found in Harel and Comfrey's book (1994), in the survey by Behr, Harel, Post and Lesh (1992), in Ben-Chaim et al. (1998), in Panoutsos, Karantzis and Markopoulos (2009), in Newton (2010), and in Lobato, Ellis, Charles, and Zbiek (2010). DIFFICULTIES AND THEIR SOURCES IN THE PROCESS OF SOLVING RATIOAND-PROPORTION PROBLEMS
A survey of the literature by Tourniaire and Pulos (1985) points to many factors that influence the difficulties encountered when solving ratio-and-proportion problems. The results of their investigation point to three main categories: difficulties due to cognitive aspects, variables affecting the solution process, and variables arising from the teaching-learning process and the uniform educational system. We will deal with each one more fully. Difficulties Arising from Cognitive Aspects The main sources of difficulty in solving ratio-and-proportion problems for children, adolescents and adults alike, are cognitive. First, the proportional scheme is a second-order operational scheme, requiring an operation to be carried out after another operation has been done. Piaget 56
PSYCHOLOGICAL-DIDACTICAL VIEW
emphasizes that this difficulty is due to the fact that understanding proportion requires the ability to compare two ratios in which the variables must be coordinated into a relation. In addition, it requires the ability to recognize whether the problem involves direct or indirect proportion (Inhelder & Piaget, 1958). Second, ratio-and-proportion problems require a multiplicative pattern, which is more complicated than the additive one that children use in elementary school (Vergnaud, 1994). Additive reasoning develops at a young age, but then may present a hindrance to passing into the realm of multiplicative reasoning. By developing additive reasoning, faulty intuitive models may form (such as intuitively multiplying by way of repeated addition), leading to difficulties when solving problems in which the multiplier is not a natural number (Greer, 1987). The models of division by inclusion and division by partition may convince students that the quotient is always smaller than the dividend, the dividend is always larger than the divisor, and that the divisor is always a natural number. This leads to confusion when the data do not match the model or their expectations (Fischbein, Deri, Nello, & Marino, 1985). The effect of habitually using these intuitive, yet erroneous, models, can explain the many difficulties experienced by children, adolescents, pre-service teachers, and adults in the solution of such problems (Tirosh & Tsamir, 2004). A third difficulty stemming from a cognitive source occurs when the ratio is an intensive value (a ratio of the “rate” type or category) that forms a new dimensional unit, such as speed, power, etc. The new unit demands understanding of the rules and properties relevant to the subject in question in addition to the mathematical understanding connected to proportion. Many of these laws and physical processes can be intuitively understood by children as a result of direct experience, well before formal instruction (Lamon, 1994, 2007). The difficulty mainly arises because, in addition to their intuitive understanding of the law, they must be able to transform results obtained from actual activities into qualitative values, and then organize them into mathematical ratios and present them as a proportion in the mathematical scheme. The fourth source of difficulty is the requirement to be able to intuitively understand what type of ratio-and-proportion problem is being posed. This difficulty usually arises in the case of indirect proportion, which is more complicated for child and adult alike. Recognizing that a problem has a proportional relationship, but not realizing that it is a case of indirect proportion, will undoubtedly lead the student to an erroneous solution (Fisher, 1988). Variables That Influence the Performance Process Once a student has identified the problem before him as directly or indirectly proportional and has surmounted any cognitive difficulties, he must solve the problem in practice. During the performance process, the student may run into additional variables that may add to the difficulty of finding the correct solution to the problem.
57
CHAPTER 5
Tourniaire and Pulos (1985) presented two types of variables that influence the student and lead to difficulties in the solution process. The first stems from the nature of the assignment. This involves the verbal content of the problem, including the nature of the question and the realm of knowledge described by it. It also involves the nature and structure of the numbers presented in the problem, such as their dimension (very large or small), or type (problems with rational or discrete values are easier to solve than those with continuous values). These two variables essentially determine the level of difficulty of the problem. For additional reference to these issues, see Lamon (1993) and Steinthorsdottir, (2006). The second type of variable is that of the personal characteristics of the student: age, stage of development in his proportional scheme, gender, IQ, etc. Researchers are aware of the individual differences between students, however they have not suggested any way of dealing with them. Character differences can influence the execution of the assignment; and the discovery of a teaching method that would be suitable for children in accordance with their character, would contribute much to improve instruction and the students’ achievement. Variables Arising From the Teaching-Learning Process and the Uniform Educational System Two additional sources can influence the difficulty a student might have in the problem solving process, the first having to do with the curriculum, and the second to the teaching-learning process in the class. In most countries, the curriculum usually requires instruction in ratio and scale in middle or junior high school, but in any one class, pupils may be in different stages of intellectual development, especially regarding the proportional scheme. This situation can introduce difficulties for pupils still in the concrete development stage. Teachers must be aware of the importance of exposing children to multiplicative-relationship proportion problems in many domains of study. Appropriate exercises and practice, using differential instruction, can help students overcome the difficulties and foster the development of their proportional schemes. The second source is from the teaching-learning process. The content of the problems is frequently distant from children’s actual experience, and is isolated from actual knowledge outside the classroom (Verschaffel, De Corte, & Lasure, 1994). Furthermore, traditional classroom instruction tends to use problem-solving as a tool for practicing technique, and not for developing mathematical thinking, nor appreciating the connection between mathematics and the real world. As a result, students mainly get procedural experience, without developing a significant understanding of the concepts of ratio and proportion, leading to many difficulties in knowing how to solve these problems. An effective solution would be the addition of a wide range of more authentic activities, combined with a rich learning environment, while discussing different aspects of each problem.
58
PSYCHOLOGICAL-DIDACTICAL VIEW
Already in studies by Fischbein, Manzat and Barbat (1975) it was found that appropriate exercises could be especially helpful in overcoming cognitive problems. In their study, students were encouraged to come up with their own methods for solving a problem, encouraging them to use the proportional scheme, and by doing so, to go from the theory to practice – from a latent, yet potential, proportional scheme to one that can actually be used as an efficient cognitive tool. The exercises used were concrete problems within the realm of experience of the children. The importance of combining realistic experience acquired outside the classroom with the ratio-and-proportion problems, and the positive effect that this had on the development of the proportional scheme, has been noted in other studies as well (Greer, 1993; Verschaffel, De Corte, & Lasure, 1994). One of the newer projects in curriculum planning is the American Connected Mathematics Project (CMP) (Lappan et al., 2002; Lappen, Phillips, & Fey, 2007; Lappen & Phillips, 2009), which developed learning materials for grades six and seven in accordance with this postulation. A lesson plan was built with the goal to develop the students’ knowledge and understanding in mathematics. The project was formed around interesting and challenging assignments that describe actual situations. The children solved the exercises, discovering patterns and relationships between the elements of the problem. They estimated, examined, verbalized, and generalized the patterns and relationships. At no point did the learning material offer a standard algorithm of addition, subtraction, multiplication, or division of fractions or decimals. A similar plan was made for problems in percentages and for problems in proportion. The new CMP program presented a different learning environment from the traditional rote learning, where the learning material presented the problem, the teacher demonstrated the solution, and the students then practiced and did exercises on their own following the pattern that the teacher gave (Ben-Chaim et al., 1998). The results of this study by Ben-Chaim et al. point out that grade-seven students who learned according the CMP program, which encourages the development of concept knowledge and proportional knowledge on their own, were better able to develop a repertoire of reasoning tools that would help them form efficient solutions and explanations. The results were arrived at by analysis of the solution strategies that grade-seven students used for rate problems. The questions that were chosen were from the world of the student, and were open, non-standard questions that eliciting thinking. Using such questions, the answers could be analyzed to expose many of the mathematical attributes of the student, such as originality and self-evaluation. Such activities are called authentic activities. They are activities familiar from real life that have meaning for the students and that require them to use judgment and knowledge to solve the problems in a tangible way. Authentic activities are complex and not unambiguous, have several stages, and do not necessarily have one specific, correct answer. The assignment demands judgment in deciding on the appropriate knowledge required and its application, skill in deciding on the order of priority, and organization of the stages needed to understand and solve it. The assignment can be carried out by a few students in a real situation, without time, tool and resource limitations (Ben-Chaim, Ilany, & Keret, 2008). Taking part in 59
CHAPTER 5
and experiencing authentic activities keeps the student from having to cope with the toil often involved in learning, since such assignments have value beyond merely demonstrating ability in school. Using a non-routine problem can be an effective way to encourage students to draw on prior knowledge, work together, and reach important conclusions about the mathematics they are learning. Stemn, (2008) reports the results of a study of 7th grade students that were engaged with authentic and non-routine task involving liquid measurements. The results indicate that the use of those tasks “heightened their interest, curiosity and enthusiasm, thereby contributing to their excitement about the mathematics they were learning” (p.383). Authentic challenges cultivate cognitive thinking skills at higher levels and nourish the ability to solve problems, which is invaluable for the individual and society. There is a greater chance that skills obtained in school from authentic assignments will be retained upon leaving the school. While working on such assignments, varied, original solutions may be derived, and thus the method facilitates evaluation of the mathematical abilities of students, emphasizing the solution process and not just the final answer arrived at. When evaluating the ability of the student, there is great importance in following the solution and thought processes that guide the student. These types of activities form the guideline to the testing and preparation of the authentic investigative activities in this book.
60
CHAPTER 6
RESEARCH AND NEW APPROACHES IN PRE- AND IN-SERVICE MATHEMATICS TEACHER EDUCATION
BACKGROUND
Recent studies in many countries worldwide have pointed out the difficulties that pre-service teachers aspiring to teach mathematics in elementary school have. These difficulties are expressed especially as an inability to understand mathematical content and concepts, and feelings of incompetence in dealing with and teaching the subject (Lamon, 2007; Empson & Junk, 2004), combined, among other things, with a certain negative attitude to the mathematics-teaching profession as a whole (Tirosh & Graeber, 1990). Quoting the American Mathematical Society (2001), Walker (2007) indicates that in order to spur student learning of mathematics rather than just performance, teachers are expected to respond to student misconceptions, help students develop conceptual understanding, and provide multiple curricula and media to it. Walker (2007) then continues to claim that: This can be difficult when teachers themselves may hold misconceptions, have limited rather than deep conceptual understanding of mathematical topics, and may not understand how working with different media and manipulative devices can contribute to student thinking and learning in mathematics (p.114). Ma (1999) relates specifically to elementary teachers by saying that “we must recognize that many current elementary teachers' mathematical understanding is far from ideal.” The American Mathematical Society (2001, p.55) agrees that many elementary mathematics teachers “were not adequately prepared by the mathematics instruction they received.” Studies that were carried out in various colleges in Israel to test the mathematical knowledge of pre-service teachers (Fischbein, Jehiam, & Cohen, 1994; Keret, 1999; Ben-Chaim, Ilany, & Keret, 2002) pointed out many problems stemming from the mathematics education that these pre-service teachers had received. Evidence showed that their knowledge of and experience in mathematics were not rich enough and this was often coupled with negative experiences from their student days. These studies clearly indicate that the teachers’ knowledge in specific areas of mathematics and their feelings of competency with the subjects to 61
CHAPTER 6
be taught affects their teaching performance, their choice of topics to teach, and their ability to cope with students’ questions (Even & Tirosh, 1995). Other sources emphasize the influence that confidence and conceptual understanding of “what is mathematics?” and “what does doing mathematics mean?” have on teachers’ performance in class (Fischbein, 1982; Ford, 1994), and the connection between the teachers’ confidence and attitude and the confidence elicited in their students (Zambo & Zambo, 2008). These researchers emphasize that the confidence and attitude of teachers towards mathematics is nurtured in a great way by the quality of instruction to which they were exposed. Based on these findings, it seems imperative to restructure the mathematicsteacher training, with a program that will effect improvement to all aspects of the teachers’ education (Walker, 2007). The Israeli Harari Committee (TOMORROW 98, 1994) also recommended changing the method and broadening the qualification process by which mathematics teachers are trained. In their report, the committee recommended that: On the elementary school level, mathematics should be taught by speciallytrained mathematics teachers (Recommendation A/1.A, p. 19), And that The education system adopt practical measures in teacher training, in-service training workshops for teachers and curricula (Recommendation A/1.B, p. 19). In their view: Teachers should receive a deeper professional knowledge of mathematics, in addition to the instructional and methodological aspects (p. 20). CONCEPTUAL REVOLUTION
The topic of appropriate teacher training received extra validity following the conceptual revolution that took place over the past years (NCTM, 1989, 2000; Loucks-Horsley et al., 2010) that led to a change from a more traditional learning environment to a constructivist, active, and social learning environment. In other words, the formal class situation in which the teacher passes knowledge down to the students, has been replaced by a more constructive, active, and interactive learning environment (Cobb, 1997; Walker, 2007). The teacher’s role has become that of guide, mentor, coach, and instigator of activities, while the students are given the responsibility for developing new insights based on previous existing knowledge. Because this conceptual revolution also applies to the way that teacher trainers perceive their role, study programs should be developed that nourish the existing knowledge of the pre-service teachers, and provide active experience in a professional learning environment. Teaching in the spirit of the era described above means qualifying teachers who are able to produce students who can develop a deeper understanding of mathematical ideas; comprehend connections between different areas and subjects; 62
RESEARCH AND NEW APPROACHES
and discover, hypothesize, experiment, and build mathematical connections within the mathematical area being studied (Lester et al., 1994). Teachers are required to know and be able to form relationships among a variety of commonly used student-generated strategies for multi-digit problems in addition to the usual standard algorithms (Empson & Junk, 2004, p. 122). Teachers also need to be prepared to make sense of both common and novel strategies during lessons, as well as before and after lessons (Even & Tirosh, 2002). The National Research Council (1989) also emphasizes that: …teachers themselves need experience in doing mathematics—in exploring, guessing, testing, estimating, arguing, and proving—in order to develop confidence that they can respond constructively to unexpected conjectures that emerge as students follow their own paths in approaching mathematical problems (p. 65). To this end, teachers must be trained so that they will know how to ask the right questions, promote procedures based on meta-cognitive thought processes and inquiries, and spur a mathematical dialogue (NCTM, 1989, 1991) that encourages multi-dimensional thinking and creative ways of arriving at solutions. The mathematical dialogue must be anchored within a mathematical culture that operates within social and class norms that allow proofs, justifications, explanation of errors, examples, questioning, and risk-taking without feeling threatened (Gallenstein, & Hodges, 2011; Kennedy, 2009). Another approach is expressed by Sherin (2002), who claims that: Because of the particular nature of current mathematics reform efforts, implementing this reform requires that teachers learn in the act of teaching (p. 120). In particular, Sherin notes two types of learning that are involved: where existing content knowledge is modified during instruction; and where new content knowledge is developed during instruction. A support to this approach can be found in the report of Doerr and English (2006) about middle grade teachers' learning through students' engagement with modeling tasks. REQUIREMENTS OF TEACHERS' KNOWLEDGE
Studies examining teachers’ knowledge found that the required knowledge base is wider and more varied, demanding also understanding of the study area, a grasp of organization and class management techniques, a basis in educational history and philosophy, pedagogic-didactic knowledge, curriculum awareness, insight into individual differences among students, familiarity with general management and administration techniques, and more (Shulman, 1986, 1987). It is interesting to note that research indicates a relationship between teachers' knowledge and teachers' belief in their competence. Many researchers have emphasized the effect that changes in the teachers’ knowledge have on their belief 63
CHAPTER 6
in their abilities and confidence (Empson & Junk, 2004). However, at the same time, it must not be forgotten that the beliefs and opinions of the teachers influence the curriculum and the methods with which they teach it (Elbaz, 1983; Clark, 1989). Weissglass (1994) stated that “changing mathematics teaching means changing ourselves,” that is to say, it requires a change in our position, in our world of knowledge, in our feelings of ability, and in our qualifications to teach the topic. A change in the teaching of mathematics must come from a change in the teachers themselves. Another factor is the belief “that teachers are prone to teach the way they themselves were taught” (Lester et al., 1994, p. 153). Over the past years, studies have tended to focus on investigating the cognitive aspect of pre and in-service teacher education, through belief that understanding the knowledge and thought processes of the teachers will contribute to understanding their teaching processes (Empson & Junk, 2004; Walker, 2007). Additionally, by implementing a team teaching practice (Chazan, Ben-Chaim, & Gormas, 1998), or a dialog between researchers and teachers, teaching methods can be improved by focusing on the needs of the teachers in training and on the job (Shulman, 1986; Clark & Peterson, 1986; Zaslavsky & Leikin, 2004; Jaworski, 2005; 2007; Towers, 2010; Potari et al., 2010). There is great impetus to use the research results to design teacher training methods to promote the professional advancement of pre-service teachers and to produce professional teachers who will make teaching meaningful by using a wide knowledge base to inspire and guide their students’ education, and not just “prepare recipes” for their students (Shulman, 1986; Baument et al., 2010). One of the most important components for cultivating a professional educator in the spirit of the times, as described above, is “content knowledge” in teaching.” “Content knowledge” encompasses all the information that a teacher has accumulated over the route from pre-service to experienced teacher. Awareness of how content knowledge develops is central to the knowledge base required for developing instruction methods; instructors who understand how the content knowledge changes from the teacher's initial knowledge to the teacher's teaching knowledge, can use this information to construct more meaningful and efficient teacher training programs (Shulman, 1986; 1987). Shulman (1986) divides content knowledge in teaching into three categories: subject matter content knowledge, pedagogical content knowledge, and curricular knowledge. He describes them as follows. Subject Matter Content Knowledge Subject matter content knowledge refers to “the amount and organization of knowledge per se in the mind of the teacher . . . to think properly about content knowledge requires going beyond knowledge of the facts or concepts of a domain” (Shulman, 1986, p. 9).
64
RESEARCH AND NEW APPROACHES
Pedagogical Content Knowledge Pedagogical content knowledge is, according to Shulman, “knowledge which goes beyond knowledge of subject matter per se to the dimension of subject matter knowledge for teaching … [this includes] for the most regularly taught topics in one's subject area, the most useful forms of representation of those ideas, the most powerful analogies, illustrations, examples, explanations, and demonstration—in a word, the ways of representing and formulating the subject that make it comprehensible to others. …. Pedagogical content knowledge also includes an understanding of what makes the learning of specific topics easy or difficult: the conceptions and preconceptions that students of different ages and backgrounds bring with them to the learning of those most frequently taught topics and lessons (Shulman, 1986, p. 9). The concept of pedagogical content knowledge, with its focus on representations and conceptions/misconceptions, broadened ideas about how knowledge might matter to teaching, suggesting that it is not only content knowledge, on the one hand, and pedagogical knowledge, on the other, that are important, but also a kind of amalgam of the two that is crucial to the knowledge needed for teaching (Ball, Thames, & Phelps, 2008). In Shulman's words, “Pedagogical content knowledge is the category most likely to distinguish the understanding of the content specialist from the pedagogue” (1987, p.8).
Curricular Knowledge Shulman’s third division of content knowledge is that knowledge represented by the full range of programs designed for the teaching of particular subjects and topics at a given level, the variety of instructional materials available in relation to those programs, and the set of characteristics that serve as both the indications and contraindications for the use of particular curriculum or program materials in particular circumstances (Shulman, 1986, p.10). Shulman continues by indicating that the curriculum and its associated materials are the material medica of pedagogy, the pharmacopeia from which the teacher draws those tools of teaching that present or exemplify particular content and remediate or evaluate the adequacy of student accomplishments (p. 10). In the two decades since Shulman presented his ideas, much of the research that followed focused on how teachers' orientations to content influenced the ways in which they taught that content. Specifically in reference to mathematics teaching, Ball, Thames and Phelps (2008) summarized the state of the art by analyzing the mathematical knowledge for teaching and its structure. They concluded their studies by suggesting Shulman's first two categories should be subdivided as follows: subject matter content knowledge would include common content knowledge (CCK) and specialized content knowledge (SCK); and pedagogical 65
CHAPTER 6
content knowledge would be divided into knowledge of content and students (KCS) and knowledge of content and teaching (KCT). Ball, Thames and Phelps (2008) defined their suggestions as follows: CCK is “the mathematical knowledge and skill used in settings other than teaching” (p.399); SCK is “the mathematical knowledge and skill unique to teaching …. It is mathematical knowledge not typically needed for purposes other than teaching” (p.400); KCS is “knowledge that combines knowing about students and knowing about mathematics. Teachers must anticipate what students are likely to think and what they will find confusing” (p.401); and, finally, KCT as the knowledge that “combines knowing about teaching and knowing about mathematics” (p.401). Since studies have shown that in many colleges pre-service teachers are not methodically taught about content knowledge, nor do they receive a broad mathematical and psycho-didactic perspective of the mathematics subjects taught in elementary school, their existing knowledge, while perhaps technical and schematic, is neither connected nor well-formulated to the point that pre-service teachers are not even able to solve various verbal problems (Tirosh & Graeber, 1990) including those of ratio and proportion (Keret, 1999; Ben-Chaim, Ilany, & Keret, 2002). TEACHING STRATEGIES PROMOTED IN THIS BOOK
Due to the reasons presented above, the authors of this book suggest incorporating the following into the course of studies for prospective mathematics teachers: 1. Knowledge and mathematical skills of each component of the subject to be presented in class. 2. Development of meta-cognitive skills, such as the ability to understand sources of misconceptions; and 3. Development of reasoning tools for supervision and control of these sources. Thus, the educational unit of ratio and proportion presented in this book includes Shulman's three categories of content knowledge for teaching, taking into consideration the research studies presented above, and specifically adding content knowledge needed for mathematics teaching in general and proportional reasoning in particular, as is discussed in further detail below. Subject Matter Content Knowledge in Proportional Reasoning Subject matter content knowledge includes presentation of the mathematical view of the topic based on the three components of knowledge indicated by Fischbein (1994): formal knowledge (definitions, rules and properties of proportion, common sense in using the proportional scheme, strategies for solving problems including the appropriate procedures for each type of ratio, etc.); algorithmic knowledge (the rules of algebra, solving algebraic equations, problem-solving procedures including a number of strategy procedures for solving each type of proportional problem); and intuitive knowledge (the ability to recognize proportional relationships as direct or indirect proportion, and the ability to connect this intuitive knowledge to an 66
RESEARCH AND NEW APPROACHES
appropriate procedure for each type of ratio). All three components have been broadly described in previous chapters of this part of the book. It is important to emphasize that the mathematical subject matter content knowledge obtained in the concepts of ratio and proportion, by teachers as well as by students, must be connected to the ability to use educated judgment in the proportional scheme; this ability is crucial to the development of proportional reasoning. Pedagogical Content Knowledge in Proportional Reasoning As far as proportional reasoning is concerned, pedagogical content knowledge includes, among other things, the results of research vis-à-vis the stages of development of proportional reasoning in children, the grasp that pupils have of the concepts of ratio and proportion, misconceptions and their sources (as detailed above in the previous chapters), and also conceptual teaching methods that aid the teacher to develop the pupils’ concepts and proportional reasoning. This knowledge also includes that necessary for the teacher to be able to make the mathematical content of lessons understandable to the students (Leinhardt, Weidman & Hammons, 1987). In addition, it is important to know how the presentation, wording and accompanying pedagogic explanations of the topics will help make them acceptable to the students. (This is equivalent to KCS and KCT as specified by Ball, Thames and Phelps (2008), see above.) Presentation methods include analogies, conflicts, imagery, examples, and demonstrations, to aid students in develop thinking, and to present alternative views of the various circumstances (Shulman, 1986, 1987). Teachers should develop the ability to identify problems and sources of common errors and misconceptions that students have, and to be aware of the various ways in which mathematical principles and procedures are comprehended by the students. (This issue has been discussed in Chapter 5, above, Proportional Reasoning—A Psychological-didactical View.) Since teaching methods are a central point in the pedagogical-mathematical content knowledge, it is appropriate to refer to a number of educational methodologies that have been successfully used to develop the proportional reasoning in students. In recent years, teaching methods have been developed that emphasized the topic of proportional reasoning. In the CMP-Connected Mathematics Project (Lappen et al., 2002), the authors presented the topic to students using authentic research projects that were relevant to their daily lives, and which demanded explanations using proportional reasoning (Ben-Chaim et al., 1998; Lappen et al., 2002). In a similar program, Stemn (2008) investigated a class of seventh-grade students, encouraging them to make connections between existing and new ideas, and reflecting and communicating their thinking. The students were constantly asked to explain, discuss, and justify their solutions both in writing and verbally. The results indicated that such a program contributed to the students’ emerging understanding of proportions (Stemn, 2008, p. 383). Another recently published approach is that of the “Essential Understanding Series” by NCTM (National Council of Teachers of Mathematics). One of the 67
CHAPTER 6
books in the series is devoted to teaching ratio, proportion, and proportional reasoning (Lobato et al., 2010), and indicates ten principles that can assist in developing students’ proportional reasoning (pp. 15-46). According to this approach, teachers must be made aware of several foundational ideas related to fractions and multiplication that are critical to student's development of proportional reasoning. They propose four stages of transitions that students must make to become proficient in proportional reasoning: Stage 1: A transition from focusing on only one quantity to realizing that two quantities are important. Stage 2: A transition from making additive comparisons to forming a ratio between two quantities. Stage 3: A transition from using only composed-unit strategies to making and using multiplicative comparisons as well. Stage 4: A transition from developing a few "easy" equivalent ratios to creating an infinite set of equivalent ratios (Lobato et al., 2010, pp. 49-75). Another instructional method (Howe, Nunes, & Bryant, 2010b), focused on only one concept: that of rate. They designed a four-lesson teaching program with the aim to foster mastery in the context of intensive quantities. Two versions of the teaching program were developed, one using ratio representation and the other using fractions. The results revealed that both versions promoted mastery of fractions, while the ratio version also supported proportional reasoning. Howe, Nunes, & Bryant (2010b) concluded with the indication “that the ratio version provides useful foundations for teaching, even with children who… have no previous experience of ratios themselves” (p. 391). A third method emphasizes the use of computer-assisted learning environment (Adjiage & Pluvinage, 2007). In a two-year experiment related to the teaching and learning of rational numbers and proportionality in 6th and 7th grades, two classes were followed and observed. Part of the teaching material was common to both classes, mainly the objectives and the corpus of ratio problems in a physical context. In one class (“partial-experiment”), the learning environment was exclusively a paper-and-pencil one and the teacher followed his usual method in designing and conducting teaching sequences. In the other class (“fullexperiment”), the teaching was based on a framework that emerged from the researchers' analysis of the complexity of ratio problems, involving precise guidelines and a specific computer environment. Using a pre-test and a post-test, the researchers observed clear progress in both classes compared to a sample of “standard” pupils. The comparative pupil-oriented study, however, indicated more complete improvement in the “full-experiment” class, i.e., a better acquisition of fractions and their use for solving usual proportionality problems. The average pupil’s progress was greater in the “full experiment”, with the pupils who were initially high- or low-level attainers benefiting the most from the “full-experiment” (Adjiage & Pluvinage, 2007). As indicated above we adopted the Connected Mathematics Project (CMP) method of teaching, developed by Lappan et al. (2002).
68
RESEARCH AND NEW APPROACHES
Curricular Knowledge of Proportional Reasoning Curricular knowledge includes the knowledge that a teacher requires in order to be able to translate the mathematical knowledge into curricular classroom events (Shulman, 1986). The teacher must be aware of the relevant curricular materials available and be able to make a sound choice between them using sound pedagogic-didactic judgment. In the case of proportional reasoning, curricular knowledge includes those topics that are related to the concepts of ratio and proportion in the mathematics and science programs of study. A major intent of this book is to develop proportional reasoning as a part of developing formal mathematical thinking using existing educational materials. Combining these three types of content knowledge within the teacher training course will ultimately help produce professional teachers and will greatly improve instruction in the elementary and middle schools. Studies have shown significant differences between the instruction of novice and experienced teachers, not only in their actual performance, but also in their ways of thinking (Berliner, 1986). The results of the studies detailed above, led to the development of the model for teaching ratio and proportion to pre-service (and in-service) teachers presented in this book. The experimental model was implemented in five studies in two teaching colleges in Israel, over a timeframe of five years (2000–2005). In all five studies, the model was used as a basis for a course for teaching ratio and proportion within the framework of specialization for pre-service mathematics teachers. The studies examined the changes that occurred in the mathematical and pedagogic-didactic knowledge of the pre-service teachers that took part in the course, and also the change in their attitude towards the importance of the topic, the difficulties encountered in its instruction, and their feelings of ability to teach the topic in elementary and middle schools. The results of our five studies showed that pre-service teachers who had been taught ratio and proportion using authentic investigative activities and combining theoretical and practical knowledge were able to successfully solve more of the questions in the knowledge questionnaire, were capable of finding more ways to solve the problems given, and could give significantly better explanations as to the method of finding the solutions. In addition, there was a significant improvement in their attitude towards the subject in all its components and aspects (Ben-Chaim, Ilany & Keret, 2002; Keret, Ben-Chaim, & Ilany, 2003; Ilany, Keret & BenChaim, 2004). Data regarding the results can be found in Part Four of this book. We agree with Lester et al. (1994) that “significant changes in the way mathematics is taught in our schools will come about only if significant changes occur in the way mathematics taught in college” (p. 153). A detailed description of how an activity was conducted with pre-service teachers during a course of studies at teachers’ college may be found at the end of Activity 4.2 (Chapter 11), in the section entitled “Conducting the Beth-Shean Temple Activity with Pre-service Student Teachers.”
69
CHAPTER 6
OTHER TEACHING MODELS
Other researchers have also presented teaching models similar to this one that emphasize that the curriculum for teaching pre-service teachers ratio and proportion should include many different approaches and perspectives. For example, Berk et al. (2009) suggest cultivating the ability to use a wide range of problem solving strategies. They also examined the influence that flexibility in problem solving had in proportional reasoning. Flexibility in the use of mathematics procedures, including those of ratio and proportion, consists of the ability to employ multiple solution methods across a set of problems, solve the same problem using multiple methods, and choose strategically from among methods so as to reduce computational demands. Peled and Hershkovitz (2004) also emphasize the need for making teachers aware of the nature of alternative, not always formal, solutions. They suggest including a process in the course in which the instructors themselves become involved in the pre-service teachers’ practical work, checking together the strategies used by the pupils to solve proportional problems. Another approach worth mentioning is that of Jaworski (2006) who suggested a process that combines the theoretical with the practical. Jaworski's suggestions have been incorporated into the model presented in this book. SUMMARY
To recap, the studies reported above delineated three central components which must be taken into consideration during the training of mathematics teachers: the cognitive component (including mathematical and pedagogic-didactic content knowledge), the emotional component (including attitude, beliefs, and feeling that may encourage or discourage their readiness to teach mathematics), and the behavioral component (expressed through the teacher’s willingness to contend with building an educational unit and lesson plan). For those who deal with teacher education, the importance lies in immersing the teacher-in-training into an environment that allows a positive, graduated and guided experimental experience where they may apply their knowledge. The ideal situation, of course, would be a coordinated, relaxed learning environment where knowledge is used in a flexible manner using critical, creative thinking, and where there is openness and motivation to change, develop initiative, expand and apply that knowledge. Unfortunately, studies, a portion of which were presented herein, have proven that this is not always the situation in the field of teacher training; again and again the cry is heard from those who deal with teacher training that changes are needed. Effective change means changes in all three components—cognitive (expanding and deepening the mathematical content knowledge), emotional (a change in attitude towards the profession) and behavioral (more opportunity for applicable experimentation of the student in a cooperative environment)—all the while using the language of terms from the realm of mathematics and the realm of didactics.
70
PART THREE
AUTHENTIC INVESTIGATIVE ACTIVITIES, INCLUDING DIDACTIC COMMENTS AND EXPLANATIONS
CHAPTER 7
AUTHENTIC INVESTIGATIVE ACTIVITIES— INTRODUCTION
THE BASICS
Incorporating the Activities This section presents a wide range of authentic ratio-and-proportion investigative activities that represent actual situations relevant to the real world of students and teachers alike. They span various levels of difficulty appropriate for pre- and inservice elementary and middle school teachers, and can be easily adapted for authentic investigative activities appropriate for pupils in elementary and middle school. The activities are divided into five main groups1— a) introductory, b) rate, c) ratio, d) scaling, and e) inverse-proportion, each group having a number of authentic investigative activities to illustrate and teach the concept. Each activity comprises a worksheet for use with the students, followed by didactic comments and explanations that sometimes are very detailed, and sometimes less so. These explanations discuss mathematical and psychologicaldidactical aspects, including subject matter; purpose of activity; prerequisite concepts; concepts taught in the exercise; connectivity to other mathematical areas; suggestions for solving questions, bearing in mind the difficulty level; strategies that can be employed for solving the problem; difficulties and errors typically revealed in the process of solving the task; suggestions for teaching the activity based on the teaching model described in the introduction to this book, including references to resources in the annotated list of studies presented in Part Four; and suggestions for similar problems that can be used to enhance the matter taught. The majority of the didactic comments and explanations were developed during a multi-year study that took place in teacher colleges training pre-service teachers for specialization in mathematics instruction in elementary and middle school, during which most of the activities were conducted. –––––––––––––– 1
Some of the activities in groups 1-4 are based on The Connected Mathematics Project, Michigan State University, U.S.A (Lappan et al., 2002)
73
CHAPTER 7
The five groups of activities are followed by a selection of tasks and assignments (without didactic comments and explanations) that are suitable for extra practice, homework, enrichment, or evaluation. Every group includes a number of modular activities built around one central topic or concept. For example, the first group – Introductory Activities – comprises several authentic investigative activities that are suitable to introduce the topic of ratio and proportion before formal instruction, or as a diagnostic tool to test the preparedness of students to study ratio and proportion. Being modular, activities may be assigned in any order according to the judgment of the instructor; however, difficulty levels of the problems in a group are not equal, and thus care must be taken in deciding the order. As suggested in detail in Chapter 3, A Model for Teaching Ratio and Proportion Using Authentic Investigative Activities, a course for pre- and in-service teachers should begin with at least one authentic investigative activity from group 1 introductory activities. Following this, a minimum of two activities from each of groups 2, 3, and 4 (rate, ratio and scaling, respectively) can be chosen in any order desired. Bear in mind, though, that studies have shown that ratio problems are more difficult than rate problems, and scaling problems even more difficult. Finally, at least one activity from group 5 (inverse proportion) should be taught.
Incorporating the Literature For each investigative activity, authentic articles on theory and research of ratio and proportion should be included. For some activities, didactic remarks refer to appropriate articles for the topic under study; for others, appropriate articles can be discovered in the annotated list presented in Part Five, Chapter 18. By including articles on theory in the teaching process, the mathematical knowledge required for developing the concepts may be reviewed and summarized. Presenting results of studies gives students a broader perspective on the concepts involved in teaching the topic, and encourages preliminary discussion that may elucidate teaching methods appropriate for teaching it in schools. Examples of How to Combine Research Articles into Authentic Research Activities 1. After solving two or three problems in rate and one or two problems in ratio, a theoretical article on the subject of ratio from a mathematical viewpoint is valuable. The sections “The Concept of Ratio” or “The Concept of Proportion” from Chapter 4 (see Part Two of this book), would be appropriate. 2. In one of the ratio activities “Everyone Solves it Differently,” (Chapter 10, activity 3.3) different strategies that may be used for solving ratio and proportion problems are examined. A theoretical article on the psychologicaldidactical perspective could be incorporated into the teaching plan, such as from the chapter the psychological-didactical views of proportional reasoning (Chapter 5), particularly the second section: “Strategies for Solving Ratioand-Proportion Problems—A Brief Review of the Literature.” In addition, 74
AUTHENTIC ACTIVITIES—INTRODUCTION
examples of different strategies discussed in the comments and explanations of other activities would be worth sharing with participants. 3. After the first lesson of a rate problem, the article “Fractions attack! Children thinking and talking mathematically” (Alcaro, Alston, & Katims, 2000) could be given to participants to read and analyze, using the analysis tools given further on in this book (Part Four). 4. The article “Proportional reasoning among 7th grade students with different curricular experience” (Ben-Chaim et Al., 1998) is recommended reading either at the end of the group 2 (rate) activities, during scaling activities , or after theoretical discussion on the significance of the terms ratio and proportion from a mathematical view. 5. Tracy and Hague’s paper, “Toys 'r' math,” (1997) can be given for reading and discussion at the end of the scaling activity “What’s the Real Size?” (Chapter 11, activity 4.3) In addition to articles from the literature, mathematics teachers are encouraged to take advantage of the new technologies available via the internet. For example, the site http://www.math.com/school/subject1/practice/51u2L2/s1u2L2Pract.html presents the theory of ratio and proportion including strategies of problem solving. Many sites are available that have short video clips that can be a perfect introduction to the subject of ratio and proportion and that will connect the subject to the pupils’ realm of experience. Additionally, there are many clips on YouTube that can be utilized to engage the pupils' attention and make the learning interesting and relevant and which will embellish the study of ratio and proportion in elementary and middle school. Two links are provided below. The first clip shows a customer in a supermarket that must decide which box of cornflakes to buy. In order to compare prices, she uses her knowledge of ratio and proportion to determine the unit price for each box. The second clip gives a demonstration of calculating unit price and sales tax. Many other clips may be found to add interest and excitement to the lesson. http://www.youtube.com/watch?v=j7CWX8pkuso&NR=1 http://www.youtube.com/watch?v=QkDlIv8qfUs&feature=related THE ACTIVITIES BY GROUP
In the authentic investigative activities presented herein, the topic of ratio and proportion is presented across the mathematical and psychological-didactical spectrum. The course allows participants to explore the topics both broadly and deeply, meeting their needs both as students developing proportional reasoning abilities, and also as teachers developing professional, effective and confident teaching methods. By studying a myriad of strategies for solving the problems and questions, their confidence and the decision-making needed to choose them will be boosted. They will learn to solve proportional problems, recognizing the situation as a multiplicative—not additive—one, and using and comparing the quantitative 75
CHAPTER 7
information given (ratios, measurements, fraction, percentages, scale, tables, functions, etc.) in a knowledgeable way to find the correct quantitative mathematical solution to the problem. Developing these concepts and the ability to use them intelligently is the heart and soul of proportional reasoning. From a mathematical standpoint, the tasks and assignments presented in the activities are varied and include problems comparing qualitative data to predict a qualitative answer; problems comparing quantitative values to determine which value is larger and by how much; and problems with missing values, in which three values of a ratio are known and the fourth must be found. Group 1: Introductory Activities In this group are three authentic investigative activities (see below) especially suited to introduce the topics of ratio and proportion. Note: the scaling activity entitled “Puzzle,” (Chapter 11, Activity 4.4), is also appropriate as an introductory activity. These activities serve to introduce the topic before formal teaching, and to increase students’ motivation to explore the world of ratio and proportion. They also serve to test the intuitive knowledge of participants; by starting out using intuitive knowledge, they crystallize their first understanding of the concept of ratio and proportion. These introductory investigative activities are meant to encourage group discussions, during which the proportional abilities of participants can be tested. Even more important, this is a chance to impress upon pre- and in-service teachers the importance of ratio and proportion as a tool for developing abstract mathematical thinking in their students. Experience has shown that such discussion is useful in addressing most of the difficulties that school teachers may have in teaching the topic, such as identifying pupils who use additive reasoning (i.e., using addition, subtraction and/or differences to compare proportional values) instead of multiplicative reasoning (using multiplication, division, ratio, percentages); or identifying any misconceptions present (due to erroneous previous knowledge, or from inaccurate definitions of mathematical concepts). Additionally, during the discussion many questions arise about the intrinsic importance of the topic or ratio and proportion and the need for teaching it. A Teaching Event. This activity is quite relevant to teachers as the circumstances discussed within are probably frequently encountered by the teacher. It describes a situation in which an elementary school teacher has run into a problem in teaching her class about ratio: some of her pupils still use additive thinking, whereas others are more mature and use multiplicative thinking. During discussion of the problem, a range of ways to overcome them will be suggested. Statements Concerning Ratio and Proportion. This activity is relevant to pre-service teachers and will serve to reveal prior knowledge of the subject before formal teaching. In it, they are requested to elucidate and define various concepts of ratio and proportion in an intuitive fashion, and to form a mathematical definition for each one of the concepts. 76
AUTHENTIC ACTIVITIES—INTRODUCTION
How Do We Compare? This activity is relevant to children in elementary school. It presents three stories after which students must answer questions, such as which juice tastes more ‘orangey’; in which country is the population more crowded; and which car has better gas efficiency (gets better mileage). Students learn that in order to make qualitative and quantitative comparisons efficiently, they must use both common sense and proportional reasoning skills.
Group 2: Rate Activities In this group are the six authentic investigative activities listed below. The activities in this group relate to problems of rate, or density. The formation of the rate concept is achieved through problems wherein values of different variables with an interesting connection are compared, such as kilometers (or miles) per hour, price per unit, kilometers per liter (or miles per gallon), grains per volume, density (individuals per square kilometer or square mile), kilograms per cubic meter, and more. Mathematically, the activities in this group aid in developing the concept of rate in its varied forms, and allow practice in quantitative comparisons and finding missing values in a given proportion by using the rules and properties of ratio and proportion. Additionally, they serve to enhance the ability to find qualitative answers for problems that do not require quantitative solutions. Who’s Correct? This activity is relevant to teachers and focuses on determining which car uses the least gasoline for each kilometer traveled. It requires understanding the concept of ratio as a rate. In the didactic comments and explanations, a wide variety of suggestions are made that can increase the difficulty of the activity, including connecting it to the advanced topic of functions and ways of presenting them. Which CD is a Better Buy? This activity is relevant to both teachers and children and shows how to discover the price of a CD when the advertisement doesn’t specifically reveal it. This activity uses proportion to find the missing value. Beads, Beads, Beads is relevant to children and deals with finding price per unit. The didactic comments and explanations are very detailed and suggest activities to expand and enrich the exercise. At the Dairy and Bianca the Cow is relevant to both adults and children and teaches how to use concepts of ratio and proportion to find the amount of cheese that can be produced from a specific amount of milk. Included with this activity is an actual article from a newspaper, which should serve to increase interest and motivation. How Many Beans in the Bag? This is a familiar exercise for teachers and pupils alike, and has the advantage that it can be put into practice as a real research activity. The activity focuses on the use of quantity assessment, and its purpose, in essence, is to understand the concept of density through the presentation of different methods of obtaining the requested ratio. The activity can also be used as
77
CHAPTER 7
an introduction to the concept of density, in anticipation of the activity below (Counting the Crowd) where a different method for estimation is presented. Counting the Crowd is relevant to adolescents as media consumers. Here, they discover how the press or the police estimate the crowd size. During discussion, the concept of density is developed as a tool for efficient estimation, and its relationship to the concept of proportion is clarified. Group 3: Ratio Activities In this group are five authentic investigative activities (see below) that use ratio to define some relationship. The relationships all involve comparison of values or amounts (in the numerator and denominator of a fraction) that have the same unit of measurement. Such comparisons can be two parts of a whole, or two amounts that are related conceptually, but are not part of a common whole. The activities include analyzing ratios comparing amounts (Which is the Best Cola?); finding and using a ratio to divide up the whole (Pizza Party, and Profits Between Partners); finding the part from the whole, and finding the whole from the part (Pizza Party, Everyone Solves it Differently, What’s in Rust?). Solving the activities in this group will aid in developing a mathematical concept of ratio from different viewpoints, and will teach the use of the concept to both carry out qualitative comparisons and to find missing values (quantitative) in a given proportion by using the rules and properties of ratio and proportion. Which Cola is Best? This activity is relevant to both students and teachers. Everyone is familiar with product marketing through advertising where quantitative information is given, but not everyone is equipped to analyze the information intelligently. Here, quantitative data that has been collected in a tastetest survey of a new cola drink are presented. Using the concept of ratio to analyze the data, students must decide which cola was actually preferred. In the didactic comments and explanations, a variety of different activities are suggested, including different ways to compare quantities: verbally, visually, numerically using ratios, numerically using percentages, graphically, and (on a more advanced level) using functions. Pizza Party. This activity is relevant to the world of children and focuses on dividing some whole according to a ratio that must be discovered. A group of children, who are sitting around two tables in a pizza restaurant, must divide some large pizzas amongst themselves. One boy arrives late and must decide which table he wants to join. In this activity, not only is intelligent judgment (where can he get the most pizza) addressed; affective-emotion considerations and those stemming from the visual representation of the problem are also discussed in the didactic comments. Everyone Solves it Differently. This investigative activity is remarkably suitable for children, but the main purpose, here, is to present teachers with an especially wide variety of strategies that can be used to divide a quantity by a given ratio. The plethora of strategies, including intuitive, additive, pre-formal and formal (proportional formula), are those that the authors of this book gathered from 78
AUTHENTIC ACTIVITIES—INTRODUCTION
the myriad solutions and suggestions offered by young children, and pre- and inservice teachers during their research. What’s in Rust? This investigative activity is relevant to both adults and adolescents who may have wondered what causes a metal implement to break for apparently no reason. Frequently, rust is the culprit. In this activity, the component in rust that causes it to “eat” metal is investigated; it soon becomes apparent that the use of the ratio concept can help. The activity even leads to finding a general method for finding the amount of iron and oxygen in any amount of rust. Profits between Partners. This activity is primarily relevant to the adult world of pre- and in-service teachers. The purpose of the activity is to expand the concept of ratio and proportion when using direct proportion, and to reinforce the use of ratio in finding missing values. In addition, this activity introduces the connection between ratio and an arithmetic series (or progression), and allows an opportunity to ensure that pre-service teachers are fully familiar with this subject. Group 4: Stretching and Shrinking (Scaling) Activities This group comprises seven authentic investigative activities that all relate to scaling, a type of ratio that is created when one needs to enlarge or reduce linear (one-dimensional), two-dimensional, or three-dimensional objects. The activities in this group show how to calculate the enlargement/reduction factor, or a “scale” of a given diagram/figure. They include finding and using a ratio created by enlarging or reducing a picture; linear (1st degree) stretching or shrinking; quadratic (2nd degree) stretching or shrinking of area; and cubic (3rd degree) stretching or shrinking of volumes; calculation of real distance according to a given scale; using scale to compare sizes of objects; and more. Wimpy in Wonderland This activity is relevant to the world of students who often visit amusement parks and may have encountered the amusing hall of mirrors. The activity focuses on finding the enlargement factor, while relating this to basic knowledge in geometry (circumference and area), and the use of scaling. The didactic comments and explanations are extremely detailed and include many varied suggestions for further activity. Additionally, there are suggestions of how to expand the activity to bring it to a more difficult level and, in parallel, suggestions for adapting the difficulty to that appropriate for elementary-school children. The Beth- Shean Temple is relevant to the world of students, especially if the school is involved in inter-disciplinary teaching combining mathematics with geography. The activities focus on discovering the scaling factor, and using it to find the sizes of area and volumes in reality. The activities have two stages: the first is finding 1st- and 2nd-degree scaling, and the second is comparing volumes (3rd degree scaling). The didactic comments and explanations clarify in great detail the solutions for the tasks and various assignments. What’s the Real Size? This activity is relevant to the world of children and emphasizes that learning is possible (and more effective) when pupils are engaged, such as when they are playing with toys. The activity is based on a study that took 79
CHAPTER 7
place in the United States in which researchers found that introducing toys into the learning activities of pupils in 7th grade greatly improved their motivation to study topics such as scaling and proportion. In the didactic comments and explanations, a variety of possible activities are suggested for pre- and in-service teachers, along with examples of the activities that the American researchers did with school children. The Puzzle. This activity is relevant to both children and teachers. Most people enjoy doing puzzles. The mission, here, is two-fold: to assemble a puzzle, and then to create another, larger, but similar puzzle. At first glance, it seems like a simple game, but during the investigative process, difficulties, misguided concepts and errors common to both children and adults are discovered. The Thief and the Teacher. This activity is presented as a mystery brainteaser. Its aim is to test the use of scale in photographs to find actual sizes. Additionally, this activity goes beyond the concept of scale to introduce that of spatial perception, and its use in optical illusions. The Giant Slayer. This activity is relevant to the world of adults, who are the primary consumers of communication services. The activity presents a newspaper photo of a turbine uprooted by a hurricane. By carefully observing the picture, the scale can be determined to find the actual, quantitative size of the turbine. The Reduction Triangle is an activity relevant to both children and teachers. An advertisement promises a 10% reduction on the cost of electronic equipment, and graphically represents the price and the reduction as a triangle that is “cut.” This type of advertisement is familiar to all, and a reliable tool to test its claims is necessary. The activity suggests a mathematical method to check if the actual price reduction is presented credibly in the illustration. Group 5: Indirect Proportion Activities In this group are three authentic activities that portray situations in which the proportional relationship is one of inverse or indirect proportion. Briefly, inverse proportion between two positive variables occurs when their product is constant. In other words, if one of the variables changes in one direction (e.g., increases), then the other must change in the opposite direction (i.e., must decrease). For example, if a balance or beam is in equilibrium, then, if the weight of the object on one end is increased by m, the length of the arm connecting that weight must be decreased by m, and vice versa; if the object’s weight decreases by m, the length of the arm must increase by m. The activities here are presented to complete the development of the concept of proportion. Even though the literature has shown that indirect proportion problems are difficult, completing the conceptualization of the proportional concept requires experience with these types of problems, and they should not be ignored. How Heavy is the Meteorite? This activity is relevant to both teachers and children. It is presented as a riddle and its purpose is to challenge students with an event from outer space. Space is mysterious and intriguing, and different viewpoints concerning it are encountered in the media. The didactic comments and 80
AUTHENTIC ACTIVITIES—INTRODUCTION
explanations detail ways in which the problem can be solved using inverse proportion, first intuitively, and later formally. Turn-of-the-Century Bicycle. This investigative activity is relevant to children, especially if the school is interested in inter-disciplinary teaching combining mathematics with history and science. The bicycle presented in this problem is an authentic object from a museum and bits of history can be learned from the description of the scientists’ invention process, alongside physical principles and their mathematical descriptions. Graduation Honors Stage is an investigative activity appropriate for students. At face value, there doesn’t seem to be much connection between inverse proportion and setting up a stage at the end of the school year. Yet, after studying the matter, it will be seen that there is, indeed, a constant product between the number of students and the number of work-days (power/work problem) in an inverse-proportional way. The didactic comments discuss problems that may be encountered during this type of exercise and gives example of errors that were made by pre-service teachers doing this exercise. They also suggest other activities connected to the concepts of “work and power. Group 6: Additional Tasks/Exercises for Practice and Enrichment Following the detailed activities described above, two more sets of activities that involve finding direct or indirect ratios are presented. The first set includes didactic comments, solutions, and explanations; the second set presents questions only. These activities are suitable for extra practice, homework assignments, enrichment, and evaluation. The instructor can choose among them according to his/her needs.
81
CHAPTER 8
GROUP 1 INTRODUCTORY ACTIVITIES
Activity 1.1: Activity 1.2:
A Teaching Event
Statements Concerning Ratio and Proportion
Activity 1.3:
How Do We Compare?
83
CHAPTER 8
Activity 1.1: A Teaching Event Worksheet Description A grade-six teacher wanted to test her students’ previous knowledge and readiness to learn ratio and proportion before she began formal lessons.
The teacher wrote the following on the board: Sara and Tom wanted to surprise their mother for her birthday. They brought her a lovely bouquet of flowers for a gift. The bouquet had 3 tulips and 9 roses. She asked the students to write down any and all statements they could think of, that described the situation, without adding any new information. The teacher collected the answers, and then divided them into two main categories as follows Group A (statements given by most of the students) 1. There are more roses than tulips. 2. There were a total of 12 flowers in the bouquet. 3. There are 6 less tulips than roses. 4. The difference between the number of roses and the number of tulips is 6. Group B (statements given by only a small number of students) 1. There are 3 times more roses than tulips. 2. Of the total number of flowers, 9/12 are roses and 3/12 are tulips. 3. Twenty five percent of the flowers are tulips and 75% of the flowers are roses. 4. For every one tulip, there are 3 roses. 5. The number of tulips is 1/3 that of the roses. 6. The ratio between roses to tulips is 3:1 (an exceptional student). Tasks 1) For each group of answers, add any other statements that students might give before they learned about ratio. 2) In a group, discuss whether you think the students in the teacher’s class are ready to learn about ratio. Discuss the following: 3) What characterizes the statements in group A? What type of mathematical relationship do they represent? 4) What characterizes the statements in group B? What type of mathematical relationship do they represent?
84
AUTHENTIC ACTIVITIES—GROUP 1: INTRODUCTORY
5) How do you think these characteristics influence, if at all, the readiness of students to learn about ratio? 6) How would you help the teacher decide if her students are ready to learn about ratio?
85
CHAPTER 8
Activity 1.1: A Teaching Event Didactic Comments and Explanations Theme/Subject matter: Introductory - Initial exposure to the concept of ratio and application of ratio for dividing quantities. Concepts:
Ratio, dividing a quantity in a given ratio.
Purpose of activity: To offer awareness of difficulties that may arise teaching the topic in school; to illustrate the difference between additive and multiplicative reasoning; to present pre-service teachers with a way of gathering information on the readiness of their students for the subject (by determining which students use multiplicative reasoning, and are ready to proceed, and which still use additive reasoning). Connectivity to other topics: of ratio.
Teaching methodology for introducing the topic
Comments and explanations for tasks Task 1 : For each group of answers, add any other statements that students might give before they learned about ratio. This task should be done individually. The pre-service teachers are to write down statements they imagine sixth-grade students would give, and then divide them into groups similar to the example. Other possible statements, based on our study of pre-service and in-service elementary-school mathematics teachers, are the following:
Group A 1. There are fewer tulips than roses. 2. In the bouquet, there are six more roses than tulips. 3. The total number of flowers is 12. 4. The number of tulips is a prime number, and the number of roses is a composite number. Group B 1. The number of tulips is three times smaller than the number of roses. 2. Of the total number of flowers, ¾ are roses and ¼ are tulips. 3. For every 3 roses there is 1 tulip. 4. The number of roses is 9/3, or 3/1, of the tulips. 5. The ratio between tulips to roses is 1:3 or 3:9 6. For every 1 rose, there is 1/3 tulip Task 2 : In a group, discuss whether you think the students in the teacher’s class are ready to learn about ratio. Discuss the following: 86
AUTHENTIC ACTIVITIES—GROUP 1: INTRODUCTORY
What characterizes the statements in group A? What type of mathematical relationship do they represent? In the above-mentioned study, the common answer was that group-A statements were indicative of additive thinking. Such statements do, indeed, give additive mathematical relationships between values, that is, mathematical relationships are defined by adding or subtracting (i.e. the sum or difference of two values). What characterizes the statements in group B? What type of mathematical relationship do they represent? In the above-mentioned study, the common answer was that group-B statements were indicative of multiplicative thinking. Such statements represent multiplicative mathematical relationships between values, that is, mathematical relationships are defined by multiplying or dividing (i.e., the product or quotient of two values). How do you think these characteristics influence, if at all, the readiness of students to learn about ratio? Pre-service teachers should be made to understand that additive thinking makes it difficult to understand the concept of ratio; it is advisable to bring pupils to the level of multiplicative thinking before beginning lessons in ratio, using concrete examples, or exercises that show multiplicative relationships common to the pupils’ world. How would you help the teacher decide if her students are ready to learn about ratio? A teacher who wants to determine the readiness of her students must test them to see if they have multiplicative reasoning skills, and assist weaker students to learn how to think multiplicatively before beginning lesson on ratio. In the example given in the activity, it is obvious that a large number of students are not ready to study ratio, but those with additive thinking must be helped to advance their thinking skills.
87
CHAPTER 8
Activity 1.2: Statements Concerning Ratio and Proportion Worksheet Description Statements regarding ratio and proportion will be developed and explored. Tasks 1. Individually, do the following: 1) List any statements that, in your opinion, clarify the meaning of the concept “ratio.” These can be phrases, sentences, concrete examples, mathematical equations, or any other description that you feel will explain to your students what “ratio” is. 2) List any statements that, in your opinion, clarify the meaning of the concept “proportion.” These can be phrases, sentences, concrete examples, mathematical equations, or any other description that you feel will explain to your students what “proportion” is.
2. In groups, do the following: Examine and discuss each statement for each of the concepts (ratio and proportion). Decide which statements are successful at explaining the meaning of the concept. Develop (as a group) a mathematical definition for each concept. Divide the statements into groups with a common idea. Summarize your discussion as follows: 1) On a transparency, list all the statements concerning “ratio,” grouped according to common idea, and summarized by the mathematical equation that was developed. 2) On a second transparency, list all the statements concerning “proportion,” grouped according to common idea, and summarized with the mathematical equation that was developed. 3) As a group, brainstorm and list (on a separate page) all the fields of knowledge in which proportional relationships between variables may be found. 4) Have one member of the group present the group’s findings to the rest of the class.
88
AUTHENTIC ACTIVITIES—GROUP 1: INTRODUCTORY
Activity 1.2: Statements Concerning Ratio and Proportion Didactic Comments and Explanations Theme/Subject matter: Introduction to “ratio and proportion.” Concepts: Ratio, proportion. Purpose of activity: First encounter with concepts of both “ratio” and “proportion”; to determine the ability of pre-service teachers to verbally explain the significance of the concepts, whether intuitive or based on previous knowledge; to determine their ability to mathematically define these concepts. Connectivity to other topics: Teaching methodology for introducing the topic of ratio and proportion; how to explain the significance of the concepts. Comments and explanations for tasks This activity is appropriate as a first step to presenting the topic of ratio and proportion. Having students work individually at the beginning serves to increase their concentration; having them later discuss their findings in a group compels them to consolidate and justify their statements on proportional reasoning in order to have their classmates accept their explanations. Research indicates that an introductory teaching activity is necessary since, many pre-service teachers have difficulty understanding the topic and consequently leading to difficulty teaching it (Keret, 1999; Ben–Chaim, Ilany, & Keret, 2002; Ben–Chaim, Keret, & Ilany, 2007). Through this introductory activity, the participants’ accessible knowledge can be determined Our studies showed that when pre-service teachers were asked to explain, define mathematically, or give an actual example of various concepts of ratio and proportion, close to 50% of them couldn’t answer, or wrote “don’t know” or “don’t remember.” In the study, neither one pre-service teacher that had trained to teach mathematics in elementary school, nor any in-service elementary-school teachers could present an accurate mathematical definition of all/both the concepts. However, verbal statements given by those that did answer the question, indicated that some intuitive knowledge of the two concepts was present, as can be seen in some of the examples offered by students in the study: 1. “At age one, the height of a tree is 1 meter, at age two it is 3 m, and at age three it is 9 m. By what factor did the tree grow each year?” 2. “To prepare a drink for a baby, for every 60 ml of milk, 3 tsp of powder must be added.” 3. “The ratio of number of tables to number of chairs in a classroom.”
Such statements do show the existence of multiplicative thinking, which will allow further understanding of concepts of ratio and proportion. The presence of additive thinking skills only (typical of young children, see typical statements in the previous activity, A Teaching Event), indicates that students are not yet ready to be taught the topic.
89
CHAPTER 8
After the students write their statements on the transparency, each group will present their work, and a full discussion can take place. At the completion of the discussion, students’ attention should be directed to the chapter on the development of proportional reasoning in Part Two (Theoretical Background) of this book, in order to give them further insight into the topic. Here, the stages in the development of proportional reasoning in children are described in detail, along with results of studies dealing with difficulties and the reasons therefore in understanding the topic. At this stage, there is no need to actually define concepts mathematically; at this stage it is important to identify any students who may be using additive thinking skills and to educate them accordingly.
90
AUTHENTIC ACTIVITIES—GROUP 1: INTRODUCTORY
Activity 1.3:
How Do We Compare? Worksheet
Description Three familiar activities are presented to trigger students’ awareness of using the concepts of ratio and proportion to compare between quantities. Activity 1.3.1 Omer and Mollie are testing four recipes for preparing orange juice to decide which one gives a more “orangey” drink. In the first recipe, 2 cups of concentrate are mixed with 3 cups of water. In the second, 1 cup of concentrate is mixed with 4 cups of water. The third recipe uses 4 cups of concentrate with 8 cups of water, and the fourth uses 3 cups of concentrate and 5 cups of water. Which mixture will have the most intense flavor? Activity 1.3.2 In country A, 721,000 residents live in an area of 75,896 square kilometers. In country B, there are 638,000 residents in an area of 68,994 square kilometers. In which country is the population density higher? Activity 1.3.3 Orit’s car uses 19 liters of gasoline to travel 580 kilometers. Dana’s car uses 15.5 liters of gasoline to travel 452 kilometers. Which car is more efficient? Tasks 1) Present different methods for solving each of the problems presented. 2) Explain your reasons for choosing the methods that you did.
91
CHAPTER 8
Activity 1.3:
How Do We Compare?
Didactic Comments and Explanations Theme/Subject matter: Familiarity with the concepts of ratio and proportion. Concepts: Ratio, proportion. Purpose of activity: Introduction to the concepts of ratio and proportion; assessing participants’ ability to use ratio and proportion to compare between quantities; assessing proportional reasoning of pre-service teachers. Connectivity to other topics: Fractions, percentages, graphs, comparison tables. Comments and explanations for tasks This is an excellent opening activity for ratio and proportion. Through discussion of the three problems, pre-service teachers will become aware of the need for using ratio and proportion to solve various comparison problems. Initiate the discussion by asking the pre-service teachers to present ideas for solving each of the problems, without any mention of the terms “ratio” or “proportion.” The class can be divided into groups of 2-3 students, each group discussing comparison methods amongst themselves (for one or all of the problems, as decided by the instructor). Afterwards, each group will present to the class the comparison methods found, and discussion will follow. This is an opportunity for the instructor to suggest dividing the methods into categories (see Activities 1.1 and 1.2 above in this chapter) to emphasize the difference between multiplicative and additive thinking. There is no need, at this point, to teach solution strategies. The purpose of this exercise is to evaluate answers given intuitively. By analyzing the ideas offered in class, it can be determined which pre-service teachers have the ability to use proportional (multiplicative) reasoning, and which participants, if any, use additive reasoning when multiplicative reasoning is called for. During class discussion, the following questions can be introduced to extend the discussion and connect the topic to other concepts familiar to the pre-service teachers:
1. How can fractions be used to express the data? 2. How can percentages be used to express the data? At the conclusion of the activity, it is advisable to explain that the problems given are very similar to others in many, various situations. This initial unit assists in developing skilled thinking for solving problems dealing in comparison. In later units, many concepts, ideas, and mathematical skills already familiar to students— from simple fractions and decimals, percentages, and rate expressions, to tables, graphs, and algebraic equations—can help solving comparison problems. A full summary of the activity should include the idea that when comparing items, words such as “faster,” “stronger,” “higher,” “richer,” “smarter,” “heavier,” “flatter,” “tastier,” etc. are used. Often, such words are enough to provide the
92
AUTHENTIC ACTIVITIES—GROUP 1: INTRODUCTORY
information sought. It is enough to know, for example, that one box is heavier than another, one printer is faster than another, and one car is safer than another. These comparisons are qualitative comparisons. In other instances, though, more information is needed: HOW MUCH heavier, faster, or safer the item is needs to be determined. This is quantitative comparison, and requires the comparison of numerical (quantitative) data collected through counting, measuring, finding the rate, etc. of the items. This unit allows investigating different ways of comparing and determining which comparison strategies give the best solution. Comments Regarding Activity 1:
The Juice Activity
During research conducted by the authors in Israel, grade-five and grade-six pupils offered a number of varied strategies to compare the sweetness of the juice mixtures. The strategies were categorized according to those that resulted in correct and incorrect answers. Following is a summary of the typical types of solutions offered by the pupils. Strategies leading to correct solutions. All the strategies leading to correct answers employ some type of multiplicative thinking. These are pre-formal strategies that use simple fractions, decimal fractions, or percentages to find the ratio that would lead to the correct solution. The strategies included: 1. Determining the ratio of orange concentrate to water (fraction/percentage/decimal fraction). 2. Determining the ratio of orange concentrate to the entire volume (fraction/percentage/decimal). 3. Determining the ratio of 1 cup concentrate to the total volume of water, as in the following table. Juice 1 1 1 1
Water 1.5 4 2 1.66666
4. Determining the ratio of 1 cup of water to concentrate, as in the following table. Water 1 1 1 1
Juice 2/3 1/4 1/2 3/5
5. Strategies comparing simple fractions. 93
CHAPTER 8
Strategies leading to incorrect answers. These generally arose from additive thinking processes (using differences or some other relation between the components). Some of the strategies also referred only to one aspect of the ratio or to the magnitude of a number. These included:
1. Calculating the difference between the quantities of components. 2. Referring to the quantity of only one component (juice or water). 3. Relating to the absolute difference between values (e.g. when comparing the ratios 1:3 and 2:5, the difference between the values is 2 in the former and 3 in the latter, leading to the impression that the first ratio is a “stronger” solution, when in fact it is not) 4. Relating to only the larger numbers. 5. No answer, or answers without any mathematical basis.
94
CHAPTER 9
GROUP 2 RATE ACTIVITIES Activity 2.1: Activity 2.2:
Which CD is a Better Buy?
Activity 2.3: Activity 2.4: Activity 2.5:
Who’s Correct?
Beads, Beads, Beads
At the Dairy and Bianca the Cow How Many Beans in the bag (density)
Activity 2.6:
Counting the Crowd (density)
95
CHAPTER 9
Activity 2.1:
Who’s Correct?
Worksheet Description
Alice and Barbra are teachers. One day they meet at a teacher's convention. Each has recently purchased a new car, and they begin to compare their automobiles’ features. Each one brags that their car has been tested to be fuel efficient. Alice says she drove 100 km to the junction, and then 190 km to the city where the convention is, and used only 19 liters of gasoline. Barbra says that she drove 36 km to the junction, and then, like Alice, 190 km to the convention. Her car used only 15.5 liters of gasoline. Barbra claims that her car is the most efficient, but Alice disagrees. Who is correct? Explain your answer.
96
GROUP 2: RATE ACTIVITIES
Activity 2.1:
Who’s Correct?
Extended Activity Worksheet
After their previous discussion, Alice and Barbra could not decide who was correct, so they decided to do some more testing. In order to compare the gasoline consumption of their cars, they rechecked it under different circumstances. They discovered the following: 6. Alice’s car traveled 373 km and used 24 liters of gasoline. 7. Barbra’s car needed 32 liters of gasoline for 464 km. Tasks 1) According the new data, which car is more efficient? 2) Assuming that road conditions are the same for both cars, find the number of kilometers that each car can travel on one liter of gasoline. 3) Using your results from B, above, fill in the following table, below/ 4) For each car, derive a general “rule” (mathematical expression) that connects the number of liters (N) to the kilometers (km). 5) Draw a graph illustrating the “rule” for each car. What does the slope of each graph indicate? 6) Using the “rule,” find the number of kilometers that each car could travel using 9.5 liters, 23.8 liters, 100 liters, 125 liters, and 150 liters of gasoline. Number of liters of gasoline
0
1
2
3
4
5
6
7
8
Distance Alice can drive Distance Barbra can drive
97
CHAPTER 9
Activity 2.1:
Who’s Correct?
Basic Activity Didactic Comments and Explanations Theme/Subject matter: Ratio with meaning of Rate Concepts: Ratios, proportions. Purpose of activity: Familiarization with the concept of “rate” that creates new units, such as km/l or l/km, miles/gallon or gallon/miles. Connectivity to other topics: Fractions, comparing simple fractions and decimal numbers. Comments and explanations for tasks Task: Who is correct? Explain your answer. The purpose here is to find criteria to decide which teacher is making the correct statement. Mathematically, the problem involves comparison of fractions. There are two ways to tackle the problem: comparing the distance that can be driven for each liter of gasoline (km/l), or comparing how much gasoline is required for a certain distance (l/km).
1. Comparing km/l: 290km = 15.26 km/l 19l 226km Barbra’s car: = 14.58 km/l 15.5l Alice’s car gets more distance for one liter of gasoline; therefore Alice’s car is more efficient. Alice’s car:
2. Comparing l/km: 19l = 0.0655 liter per kilometer 290km 15.5l = 0.0685 liter per kilometer Barbra’s car: 226km
Alice’s car:
Here, the smaller the number, the lower the gas consumption is and the more efficient the car is. In this case, Alice’s car uses less gasoline per kilometer and is (still) the most efficient. Both ways of calculation lead, obviously, to identical answers, that is that Alice’s car is the most efficient. In actuality, car efficiency is more commonly given as kilometers to the liter, and not the reverse. However, it is also valid to
98
GROUP 2: RATE ACTIVITIES
speak about fuel consumption per 100 km. Thus, Alice’s car uses 6.5 liters per 100 km, and Barbra’s car uses 6.8 (almost 7) per 100 km. Additional points for discussion. 1. Why must comparisons be made over 100, 200, or 300 km, and not for just, say, 10, 20, or 30 km? A practical discussion can be held: if one travels only 10, 20 or 30 km, differences cannot be accurately noticed, since the tachometer of a car is not sensitive enough; gas consumption may appear almost equal for all the cases. 2. How can road conditions affect the answers? Because road conditions (inclines, declines, traffic jams, etc.) can influence the speed and gasoline consumption of a car, comparing gas consumption must take road and traffic conditions in account and it must be expected that different results will be obtained under different condition. For example, traveling a certain distance between cities will give different results than travelling the same distance within a city. Or, two cars using the same amount of gasoline to travel the same distance, but one is going uphill, and the second, are not equally efficient. Adapting the activities for the classroom Pupils can collect data pertaining to their parents’ car, chart them, and compare them.
99
CHAPTER 9
Activity 2.1:
Who’s Correct?
Extended Activity Worksheet Didactic Comments and Explanations
This activity is an extension of the basic activity and introduces functions and different ways of representing the data, using mathematical expressions, graphs, or tables. For example, a graph can be prepared that illustrates the gas consumption as the ratio between the number of kilometers to the number of liters of gasoline. For Alice’s car (373 / 24 = 15.5km/l) the linear function is K = 15.5×N (N = liters of gasoline, K = km travelled), and in general K = aN, that is to say, a straight-line (linear) function. Additional points for discussion. Does a straight-line graph accurately depict the distance, K, traveled per N liters? A linear function represents a constant ratio between the number of kilometers and the quantity of gasoline that is consumed. In reality, gasoline consumption is not necessarily constant, and is affected by road conditions such is inclines, declines, stopping at intersections, traffic jams, etc. The mathematics actually optimizes the results and does not illustrate reality in its simplest form, but rather presents an optimal model of a given situation. Also, under different conditions, different results (i.e. a different constant) would have probably been obtained. And while in this case, the slope of the function K = 15.5N defines the gasoline consumption of Alice’s’ car, her gas consumption cannot be really be constant for the entire length of the journey, so in actuality, the slope, 15.5, represents the average gasoline consumption. Following the exercise, students can be assigned the section regarding the concept of ratio in Chapter 4, A Mathematical Perspective of Ratio and Proportion, for reading and discussion in class.
100
GROUP 2: RATE ACTIVITIES
Activity 2.2:
Which CD is a Better Buy? Worksheet
Description Advertisements can be tempting. And clever! Finding the best buy isn’t always easy.
Two CD shops post advertisements in their windows.
First Store
Second Store
Tasks 1) How can the best buy be determined? 2) Explain the strategy you used and your reasoning. 3) Suggest two more advertisements to sell CD packages of 6 or 9 discs.
101
CHAPTER 9
Activity 2.2:
Which CD is a Better Buy?
Didactic Comments and Explanations Theme/Subject matter: Ratio as a rate. Using ratio to determine unit rate. Concepts: Unit price /unit rate. Purpose of activity: To increase understanding of the concept of rate; to solve problems by comparing ratios. Connectivity to other topics: fractions, comparing decimal values. Comments and explanations for tasks This problem is essentially an additional “rate” problem, in which money per unit is determined. It is brought to enhance the understanding of the concept of unit price. 1) How can the best buy be determined? 2) Explain the strategy you used and your reasoning. This problem can be solved in various ways, for example: a) Comparing ratios, where the ratio is the price for one CD in each store. The best purchase is the one where the answer (the unit price) is the least. b) Determining a common multiple of discs, and applying it for each store. In this example, we would determine how much 35 CDs would cost in each store. c) Determining how many CDs could be purchased for a specific amount. 3) Create two more advertisements to sell packages of 6 or 9 CDs. This question provides additional practice in comparing ratios by finding out the unit price. Adapting the activities for the classroom This investigative activity is very easily adapted for children in elementary school, who often see different prices in advertisements and do not know that they have the means to compare the prices. As a motivational activity, children can be asked to visit a number of stores to bring back examples of advertisements. The different ways in which the prices are presented can be discussed in class.
102
GROUP 2: RATE ACTIVITIES
Activity 2.3:
Beads, Beads, Beads Worksheet
Description Every year students in Grade 6 go camping for a week of educational, social, and creative activities. Here is a problem that one student came across while working on a project in a beading workshop. Ayala wanted to make a necklace using three types of wooden beads: spherical, cubic, and cylindrical based on the picture below:
In total, she needed 108 beads from all three types. In the camp craft store, she could purchase beads priced as follows: - $12 for a package of 20 spherical beads - $12 for a package of 15 cubic beads - $8 for a package of 10 cylindrical beads - individual beads, at a cost of 10% more than those in the package Tasks Identify the basic pattern for Ayala’s necklace (i.e., how many beads of each type make up the basic pattern unit):
1. How much would the necklace cost to make if Ayala could only purchase beads in packages? Explain your reasoning. Why did you choose the strategy you did? 2. How much would the necklace cost to make if Ayala could also purchase individual beads as required? Remember that individual beads cost 10% more than packaged beads. Explain your reasoning. Why did you choose the strategy you did to calculate the price of the necklace? 3. How many spherical beads would be in a necklace with a total of only 60 beads? 216 beads? X beads? Why? Explain your answer. 4. How many beads of each type would be in a necklace with a total of 216 beads? Explain your answer. 5. If Ayala used 24 spherical beads to make a necklace according to the pattern, how many cubic beads did she use? How many cylindrical beads? Explain your answer. 103
CHAPTER 9
6. How many beads, total, would there be in a similar necklace containing 48 spherical beads? Explain your answer. 7. If Ayala had five packages of each type of beads (spherical, cubic, and cylindrical), how many necklaces with a 6:3:3 patterns could she make? What is the longest 6:3:3-pattern necklace she can make from these packages? Explain your answer.
104
GROUP 2: RATE ACTIVITIES
Activity 2.3:
Beads, Beads, Beads
Extended Activity Worksheet 1) Write equations for each type of bead (spherical, cubic, and cylindrical) connecting the price (m) to the number (n) of the beads. Note that there are two possibilities: purchasing whole packages, and purchasing individual beads. 2) Draw graphs for each type of bead (spherical, cubic, and cylindrical) illustrating the cost for different numbers of beads. Prepare a table describing the data illustrated in the graphs, and find patterns describing how the price rises as the number of beads increases. The amount can be of individual or of packaged beads. 3) How is the cost of an individual bead (for each particular type) represented in the graphs prepared in 2. 4) Explain how the tables and graphs illustrate the patterns that you discovered. 5) What is the average cost of a bead in Ayala’s necklace? 6) Does the ratio between the types of beads determine the cost of the necklace? Explain your answer. 7) Which type of bead is the most expensive? Which is the least expensive? 8) What would be the cost of a necklace built in a 2:1:1 patterns (spherical: cubic: cylindrical) that had a total of 108 beads? 9) Design a necklace with a different pattern but that would cost the same as Ayala’s necklace. How many different designs are possible? 10) Design another necklace with a different ratio of beads, e.g. 3:2:1, and calculate its price.
105
CHAPTER 9
Activity 2.3:
Beads, Beads, Beads Worksheet
Didactic Comments and Explanations Theme/Subject matter: Ratios, determining rate. Concepts: Unit price, percentages, graphs, linear functions, slopes. Purpose of activity: Enhancing understanding of the concept of rate. Connectivity to other topics: Percentages, graphs: equations of straight lines and the function of the slope, averages. Comments and explanations for tasks Tasks 1) How much would the necklace cost to make if Ayala could only purchase beads in packages? Explain your reasoning. Why did you choose the strategy you did? Discuss the following points: a) Is the ratio between the beads in the necklace equal to the ratio between the beads in the packages? It can be seen that the ratios are not the same. The ratio of beads in the necklace is 6:3:3 (spherical: cubic: cylindrical), whereas the ratio of the beads in packages is 20:15:10. The discussion can be expanded to ways of comparing, expanding and reducing ratios, and to the case of ratios between three (or more) items, and its influence on the ratio’s properties. b) What is the easiest method for finding the price per unit (bead)? One way to find the price per bead is to use the ratio between the cost of the package and the number of beads in it, which will yield the price/unit. An alternate strategy could be comparing the ratio of beads in the package to the price, yielding unit/price. Discuss which method is better, price/unit or unit/price? Refer to a similar discussion in the activity “Who’s Correct?” Determining the cost of the necklace if buying only whole packages requires the following four steps: i) Determine the pattern of the necklace. ii) Determine how many beads of each type are needed to complete the necklace. iii) Find the cost for each type of bead. iv) Determine the price of the necklace.
These steps are described in detail below: i) Determine the pattern of the necklace. The pattern uses 6 spherical beads, 3 cubic, and 3 cylindrical, for a total of 12 beads. (Some students may decide from
106
GROUP 2: RATE ACTIVITIES
the photo that the pattern uses 12 spherical beads, 6 cubic, and 6 cylindrical, for a total of 24 beads.) ii) Determine how many beads of each type are needed to complete the necklace. In our case, the necklace will have exactly 9 repeats of the pattern (108:12 = 9). This means 54 spherical beads, (9 × 6 = 54), 27 cubic beads (9 × 3 = 27) and 27 cylindrical beads (9 × 3 = 27). Point out that if the basic pattern is determined as being of 24 beads, than the entire necklace will have 4.5 times the pattern (108:24 = 4.5). Note that if students decide on another pattern, or on a necklace that ends with an incomplete pattern, the calculations will be different. Examples of field trials of the activity, showing (incorrect) additive thinking: Our field studies conducted in teacher colleges followed the solution pathways of pre-service teachers, in which various strategies were exhibited. One strategy used to determine the number of beads in the necklace was through trial and error. While this method can lead to a correct answer since the total number of beads in our example is a whole multiple of the basic pattern of 12 beads, even here, a situation leading to an incorrect solution can occur, when the reasoning is faulty, is as can be seen in the following table that was suggested by a student. Table Prepared by a Pre-Service Teacher to Analyze Quantity of Beads Required for Various Necklaces
Number of patterns (multiples of 2) 1 2 4 6 8
Number of Spherical Beads 6 12 24 48 96
Number of Cubic Beads
3 6 12 24 48
Number of Cylindrical Beads 3 6 12 24 48
Total number of beads 12 24 48 96 192
This table is constructed incorrectly, and leads to the idea that a necklace of 108 beads does not fit a whole multiple of the pattern. However, it can be seen that an error has arisen when going from 4 to 6 times the pattern, where the number of patterns has been increased by 2, but the number of beads has been multiplied by two. Had the student filled in each row of the pattern, and then added up the nine rows, the correct answer would have been reached, despite the flawed strategy. This additive strategy is common to young children in elementary school, where additive thinking is still the norm. In addition, it is almost certain that such additive thinking will result in an incorrect solution if the quantity required is not a whole multiple of the pattern. At this point, a discussion concerning solution strategies for ratio and proportion problems is appropriate (see the relevant section in Chapter 4, A Mathematical Perspective of Ratio and Proportion). 107
CHAPTER 9
iii) Find the cost for each type of bead, as follows: - For 54 spherical beads: 3 packages (20 beads per package, $12 per package) for $36. - For 27 cubic beads: 2 packages (15 beads per package, $12 per package) for $24. - For 27 cylindrical beads: 3 packages (10 beads per package, $8 per package) for $24. iv) Determine the price of the necklace. The total cost of a necklace of 108 beads using packaged beads is $84 ($36 + $24 +$24 = $84). At this point, we can discuss the beads that are leftover in each package, and what can be done with them. 2) How much would the necklace cost to make if Ayala also purchased individual beads as required? Remember that individual beads cost 10% more than packaged beads. Explain your reasoning. Why did you choose the strategy you did to calculate the price of the necklace? The following points should be discussed: a) What would be the easiest strategy for finding the price of the necklace in this instance? In field studies it was found that various methods were used to calculate the cost of the beads. Some pre-service teachers calculated the price from the data given, and only added the 10% at the end of the calculations, thus: 12 12 8 × 54 + × 27 + × 27 = $ 75.6 20 15 10
75.6 ×
110 = $ 83.16 . 100
Some pre-service teachers added 10% to price from the beginning, and then calculated the total: 12 110 12 110 8 110 × × 54 + × × 27 + × × 27 = $83.16 20 100 15 100 10 100
A third way was to add 10% to the cost of the package, and then calculate the price of each bead: 110 110 110 12 × 12 × 8× 100 100 100 × 54 + × 27 + × 27 = $ 83.16 20 15 10
The discussion should ensure that all three possibilities are presented. b) Is it more economical to buy individual beads or entire packages? The discussion should focus on the question: On what does the decision depend? Field studies showed that many pre-service teachers answered as follows: “If we look at price only, it is better to buy the beads individually, as the price is $83.16, whereas buying them in packages cost $84. However, when the difference is so 108
GROUP 2: RATE ACTIVITIES
small, I would rather spend the $84, and have leftover beads for repairs or for a bracelet.” 3) How many spherical beads are in the necklace with a total of only 60 beads? 216 beads? X beads? Why? Explain your answer. In this case, the total number of beads must be divided into a 6:3:3 ratio. For example, if the total number is 60 beads, then we divide 60 into 12 (6+3+3) parts, which means the basic pattern must be repeated 5 times. Thus, 30 spherical beads (5 × 6), 15 cubic beads (5 × 3) and 15 (5 × 3) cylindrical beads will be needed. It should be noted that, the ratio being 6:3:3, the number of spherical beads makes up half of the necklace, something that should have been noticed at the very beginning of the exercise. This question serves to strengthen the understanding that in any event (independent of the size of the necklace), the ratio between the spherical beads and either of the other shapes will always be 2:1, and the ratio between the spherical beads to the total number of beads will always be 1:2. This is an excellent opportunity to reinforce understanding of dividing a quantity by a certain ratio (double or triple ratio). 4) How many beads of each type would be in the necklace with a total of 216 beads? Explain your answer. Here, 216 must be divided using the triple ratio 6:3:3, as explained in the previous paragraph. In this instance, though, the result for each type of bead must be calculated. 5) If Ayala used 24 spherical beads to make the pattern above, how many cubic beads did she use? How many cylindrical beads? Explain your answer. The 24 spherical beads correlate to the first component of the 6:3:3 ratio, which must be multiplied by 4 (4 × 6=24). In order to keep the ratio constant, the other elements must then also be multiplied by 4 also, giving an expanded ratio of 24:12:12, which is identical to the initial ratio. From the expanded ratio it can be seen that for a necklace with 24 spherical beads, Ayala would need 12 cubic beads and 12 cylindrical ones. Another option is to use the knowledge that spherical beads comprise twice the amount of each of the others. Thus, again, 12 cubic and 12 cylindrical beads will be needed. 6) How many beads, total, would there be in a necklace containing 48 spherical beads? Explain your answer. This would be answered in a similar manner as the questions above. Note Tasks 3) to 6) show a number of examples of a “pure” ratio. In question 3), the part must be determined from whole. The ratio of the different types of beads is 6:3:3, which is a ratio between three quantities. Students should be aware that, similar to the case of a ratio between two quantities, one must observe the total quantity (6+3+3=12), and from there the quantity of spherical beads out of the whole (6:12—or, after reduction, ½) can be determined.
109
CHAPTER 9
In 4), 5), and 6), a template for finding the part from the whole is suggested, along with templates for finding the whole from the part. In addition, expansion and reduction of ratios, a property of ratios that can be employed in such problems, are used. (See the section , Mathematical Properties of the Concepts of Ratio and Proportion), in Chapter 4, A Mathematical Perspective of Ratio and Proportion, Field studies showed that a wide range of strategies were used to solve these questions, and the range is similar amongst both pupils and pre-service teachers. However, amongst the pre-service teachers, most of the strategies used were multiplicative and led to the correct solution, whereas amongst elementary school children, strategies used were often additive and led to erroneous solutions (see the section in Chapter 4 entitled Strategies Used for Solving Ration and Proportion Problems). The above questions can be used to extend the concept of the pure ratios. A discussion can be conducted about the properties of ratio, or its use to solve problems, including discussions about solution strategies. Pre-service teachers can also be requested to read and remark on articles reporting studies in this area, or to analyze theoretical background and present it in class. 7) If Ayala had five packages of each type of beads (spherical, cubic, and cylindrical), how many necklaces with a 6:3:3 patterns could she make? What is the longest 6:3:3-pattern necklace she can make from these packages? Explain your answer. This question can be understood in various ways, and more than one answer is possible. Some students may have trouble dealing with such problems (multiple possible answers), because they are under the conception that "mathematics is an exact science and thus there can be only one unique answer for any problem.” In addition, many feel that not only must there be one unique answer, but there is also only one correct strategy for solving any given problem. For the second part of the question, regarding the longest 6:3:3-pattern necklace she can make from these packages, one solution can be as follows. First, the number of each type of bead available is determined: 5 packages of spherical beads × 20 beads per package = 100 spherical beads. 5 packages of cubic beads × 15 beads per package = 75 cubic beads. 5 packages of cylindrical beads × 10 beads per package = 50 cylindrical beads. Using this information, the original ratio 6:3:3 is expanded times 16 since: 100/6 = 16 2/3, 50/3=16 2/3, 75/3=25, hence (6:3:3) × 16 = (16 × 6):(16 × 3):(16 × 3) = 96:48:48
Given that Ayala has 5 packages of each type of beads, any further expansion (above 16) will produce a ratio above some number of unavailable beads, therefore the maximum number of beads in a necklace with this ratio (expanded by 16) will be 96 spherical beads + 48 cubic beads + 48 cylindrical beads = 192 beads. Another possible solution is that she could make four necklaces as follows: 6:3:3, 12:6:6, 18:9:9, 60:30:30, for a total 192 beads. Another valid solution would be to give all the possible necklace combinations possible, up to the maximum length: 6:3:3, 12:6:6, 18:9:9, 24:12:12, 30:15:15, 36:18:18, 42:21:21, 48:24:24, .... 96:48:48, total 16 different necklaces. 110
GROUP 2: RATE ACTIVITIES
Activity 2.3:
Beads, Beads, Beads
Extended Activity Worksheet Didactic Comments and Explanations
1. Write equations for each type of bead (spherical, cubic, and cylindrical) connecting the price (m) to the number (n) of the beads. Note that there are two possibilities: purchasing whole packages, and purchasing individual beads. 2. Draw graphs for each type of bead (spherical, cubic, and cylindrical) illustrating the cost for different numbers of beads. Prepare a table describing the data illustrated in the graphs, and find patterns describing how the price rises as the number of beads increases. The amount can be of individual or of packaged beads. 3. How is the cost of an individual bead (for each particular type) represented in the graphs prepared in B? 4. Explain how the tables and graphs illustrate the patterns that you discovered. Note Questions 1-4, above, expand on the topic of graphs, linear equations and the significance of the slope of the straight line (see the discussion in activity 2.1: Who is Correct? above) Questions 5-10, below, can be used to further class discussion or for homework assignments. 1. What is the average cost of a bead in Ayala’s necklace? 2. Does the ratio between the types of beads determine the cost of the necklace? Explain your answer. 3. Which type of bead is the most expensive? Which is the least expensive? 4. What would be the cost of a necklace built in a 2:1:1 patterns (spherical: cubic: cylindrical) that had a total of 108 beads? 5. Design a necklace with a different pattern but that would cost the same as Ayala’s necklace. How many different designs are possible? 6. Design another necklace with a different ratio of beads, e.g. 3:2:1, and calculate its price.
The cost of the necklace (if she buys all the beads in packages) is $84. This amount will allow many possible combinations of beads (expansion to the topic of combinatory), starting with buying only one type of bead (e.g., 7 packages of either the spherical beads or cubic), or buying two types of beads (e.g. one package of spherical beads and 9 packages of cylindrical beads), etc. The number of possibilities is very large. Alternatively, it is possible to retain the original 108 beads in the necklace, but to make new necklaces merely by changing the places of the beads in the 6:3:3 pattern (each pattern then repeats itself nine times, to arrive at 108 beads). In this 111
CHAPTER 9
case, 18,480 different variations in the basic pattern are possible! This is calculated as follows: 12! = 18,480 possibilities. 6!3!3!
112
GROUP 2: RATE ACTIVITIES
Activity 2.4:
At the Dairy and Bianca the Cow Worksheet
Description Some children in grade 6 went on a field trip to visit a dairy and learn about cows, milk, and cheese. Here are some activities based on their visit. Part 1: At the dairy
The dairy produces, among other things, both cottage cheese and cheddar cheese. The dairy manager is proud of his products and tells his young guests all about making cheese. To make 100 kg of cheddar cheese, 1000 liters of milk are needed, but to produce 100 kg of cottage cheese, only 700 liters of milk are needed. 1) Prepare a table or graph showing the amount of cheddar cheese produced according to the quantity of milk. The x-axis will be the quantity of milk in liters, in steps of 100 from 100 to 1000 liters (100, 200, 300, etc). The y-axis will give the amount of cheddar cheese produced, at steps of 10 kg (10, 20, 30, etc.) 2) Find the mathematical “rule” that relates the amount of milk (M) to the amount of cheddar cheese produced (C), and use it to write an appropriate equation. 3) Prepare a similar table or graph as in 1) for the production of milk (M) vs. cottage cheese (k). 4) Find the mathematical “rule” that relates the amount of milk (M) to the amount of cottage cheese produced (k), and use it to write an appropriate equation. 5) Compare the two tables/graphs and the mathematical rules/equations derived there from. 6) How much milk is needed to produce a 250-gram container of cottage cheese?
113
CHAPTER 9
Part 2:
Bianca the Cow
The children studied a news article that had just been published about one of the cows on the farm. Bianca the cow is a record-holder in milk production in Israel. Over her twenty years, during which she gave birth to 15 calves, Bianca produced 174,128 liters of milk, more than any other cow in Israel. At present, Bianca is about to have her 16th calf. ‘Over the last few years, her milk production quantity has decreased substantially,’ says Dotan, the dairy manager. ‘But we still keep her on, in honor of her past exceptional productivity. From figures released yesterday by the Cattle Growers Association, Israel is in the number one spot for average milk production per cow annually, at 10,500 liters per year. In second place is the American cow, at 9,500 liters, and in third place is the West-European cow, with an average output of 7,500 liters of milk per year. Even among the cows in Israel, one stands out: the most prolific cow in 2002, Shallot, produced 17,749 liters of milk. Despite these optimistic figures, the Israeli dairy industry finds itself in a crisis situation. ‘The government must stop the erosion in the price of milk,’ says the president of the Cattle Growers Association. ‘It must rehabilitate the industry that used to be the leading farming industry in the country. (Ma’ariv, March 10, 2004). 1) How many kilograms of cottage cheese could be made from all the milk produced by Bianca? 2) A half-liter of milk will fill 2 cups. How many cups of milk would be filled by Bianca’s yearly production? 3) What is the ratio between Israeli milk productions to American? To WestEuropean one? Use the data presented in the news article. What can be learned from this data? Explain your answers. 114
GROUP 2: RATE ACTIVITIES
Activity 2.4:
At the Dairy and Bianca the Cow
Didactic Comments and Explanations Theme/Subject matter: Ratio rate problems; using ratio and proportion to find quantities. Concepts: Ratio, rate, proportion; comparing ratios, expanding and reducing ratios, tables, graphs, mathematical rules. Purpose of activity: Reinforcement of understanding of concept of rate and concept of proportion. Connectivity to other topics: Tables, graphs, units of measurement, mathematical rules. Comments and explanations for tasks Because this activity is presented as an extra activity, no solutions or explanations are provided. This activity gives an opportunity to study both rate problems, and proportion. The activity demonstrates how authentic articles from the press can be used to stimulate studies in mathematics.
115
CHAPTER 9
Activity 2.5:
How Many Beans in the Bag? Worksheet
Description A hands-on activity using real beans. Materials: For each group of 3-4 participants: a brown paper bag (or other opaque container) containing ½ kg of white beans; one cup of brown beans. Activities: 1) Gathering the data. a) Remove 100 white beans from the bag and replace them with 100 brown beans. Mix the bag well. b) Sample 1: Remove a sample of 25 beans. Count how many brown beans are in the sample, and write the number in the table below in the column for Sample 1. Return all the beans to the bag and mix well. c) Sample 2: Remove a new sample of 50 beans and count the number of brown beans. Write this answer in the column for Sample 2. Return all the beans to the bag and mix well. d) Samples 3 and 4: Repeat the procedure, each time increasing the sample by 25 beans, counting the number of brown beans, and writing the results in the appropriate space. Sample 1
Sample 2
Sample 3
Sample 4
25
50
75
100
No. of brown beans No. of beans in sample
2.
116
Estimating the number of beans in the bag.
GROUP 2: RATE ACTIVITIES
a) Investigate and analyze the finding that were gathered about the number of brown beans in the sample in order to estimate the total number of beans in the bag. Use the following table and fill in your estimates. Based on Sample 1
Based on Sample 2
Based on Sample 3
Based on Sample 4
Estimated number of beans in the bag
b) Discuss your finding with your group and decide on a representative estimate for the total number of beans in the bag. What reasoning did you use to determine your answer? c) It may be assumed that such a method may lead to errors in estimation. What are the reasons for these errors and how can they be avoided? Explain your answer. d) How can the estimation be improved so that the results will be closer to the actual number? Explain your answer. 3) Suggest a plan to count the number of deer in a nature reserve and give the pros and cons of your plan. Explain your answer in detail.
117
CHAPTER 9
Activity 2.5:
How Many Beans in the Bag?
Didactic Comments and Explanations Theme/Subject matter: Ratio representing density. Concepts: Estimation, density, ratios, proportions. Purpose of activity: To expand the concept of rate to include the use of density as a tool for estimating total number of items (deer, people, beans, etc.) in a given space (area, bag, etc.). The concept “population density” is defined as a ratio between the number of items in an area or volume. In this activity, the idea of “density” is explored and is expressed as number of items per unit area or volume. Connectivity to other topics: Estimation in geography, specific density, averages and weighted averages. Comments and explanations for tasks 1) Gathering the data. Make sure that the bag or container is opaque so that the students pick the sample without bias. The bag should be shaken well so that the brown beans are evenly dispersed throughout the sample of white beans. 2)
Estimating the number of beans in the bag.
a) Investigate and analyze the finding that was gathered about the number of brown beans in the sample in order to estimate the total number of beans in the bag. Use the following table and fill in your estimates. Based on Sample 1
Based on Sample 2
Based on Sample 3
Based on Sample 4
Estimated number of beans in the bag
Explain that 100 brown beans were introduced into the bag, giving a ratio of 100 brown beans to the total number (unknown) of beans in the bag. For example, if in sample 1 there are 5 brown beans in a sample of 25 beans, then it is possible to extrapolate the ratio between the total numbers of each as follows: 5 100 = 25 x
x=
25 × 100 = 500 5
Thus, it is possible to estimate the total number of beans in the bag, in our case, 500 beans. Of course, it is not necessary to use “x” (an algebraic equation) and any method suitable to the understanding of children in elementary school is acceptable. It is enough to know that the brown beans are one fifth of the sample in order to 118
GROUP 2: RATE ACTIVITIES
conclude that in the bag there will be a total number of white beans that is 5 times the 100 brown beans. Generally speaking, this topic is covered in elementary school in grades five and six, using verbal problems that practice finding the part from the whole and the whole from the part. It is probable that different samples will give different estimates, even ones that are quite distant from the actual ratio. b) Discuss your finding with your group and decide on a representative estimate for the total number of beans in the bag. What reasoning did you use to determine your answer? It is preferable to allow the entire group to discuss the method by which the estimate was determined. As was pointed out in the previous paragraph, it is almost certain that different results, even widely different, were obtained in each sample, leading to quite a wide span of estimations. During the class discussion, encourage ideas and suggestions for finding the requested estimate. Following are some suggestions (some of which were obtained from our field studies with pre-service teachers)
- Estimation based totally on intuition. - A range of results—the range may be based on the group’s results of the four samples, or alternatively, based on the results for all the groups. Another possibility is to decide on a range based only on one sample: in this case, the range obtained using the fourth sample from all the groups would probably give the most accurate result. - Simple average—a direct average of the results obtained in any group of all the four samples, or a direct average of all the results reported in all the groups. Another possibility is to calculate the average of one of the samples, in our case, sample 4, or the average of 2 samples, e.g. only samples 3 and 4. - Weighted average – in this case, calculations could be made giving importance to the size of the sample: Sample 1 has a weight of 1, Sample 2 has a weight of 2, Sample 3 has a weight of 3, Sample 4 has a weight of 4. Say the initial averages calculated for the numbers of white beans in the samples are as follows: Sample No. 1 2 3 4 Average no. of 5 8.6 13.4 18.2 brown beans in sample No. of beans in 25 50 75 100 samples Estimated no. 500 580 560 550 of beans in the bag 119
CHAPTER 9
Then the weighted average is calculated as follows: 500 × 1 + 580 × 2 + 560 × 3 + 550 × 4 = 559 , 10
or 559 white beans in the bag. If we would calculate the average without weighting the results, our results would be as follows: 500 + 580 + 560 + 550 2190 = = 547.5 , 4 4
that is the estimate would be of 548 white beans in the bag. Discuss which estimate is more trustworthy. Elicit convincing reasons from the pre-service teachers for their opinion. c) It may be assumed that such a method may lead to errors in estimation. What are the reasons for these errors and how can they be avoided? Explain your answer. Errors may arise for the following reasons: - inaccurate counting of the sample - inaccurate mixing of the brown beans in the bag - faulty calculations - most generally, from the size of the sample. The larger the sample, the more accurately it represents the actual situation. d) How can the estimation be improved so that the results will be closer to the actual number? Explain your answer. The larger the individual samples and the larger the number of samples, the better the estimate will be. It is almost certain that other ideas will be suggested. For example, one suggestion was to find the weight of 100 beans from the bag, to weigh the bag, and to use ratio to determine the amount of beans in the bag. 3) Suggest a plan to count the number of deer in a nature reserve and give the pros and cons of your plan. Explain your answer in detail. This problem is analogous to the problem of the number of beans in a bag. A number of deer are caught as a sample; they are tagged, and then released back into the nature reserve. After a few days, another sample is caught, and the number of tagged deer among them is counted. The ratio between the numbers of tagged deer to the total caught can give an estimate to the total number of deer in the reserve.
120
GROUP 2: RATE ACTIVITIES
Activity 2.6: Counting a Crowd Worksheet
Description Journalists like to estimate the number of people who participate in demonstrations, parades and festivals. Here, a demonstration gives an opportunity to investigate crowd estimation methods using ratio. Part 1 During the TV evening news, a report was made about a political demonstration. The TV reporter stood within the crowd and told the audience: “The town square is full of demonstrators. At least 200,000 people are here and in the adjacent streets.” At the same time, the radio reported: “Police announce that there are about 100,000 people at the demonstration. No disturbances have been reported.” Discuss the following points: 1) Why are there significant differences between the two reports regarding the estimate of the number of people in the crowd, despite that both reporters are reporting from the same place? 2) In your opinion, how do reporters estimate the number of people in a crowd? 3) Suggest a method by which the reporters can get a better estimate of the number of people in a crowd; use Stage 2, below, to help you. Part 2 Sometimes the size of a crowd is estimated from aerial photographs. Imagine that the illustration at the right is an aerial photograph of a crowd at a demonstration. Each dot represents one person. Estimate how many people are present. Explain the method you used to arrive at your answer.
121
CHAPTER 9
Activity 2.6: Counting a Crowd Didactic Comments and Explanations Note: While this activity is primarily concerned with density, proportion is also discussed. Theme/Subject matter: Using density ratios to estimate quantities, proportion. Concepts: Estimates, density, ratio, proportion. Purpose of activity: To use the concept of ratio as density to estimate the total number of individuals or items (deer, people, beans, etc.) in a given space (area, volume). Connectivity to other topics: Estimation in geography, area. Comments and explanations for tasks The concept of “population density” is defined as the ratio between the number of items and the area or volume that they occupy. The concept of “density” represents the number of items per unit area or volume. 1) Why are there significant differences between the two reports regarding the estimate of the number of people in the crowd, despite that both reporters are reporting from the same place? 2) In your opinion, how do reporters estimate the number of people in a crowd? Direct a discussion that will lead the participants to understand that besides intuitive estimation, which is highly inaccurate, various mathematical methods can be used to arrive at a more accurate estimate. 3) Suggest a method by which the reporters can get a better estimate of the number of people in a crowd; use Stage 2, below, to help you. One of the methods to estimate the number of people in a crowd is as follows: i) Experimental stage: Define and mark an area of known dimensions. Count all the objects in that area; ii) Mathematical stage: Calculate the ratio between the marked area and the total area, and then calculate the corresponding ratio between the number of objects in the marked area, and the total area. This proportion is a “direct ratio.” That is to say, the ratio between the marked area and the total area is equal to the sample number and the total number of items. This proportion allows estimation of the number of people in a crowd. This problem can be easily modified for school children. The children will be eager to count the dots in a given area, e.g. 1 cm square, and then find the area of the given square, to make a good estimate of the total number of dots in the picture. Following this, discuss with the students if this is a useful method for estimating the number of people in a crowd. 122
GROUP 2: RATE ACTIVITIES
For extra practice, the following analogous problem can be given: A fish pool is 750 square meters. The swimming fish are very difficult to count. Find a way to estimate the number of fish in the pool. The method is similar to the one above. A diver marks off an area of 100 square meters in a pool and counts the fish that he sees in that area. The ratio 100/750 is the ratio between the number of fish in the area and the total number of fish in the pool. Note: A different method of estimating the number of objects can be found in the problem: How Many Beans in the Bag? above.
123
CHAPTER 10
GROUP 3:
RATIO ACTIVITIES
Activity 3.1: Which Cola is Best? Activity 3.2: Pizza Party Activity 3.3: Everyone Solves it Differently Activity 3.4: What’s in the Rust? Activity 3.5: Dividing Profits Between Partners
125
CHAPTER 10
Activity 3.1: Which Cola is Best? Worksheet
Description Everyone is familiar with the taste-test survey. Here we investigate the results of a cola taste test.
The following results pertain to taste test surveys comparing Bola-Cola to ColaNola:
1) The ratio of those who preferred Bola-Cola to Cola-Nola was 3 to 2. 2) 17,139 people preferred Bola-Cola, whereas 11,426 preferred ColaNola. 3) 5,713 participants preferred Bola-Cola over Cola-Nola.
Tasks 1) Are all three statements necessarily related to the same taste test survey? 2) Which statement most accurately describes the results of the Bola-Cola/Cola-Nola taste test survey? Explain. 3) If you were to make an advertisement for BolaCola, which statement do you think would be the most effective to use? Why? 4) Suggest other ways to compare the popularity of the two colas.
126
AUTHENTIC ACTIVITIES—GROUP 3: RATIO
Activity 3.1: Which Cola is Best? Didactic Comments and Explanations Theme/Subject matter: Ratio activity. Concepts: Ratios, differences, fractions, percentages. Purpose of activity: An introductory activity to introduce the concept of “ratio.” To increase awareness of how ratio can be used to analyze surveys. To study mathematical methods for finding ratios, comparing ratios, and using the properties of ratios (specifically: expansion/reduction by multiplying/dividing the numerator and denominator by the same factor). Connectivity to other topics: Percentages, simple fractions, decimals. Comments and explanations for tasks 1) Are all three statements necessarily related to the same taste test survey? In the first statement, the ratio between the number of people who preferred BolaCola to Cola-Nola is given as a fraction: 3/2 (three halves, which are actually one and a half). In the second statement, a ratio of 17,139/11,426 is given, which is equal to 3/2 (expansion by 5,713). That is, once the ratio between those who preferred Bola-Cola to Cola-Nola was found, both the numerator and denominator were divided by 5,713, to yield 3/2, or in other words, the fraction was reduced to its lowest form, which is the same as statement 1. However, it is important to point out to the students that even though statements 1. and 2. could be from the same survey, it is not necessarily true. Statement 1 might have been derived from a survey with a different number of participants. In fact, although statement 2. (17,139/11,426) gives us the same ratio, it is not certain that these numbers refer to the absolute number of people who took part in the survey; these values could be the result of expansion or reduction of the original numbers obtained. The information in statement 3, however, actually describes the difference between the numerator and the denominator (17,139 - 11,426), leading to the conclusion that, indeed, all three statements are from the same taste test survey. The given ratio is 3:2, and the difference is 5,713. In other words, one part (3-2) is 5,713, and therefore the number of people who took part in the survey can be accurately determined: The number who preferred Bola-Cola is 3 × 5,713 = 17,139 The number who preferred Coal-Nola is 2 × 5,713 = 11,426 The total number of participants is 5 × 5,713 = 28,565
For practice, at least one additional question of this type should be given, such as the following: The ratio between the number of members in two groups is 5:2, and the difference between the groups is 3,900. How many members are there in each group?
127
CHAPTER 10
Solution: 3,900 is the difference between the values of the ratio of 5:2, meaning it represents 3 units (out of 7). A unit is thus 3,900:3 = 1300. The total number of people is (7 × 1300) = 9,100. In the first group there are (5 × 1300) = 6,500 people, and in the second, (2 × 1300) 2,600. This activity can be easily adapted for elementary school children if the size of the numbers chosen is in keeping with their ability. 2) Which statement most accurately describes the results of the BolaCola/Cola-Nola taste test survey? Explain. Following the explanations given for question 1., above, it is obvious that there is no definitive answer to this question. Usually, most choose the second statement, without noticing that 1. and 2. are actually identical. Statement 1. states that for every three people that prefer Bola-Cola, 2 prefer Cola-Nola. But statement 2. has an identical meaning, except that the numbers are much larger. Because of the size and “uniqueness” of the values given in statement 2. the impression is given that these are the actual number of participants in the survey. However, this is not absolutely certain, even though in this case it turns out to be true, given the information given in statement 3. Note that while statements 1 and 2 can each make a reliable, and independent, statement regarding the preferences of the participants for the two colas, statement 3 cannot be a fact that stands on its own. Because it gives quantitative difference between two numbers, neither the ratio, nor the number of participants in the survey, can be known, only that 5,713 more people preferred Bola-Cola. Such a difference could be the result of an infinite number of ratios, e.g. 1:5,714; 2:5,715; 3:5,716; 4:5,717; ... 11,426:17,139; ... 1,000,000:1,005,713 ... and so on. The significance of the difference changes from extremely significant in the first case (1:5,714), to barely significant in the case of an extremely large sample (e.g. 1,000,000:1,005,713). 3) If you were to make an advertisement for Bola-Cola, which statement do you think would be the most effective to use? Why? Discuss in class how decisions are made daily based or mathematical comparisons. However, when an advertisement is prepared for the newspaper, psychological elements are taken into account, which do not always reflect mathematical accuracy. For example, the first statement, where the ratio given is 3:2, does not say how many people in fact took part in the taste test, but does immediately give the impression of a comparison: for every 5 people tested, 3 preferred Bola-Cola. The third statement, despite giving the difference in numbers, also does not reveal how many people took part in the taste test. Without having an absolute number to refer to, the result is meaningless. If 6,000 people took part in the survey, the difference is very significant; if 1,000,000 took part, it is not significant at all. As far as the advertisement is concerned, the following should be discussed: a) The most accurate way of reporting the results is obviously the precise number (11,426:17,139). This gives the exact number of people who took part in 128
AUTHENTIC ACTIVITIES—GROUP 3: RATIO
the taste test. Psychologically, the impression given is that many more people preferred Bola-Cola over Cola-Nola. b) The most “mathematically effective” method is to give the ratio as 3:2, since the number is smaller, and easier to relate to. A value of 3:2 makes it is easy to predict results in the class or in another group, assuming that the ratio 3:2 will remain the standard. c) Larger numbers can give a better impression: the difference between 3:2 is only 1, but the difference between 17,139 and 11,426 is 5,713. In cases where additive reasoning thinking only is present, the large numbers have a greater “psychological effect.” 4) Suggest other ways to compare the popularity of the two colas. The figures can be presented in a number of ways: - Percentage: 60% of those surveyed preferred Bola-Cola over Cola-Nola. (For every 100 people, 60 preferred Bola-cola.) - Fractions: 3/5 of those surveyed liked Bola-Cola better; or, 0.6 of those surveyed liked Bola-Cola better. - Verbally: Three out of five people preferred Bola-Cola over Cola-Nola. Or, the ratio of people who prefer Bola-Cola to those who prefer Cola-Nola is 6 to 4, or 30 to 20. - Visually: An illustration of five people, of whom 3 are drinking Bola-Cola and 2 are drinking Cola-Nola. Points for discussion with pre-service teachers: - Encourage students to raise questions: What information is learned from each of the comparisons? What information is lost from each comparison? Is each comparison accurate on its own? Why or why not? - When working with pupils on these types of questions, keep track of the pupils who have difficulty understanding the connection between the various comparisons. - Summarize each type of comparison on the board (or on a transparency) showing what information is and is not obtained from it. - Discuss with them the importance of the magnitude of the difference, and if the magnitude alone determines the ratio. - In the problem given, the number 5,713 represents both the difference between the two quantities (17,139 and 11,426) and the multiplication factor of the 3:2 ratio. Why? Discussing this point expands the topic of simple fractions. However, what would happen if the ratio were 5:2? When the difference between the components of the ratio is 1, as is the case in the ratio 3:2, the difference between the quantities is exactly the same as the multiplication factor. Why is this so? What happens in the case where the difference between the components of a ratio is more than one? When the difference between the two ratio components is more than one, such as 5:2 (5-2=3), the multiplication factor is not equal to the difference; the difference is actually a multiple of the multiplication factor based on the reduced value of the ratio. In our example, if we expand the 5:2 ratio by a of 50, we get 250:100. The difference, 150, is 3 × 129
CHAPTER 10
50. In the case of 250:100, for example, the difference is 150, but the multiplication factor is only 50. However, the difference between the values is always the product of the difference between the ratio’s components times the multiplication factor. - The pupils will have varied opinions on what an effective ad could be. Ask them to explain their reasons for whatever approach they come up with.
130
AUTHENTIC ACTIVITIES—GROUP 3: RATIO
Activity 3.2: Pizza Party Worksheet Description Sharing pizzas becomes a lesson in ratios.
Every month a group of friends meet at a restaurant for a pizza party. Danny, as usual, is late. When he arrives there is one place available at each of the tables and he must choose which table to join: the one with 7 people and 3 pizzas (he will be the eighth) or the one with 9 people and 4 pizzas (he will be the tenth person at the table).
Figure 3.2: Tables at the Pizza Party
Tasks 1) Danny really likes pizza and he is popular and wouldn’t mind sitting with his friends at either of the tables. Where should he sit? Explain your reasoning for picking that table. 2) The ratio of large tables (with 10 seats) to small tables (with 8 seats) in the restaurant is 8 to 5, and there are exactly enough seats for 360 people. How many tables of each kind are in the restaurant? Explain your answer in detail.
131
CHAPTER 10
Activity 3.2: Pizza Party Didactic Comments and Explanations Theme/Subject matter: Ratio. Concepts: Ratio, proportion, percentages. Purpose of activity: To expand the concept of ratio to compare between two ratios, and using this comparison to find proportion, the part from the whole, and the whole from the part. To expand the range of strategies used to compare ratios and develop of proportional reasoning. Connectivity to other topics: Fractions, comparing simple fractions, reducing and expanding fraction, properties of ratios, percentages. Comments and explanations for tasks 1) Danny really likes pizza and he is popular and wouldn’t mind sitting with his friends at either of the tables. Where should he sit? Explain your reasoning for picking that table. At the beginning of the discussion, all possible answers should be accepted. These may include mathematical solutions arising from formal or non-formal proportional reasoning, and non-mathematical answers arising from affectiveemotional reasoning or from conclusions drawn from looking at the illustration. However, after this first phase, direct the discussion to one that is more mathematical and that uses proportional reasoning to analyze and solve the problem. Following are examples of the varied answers that may be received. Answers based on non-mathematical affective-emotional reasoning - Danny does not like one of the children at one of the tables. - Danny wishes to sit at the table with more/less friends; or with more/less pizzas. - The difference between the tables is very small, so there is no importance where he sits. Answers derived from looking at the illustration (non-mathematical) - Danny doesn’t want to sit at the head of the table since it seems that there one pizza is divided between three people, but in the middle of the table one pizza is divided between two people. There is room for Danny at either of the tables, so it doesn’t matter where he will sit, “it will be the same.” This answer was obtained from a college student, was misled by the visual illustration. Her reasoning was as follows: at the first table, where there is room for 8, the pizzas at the two ends of the table will be divided between 3 people each, and the one in the middle will be divided between 2 people. At the second table, the situation is similar, with the two end pizzas each to be divided between 3 people, and the two in the middle each between 2 people. If Danny sits at the end of any of the tables, he will receive 1/3 pizza, and if he sits in the middle of a table, he will receive ½ pizza. The amount of pizza he gets is the 132
AUTHENTIC ACTIVITIES—GROUP 3: RATIO
same at each table, and depends only on where he sits at each table. The reasoning of the student is a result of looking at the diagrams and assuming that the pizzas are divided amongst the people that are sitting close to them. Answers that are mathematical and derived from formal and informal proportional reasoning. (Students should be encouraged in this direction, but reminded that other reasoning might be used as a basis for answers.) - In general, mathematical reasoning is done by comparing the fractions representing the amount of pizzas and the number of people sitting at each table (at Table 1, the fraction is 3/7, and at Table 2, it is 4/9). These ratios allow the comparison of the amount of pizza each person gets. The students compared the ratios to decide at which table a person gets more pizza. However, in this case, they have not taken into account the fact that Danny will join one of the tables. In fact, this reasoning determines whether a child at one table receives a different amount than a child at the other table, if the pizzas are divided equally amongst the members of the table. - By adding Danny into the equation, the fractions to be compared become 4/10 and 3/7, and 4/9 and 3/8. In this case, some students claimed that it didn’t matter to Danny what the other children received to eat. Some students claimed the difference was so small that it made no difference where he sat. Answers using proportional reasoning The proper method is to compare between 4/10 and 3/8. In this case, if Danny does the correct calculations, he will know at which table to sit to get the most pizza.
Explore with the students the different answers that are obtained for all the fractions. In other words, when 4/9 > 3/7, will it also be true that 4/10 > 3/8? In this case, the answer is true. However, will it always be true? That is: if a/b > c/d, will a/(b+1) > c/(d+1)? As an example, the following can be given: 3/2 > 90/70, but 3/3 is not > 90/71. So this statement is not always true. Other methods for comparing fractions can be explored. 2) The ratio of large tables (with 10 seats) to small tables (with 8 seats) in the restaurant is 8 to 5, and there are exactly enough seats for 360 people. How many tables of each kind are in the restaurant? Explain your answer in detail. The answer is 24 large tables and 15 small. One way of finding the answer is to find the ratio of diners sitting around the large tables to those sitting around the small tables, which is 80:40 (10 × 8: 8 × 5). Since 360:120 = 3, we can derive that there will be 240 (80 × 3) people around the large tables and 120 (40 × 3) around the small tables. Therefore, the number of large tables will be 240:10 = 24, and the number of small tables 120:8 = 15. This question deals with two ratios concurrently: one the ratio between types of tables (8 large for each 5 small), and the other to the diners sitting around each table (10 to a large table and 8 to a small).
133
CHAPTER 10
Activity 3.3: Everyone Solves it Differently Worksheet Description A simple task is used to explore various proportional strategies.
The Problem Divide 40 nuts between two children in a ratio of 3:5. How many does each child receive?
Tasks
1) Use various methods to solve the problem. Use all the strategies that you know, including all the strategies that you think pupils in elementary or middle school would use to solve the problem. 2) In groups, discuss the various strategies, each one separately, and write down what characterizes it, for what age group it might be appropriate, and what difficulties might be observed during the solution of the problem using the strategy. 3) Summarize the advantages and disadvantages of each strategy.
134
AUTHENTIC ACTIVITIES—GROUP 3: RATIO
Activity 3.3: Everyone Solves it Differently Didactic Comments and Explanations Theme/Subject matter: Strategies for solving ratio and proportion problems. Concepts: Pre-formal strategies, formal strategies - proportional formula. Purpose of activity: To understand the various strategies and their characteristics, including i) pre-formal strategies (intuitive strategies, additive strategies, division by ratio, finding the unit using a corresponding table, finding the whole from the part, missing value problems); and ii) formal strategy using the proportional formula. Connectivity to other topics: Psychological-didactic perspectives on teaching the topic. Comments and explanations for tasks 1) Use various methods to solve the problem. Use all the strategies that you know, including all the strategies that you think pupils in elementary or middle school would use to solve the problem. After pre-service teachers have had a chance to explore a number of the activities given so far, this activity presents an excellent opportunity to discuss strategies and methods in class, using as wide a range of strategies that they can think of to solve ratio and proportion problems. It can also be the basis of a theoretical discussion on the development of proportional reasoning in children (see Chapter 5, Proportional Reasoning—A Psychological-Didactical View). 2) In groups, discuss the various strategies, each one separately, and write down what characterizes it, for what age group it might be appropriate, and what difficulties might be observed during the solution of the problem using the strategy. Working in groups, students can brainstorm the various strategies to solve the problems and then will examine each one in detail, as described above.. 3) Summarize the advantages and disadvantages of each strategy. Following this, there should be a class-wide discussion, in which the range of strategies is presented, divided into the 2 groups (pre-formal and formal/proportional formula) and the pros and cons of each are discussed. Following are some examples of strategies that might be used to solve ratio and proportion problems. The strategies were gathered during our field studies in various teaching institutions. Note the wide variety of strategies that were offered that led to the correct solution of the assignment. For each strategy a short explanation is offered with didactic comments regarding ways in which to present the activity to children depending on their age, difficulties that may arise, etc. Experience accumulated in the study showed that dealing with various strategies and connecting them to theory contributed much to enhancing and deepening the pre- and in-service teachers’ mathematical and psychological-didactic knowledge
135
CHAPTER 10
of the topic of ratio and proportion, and especially strengthened their readiness and enthusiasm for teaching the subject in school. Note: Students should be supplied with a copy of the various strategies. Examples of Various Strategies used to Solve Ratio and Proportion Problems A.
Pre-formal strategies i) Intuitive strategy. Students verbally guessed the number of nuts each child received and wrote them down: A: 15 nuts, B: 25 nuts, total: 40. Of course, this is the correct answer, but it is possible that other, incorrect, values were tried first, before arriving at the correct ones. This strategy is suitable for very simple problems and demonstrates intuitive awareness of proportional relationships. ii) Additive strategy. Two methods of solving the problem using additive strategy were used. The first was done as follows. Students took 8 nuts, and distributed them to two individuals, giving 3 to one, and 5 to the other. Then they took another 8, distributed them similarly, and continued until all 40 nuts were used. In our case, they could do this exactly 5 times. A table similar to the following can aid the process: Table 3.3a: Table Illustrating Additive Strategy
Group No. 1 2 3 4 5 Total
A 3 3 3 3 3 15
B 5 5 5 5 5 25
Total 8 8 8 8 8 40
Thus, A receives 15 (adding up all the groups for A), and B receives 25 (adding up the groups for B). The second method was done in a more visual manner: The students drew 40 circles, and filled in 3 (for A), and left 5 blank (for B), and repeated the process until they had used all the circles. (See diagram, below.)
136
AUTHENTIC ACTIVITIES—GROUP 3: RATIO
Figure 3.3: Visual Depiction of Additive Strategy
The two strategies above are characteristic of young students with additive reasoning skills only, and can be used to solve such problems. However, when the whole cannot be neatly divided into groups of whole numbers, or when the number is very large, finding the solution will prove difficult. Here is an example of a problem that proved somewhat problematic for such students.
Liora and Ayala have 20 licorice sticks, and want to divide them in a ratio of 4:8. How many does each get?
Using the methods described above, a neat solution is impossible, since the number of licorice sticks divided out at each stage (12) does not divide evenly into 20, and thus no whole, natural number can be obtained at the final stage. However, if fractions are introduced into the solution (licorice sticks can be cut up), the problem can be solved, even though not based on the above methods. iii) Division by ratio. Students divided the whole (40 nuts) into 5 groups of 8 nuts, as the ratio of the nuts that A got, to the nuts that B got is 3:5 (i.e., the ratio in the whole). That is, in each group, for every three that A received, B received 5. A received five groups of 3 nuts: 5 × 3 = 15 nuts. B received five groups of 5 nuts: 5 × 5 = 25 nuts. iv) Finding the unit (with/without a “corresponding table"). In this strategy students determined (even though it was not explicitly requested) the number of items in one unit of the whole. This unit was used for them to find the amount required for each one of the parts that they were to determine. The solution can be found with or without using a table. Without the table, the solution is found in stages. The “whole” is the 40 nuts. Students divided the whole into 8 (3+5) units, thus each unit had 5 (40:8) items. A receives 3 units out of the 8 3 × 5 = 15 nuts. B receives 5 units out of the 8 5 × 5 = 25 nuts.
Using a "corresponding table", the unit for each child was derived as follows: 137
CHAPTER 10
8 units ----------------- 40 nuts 1 unit ----------------- ? nuts In the whole, there are 8 (3+5) units, thus in each unit there are 5 nuts. Then, the number of nuts each child gets was often solved by using a corresponding table for each child, and substituting “5” as the unit: Table 3.3b: Solving the Problem by Finding the Unit
Child A 1 unit ------ 5 nuts 3 units ------ ? nuts A: 5 × 3 = 15 nuts
Child B 1 unit ------ 5 nuts 5 units ------ ? nuts B: 5 × 5=25 nuts
v) Determining the part from the whole. With this strategy, students used fractions to determine the requested amount: In the whole there are 8/8 (5+3), and there are 40 items, thus A receives 3/8 of the entire amount, 40 × 3/8 = 15 nuts. B receives 5/8 of the entire amount, 40 × 5/8 = 25 nuts. Of course, decimal fractions can also be used in a similar manner. vi) Using “missing value.” Here, students wrote down the following ratio, where A is symbolized by “x”, and B is symbolized by “40 - x.”
3 -----------------x 5 ------------ 40 - x By cross multiplication (since it is direct ratio), 5 × x = 3 (40 - x) x = 15 nuts, and 40 - x = 25 nuts. Here, the use of the missing variable technique is an extension of finding the unit using a corresponding table. Mistakes and difficulties will be exhibited when students find themselves dealing with problems involving indirect ratios, where using the strategy and techniques appropriate for direct ratios is incorrect. Note: Children in elementary school will solve problems with algebraic equations using other strategies, since the algebraic technique is usually not studied before middle school. B. Formal strategy – The proportion formula This strategy is appropriate for those with proportional reasoning skills (see Chapter 5, Proportional Reasoning—A Psychological-Didactical View). Such individuals are able to make intelligent use of the proportional scheme and can 138
AUTHENTIC ACTIVITIES—GROUP 3: RATIO
solve ratio and proportion problems using the proportional formula. To solve the problem with the proportional formula: x = the number of nuts for A 40 - x = the number of nuts for B Since the ratio of nuts for A to B is 3:5, a proportional relationship is present, which can be expressed as follows: 3/5 = x / (40 - x). This equation can be easily solved algebraically: 5x = 3(40 - x) 8x = 120 x = 15. Thus A receives 15 nuts, and B receives (40 - x) = 25 nuts. This strategy is generally limited to adolescents and adults, who are at the formal thinking stage. However, results of studies show that some adolescents and adults have difficulty solving problems using the proportional formula. These findings reinforce the claim that exposing students to wide-ranging examples can stimulate the potential proportional scheme and make it an actual scheme that can be put to use. Exposing pre-service teachers to a wide range of strategies and discussing the characteristics, not only develops their pedagogic expertise but also gives them a positive attitude to their ability to teach the topic.
139
CHAPTER 10
Activity 3.4: What’s in Rust? Worksheet
Description A chemist checked the components of rust and found that it is made up merely of iron and oxygen. Following tests made on a number of samples, the following data were obtained. Table 3.4: Components in Rust
Weight of Rust Sample (grams) 50 100 135 150
Weight of Iron in Sample (grams) 35 70 94.5 105
Weight of Oxygen in Sample (grams) 15 30 40.5 45
Tasks 1) If the chemist analyzes a 400-gram sample, how many grams of iron and oxygen should she expect to find? Explain you answer in detail. 2) Is the ratio between the weights of the iron to oxygen constant? If so, what is the ratio? Explain your answer. 3) How can the ratio be used to find the amount of iron and oxygen in 500 grams of rust? In 1 kg? Explain your answer in detail. 4) Suggest a general method to find the amount of iron and oxygen in any sample of rust, without having to analyze the rust.
140
AUTHENTIC ACTIVITIES—GROUP 3: RATIO
Activity 3.4: What’s in Rust? Didactic Comments and Explanations Theme/Subject matter: Ratio type activity. Concepts: Finding ratios, using ratios to find quantities, expansion and reduction of ratios, comparison of ratios. Purpose of activity: To deepen the understanding of the concept of ratio in preparation to learning the concept of proportion. Connectivity to other topics: Fractions—comparing simple fractions, expansion and reduction of fractions, the fraction as an operator-part of.
Because this activity is presented as an extra activity, no solutions or didactic comments or explanations are provided. It is given in preparation to learning the topic of “proportion.”
141
CHAPTER 10
Activity 3.5: Dividing Profits between Partners Worksheet Description Efforts invested are efforts rewarded, and profits must be divided accordingly.
1) How should the profits be split between the partners? Explain the strategy and reasoning. 2) How should the profits be split in the third year? The sixth? Explain your strategy and your reasoning. 3) How many years until the partners earn back their initial investment?
142
AUTHENTIC ACTIVITIES—GROUP 3: RATIO
Activity 3.5: Dividing Profits between Partners Didactic Comments and Explanations Theme/Subject matter: Using ratio to divide profits between investment partners. Concepts: Ratio, direct ratio. Purpose of activity: To deepen the understanding of the concept of “ratio”; to compare different solution strategies. Connectivity to other topics: Fractions—the fraction as an operator, arithmetic series. Comments and explanations for tasks 1) How should the profits be split between the partners? Explain the strategy and reasoning. This problem is an additional “ratio” type of activity and demonstrates the use of ratio when dividing profits. In this case, the ratio is direct: the one who invests more will receive more of the profits, in accordance (proportional) with his investment. This part of the activity, gives an opportunity for the pre-service teachers to suggest strategies for determining how the profits should be divided. From experience during research, teachers will give a wide range of strategies, which can be used as a basis for a discussion of each and to expand their mathematical and psychological-didactic knowledge of the topic (see Chapter 5, Proportional Reasoning—A Psychological-Didactical View).
The second part expands the activity to introduce the concept of finding terms and sums of mathematical series, which is also relevant to the division of profits according to a given ratio. 2) How should the profits be split in the third year? In the sixth year? Explain your strategy and your reasoning. 3) How many years until the partners earn back their initial investment? For 2), the profits in the third and sixth years must be determined and then divided according to the ratio of the investments. For 3, the number of years that it takes to earn back the initial investment (of $100,000) must be determined. For both an arithmetic series must be derived using a1 = 5,500, and d = 2,000. The third and sixth terms in the series will provide the answer for 2. The answer for 3 will be n, when the sum, Sn, for the mathematical terms in the series is equal to the investment (n represents the number of years). Obviously, a problem requiring finding the terms in a sequence, or the sum of a series such as this one, is not appropriate for elementary school. Note: It is important to point out that the profits will always be divided according to the same ratio, no matter how many years pass.
143
CHAPTER 11
GROUP 4: STRETCHING AND SHRINKING: SCALING ACTIVITIES Activity 4.1: Wimpy in Wonderland Activity 4.2: The Beth-Shean Temple Activity 4.3: What’s the Real Size? Activity 4.4: The Puzzle Activity 4.5: The Thief, the Teacher and How They Connect Activity 4.6: The Giant Slayer Activity 4.7: The Reduction Triangle
145
CHAPTER 11
Activity 4.1: Wimpy in Wonderland Worksheet
Figure 4.1: Wimpy in Wonderland
146
AUTHENTIC ACTIVITIES—GROUP 4: SCALING
Activity 4.1: Wimpy in Wonderland Description Wimpy visits the Hall of Mirrors in an amusement park and can’t stop laughing. Every mirror shows a different image. Tasks 1) Explain what has happened in each mirror. Derive a mathematical rule/formula for each one. 2) Examine the area and perimeter of Wimpy’s nose in each one of the mirrors. Can the mathematical rules derived in question1 be applied here, too? Why or why not? 3) Create another mirror, give the mathematical formula for its reflection, and draw how Wimpy will appear. 4) What is the enlargement factor if Wimpy is first enlarged by 2, and then the result is enlarged by 3? 5) Wimpy was so enchanted by the mirrors that he offered to help the manager advertise the amusement park. They decided to make some posters. On his computer, Wimpy made an 8.5 cm × 11 cm mock-up for the poster. At the printing house enlargements of 25%, 30%, 35%, 40%, all the way up to 200% are available. 6) Calculate if posters can be printed in the following dimensions. If the answer is “yes,” explain how the enlargement is made; if “no,” suggest how the measurements can be changed to make the dimensions possible. a) 21.25 × 27.5 cm b) 25.5 × 24.75 cm c) 42.5 × 55 cm) d) Create an additional poster that can be produced in the printing house.
147
CHAPTER 11
Activity 4.1: Wimpy in Wonderland Didactic Comments and Explanations Theme/Subject matter: Ratio in scaling. Concepts: Stretching and shrinking factors, quadratic ratios, areas, stretching and shrinking times a factor, stretching and shrinking by adding or subtracting a quantity. Purpose of activity: To deepen the understanding of the concept of scaling and the use of scale. Connectivity to other topics: Percentages, fractions, measurements, area, perimeter. Comments and explanations for tasks 1) Explain what has happened in each mirror. Derive a mathematical rule/formula for each one. Here, the amount of enlargement/reduction for each image must be calculated. Point out the original Wimpy. The rest of the illustrations are reflections. Distortions arise when the enlargement/reduction factor of the widths and lengths of the images are not the same. A consistent ratio is seen in mirror no. 1 (which enlarges by a factor of 2 in each dimension), mirror no. 3 (by 3), and mirror no. 5 (reduces by a factor of 2 in each dimension). Mirror no. 4 enlarges the length only (times 3), giving a long, narrow image. Such a mirror can, incidentally, be “useful” in a clothing store, where customers will see themselves taller and slimmer; giving a favorable impression of the outfit they are trying on. In contrast, mirror no. 2 enlarges the width only (times 3), yielding a short, wide image. Pre-service teachers should express the mathematical rules by way of a linear function. The function for length will be: yl = axl, using a = enlargement factor for length; xl = original length; yl = final length. By the same process, the function for width will be: yw = bxw, using b = enlargement factor for width, xw = original width; yw = final width. Note Ensure that the pre-service teachers use the enlargement/reduction factors properly, and not in any way that might be based on additive reasoning. During class discussion, point out difficulties that elementary-school pupils (with additive reasoning) may have with the problem, and the importance of having them use multiplicative reasoning. Pre-service teachers can be given the article by Lamon (Lamon, 1994) to read (for homework), which discusses how pupils using preformal, additive strategies arrive, in most cases, at the wrong solution. 2) Examine the area and perimeter of Wimpy’s nose in each one of the mirrors. Can the mathematical rules derived in question one be applied here, too? Why or why not? This task examines the shrinking/stretching in both the first degree—finding the perimeter, and in the second degree—finding the area. (Third degree stretching, volume, will be discussed in "The Beth-Shean Temple" activity, below.) 148
AUTHENTIC ACTIVITIES—GROUP 4: SCALING
Finding perimeter is a first-degree, linear procedure—adding up twice the width and twice the length: P = 2 (a + b). In this case, the shape is a rectangle and should not present any problem for pre-service teachers. On the other hand, determining area is a 2-dimensional, quadratic procedure, which involves multiplying the width and the length (area = width × length). Dealing with two-dimensional concepts can present difficulties, as shown by the following examples: a) In mirror no. 3, where the enlargement factor for both the width and the length is 3, the enlargement factor for the area will be 9. That is, the area will be enlarged by the square of the linear factor. b) For mirror no. 4, the enlargement factor of the length is 3, which is different from the enlargement factor of the width, 1(i.e., there is no change). The enlargement factor for the area is 3, which is the product of the factors for the length and width (3 × 1). Dealing with three-dimensional, cubic (i.e. volume) concepts are even more difficult, as will be seen in another activity. Discuss the differences between linear, quadratic, and third-degree (cubic) stretching/shrinking, so that the pre-service teachers become familiar with the concepts, and can formulate ways to teach the subject in elementary school. 3) Create another mirror, give the mathematical formula for its reflection, and draw how Wimpy will appear. This task checks the participants’ grasp of the scaling and stretching/shrinking principles involved. If any difficulty is encountered, geoboard (or dot paper) should be used. 4) What is the enlargement factor if Wimpy is first enlarged by 2, and then the result is enlarged by 3? The enlargement factor is 6, which is the product of the first enlargement factor (2) and the second (3). Thus the final image will be 6 (3 × 2) times the initial image. 5) Wimpy was so enchanted by the mirrors that he offered to help the manager advertise the amusement park. They decided to make some posters. On his computer, Wimpy made an 8.5 cm × 11 cm mock-up for the poster. At the printing house, enlargements of 25%, 30%, 35%, 40%, all the way up to 200% are available. 6) Calculate if posters can be printed in the following dimensions. If the answer is “yes,” explain how the enlargement is made; if “no,” suggest how the measurements can be changed to make the dimensions possible. a) 21.25 × 27.5 cm b) 25.5 × 24.75 cm c) 42.5 × 55 cm d) Create an additional poster that can be produced in the printing house.
149
CHAPTER 11
The correct solutions for this question require multiple stretching and/or shrinking, similar to question 4, above. Often more than one solution pathway is possible, and this should be explored. For example, in the case of c), the picture is enlarged by a factor of 5 (or by 400%). Since the maximum enlargement possible at any one time is 200%, the process requires more than one step. A number of ways are possible. One is to use two stages: The first is to double the size (i.e. to increase by 100%), and then to enlarge the result by a factor of 2.5 (i.e. by 150%). The difficulty of the exercise depends on the number of stages required. A second possibility is to use three stages, that is 1.25 × 2 × 2 = 5, that is first enlarge the picture by 25%, then double it (increase by 100%), and then double it again (another 100% increase). Having multiple stages increases the difficulty of the question. In d), the students should be encouraged to discover enlargements that are even more complicated to derive. During the class discussion, point out the importance of the way that the enlargement is expressed: “by a factor” implies multiplicative thinking and proportional reasoning; “by a quantity” implies additive thinking. Adapting the activity for elementary-school use: This activity can easily be adapted for elementary school children. They may be particularly entranced by the third task, where they can distort Wimpy to their desire. Exploiting this natural interest and curiosity is an ideal way to enhance their learning of the concept. Various variations of the problem can be conceived to pique their curiosity.
150
AUTHENTIC ACTIVITIES—GROUP 4: SCALING
Activity 4.2: The Beth-Shean Temple Worksheet Description Using actual details from an archeological site in Israel, presents an authentic and fascinating method of learning about scaling in two and three dimensions. Below is a schematic drawing (sketch) of the restoration of the Beth-Shean Temple2. The drawing is at a scale of 1: 200, which means that the drawing is 200 times smaller than actual size.
Figure 4.2 Plan of the temple in Strata VII
Tasks 1) What are the actual dimensions of the temple hall? 2) What is the ratio between the perimeter of the hall in the drawing and the actual perimeter? How is this ratio related to the given scale? 3) What is the ratio between the perimeter of the temple hall and the perimeter of your classroom? –––––––––––––– 2
The drawing is from The New encyclopedia of archaeological excavations in the Holy Land (1993), Vol. 1, pp. 214-235.
151
CHAPTER 11
4) What is the ratio between the area of the temple hall in the drawing and the area of the actual hall? 5) One of the rooms of the temple is a rectangular shape with an actual area of 150 square meters. If the dimensions on the drawing is 10cm × 15cm, what is the scale of the drawing? 6) If the scale of the drawing would be given as 1: 400, how would this affect the actual measurements of the actual temple hall (length, width, perimeter, and area) compared to the 1: 200 scale drawing? Explain your answer. 7) If a new drawing would be drawn at a scale of 1: 100, what would be the ratio of the area of the temple hall in the new drawing compared to the first drawing? Explain your answer. 8) The original 1: 200 drawing is enlarged by a machine (or by a computer) such that the area of the temple hall after enlargement is found to be 243 cm2. What is the scale of this new drawing? Explain your answer.
152
AUTHENTIC ACTIVITIES—GROUP 4: SCALING
Activity 4.2: The Beth-Shean Temple Extended Activities Tasks 1) A 1: 50 scale model of the Beth-Shean Temple was constructed at the museum. In the courtyard is a rectangular pool for storing water. Its dimensions in the model are 8 cm long × 6 cm wide × 4 cm deep. a) What is the volume of water that the actual rectangular pool can hold (in cubic meters)? b) What is the ratio between the volume of the model pool and the volume of the actual pool? How is this ratio connected to the scale given? Explain your answers. 2) In the outside courtyard of the Beth-Shean Temple is a circular well. The model well's diameter is 5 cm and its depth is 6 cm. c) What is the volume of water that could be stored in the actual well (in cubic meters)? d) What is the ratio between the well’s capacity in the model and its actual capacity? How is this ratio connected to the given scale? Explain your answers.
153
CHAPTER 11
Activity 4.2: The Beth-Shean Temple Didactic Comments and Explanations Theme/Subject matter: Scaling, stretching and shrinking. Concepts: Scaling; stretching and shrinking by factors; linear, quadratic and cubic ratios. Purpose of activity: To deepen the understanding of the concept of scaling and its use in determining ratios between lengths, areas, and volumes, i.e. linear (first degree), quadratic (second degree), and cubic (third degree) ratios. Connectivity to other topics: Fractions, measurements, perimeters and areas of shapes and volumes of bodies. Background note: The Beth-Shean Temple is an actual archaeological site discovered at the Beth-Shean ‘tel.3 Ancient Beth-Shean was situated at a crossroads of a fertile valley, which gave it strategic importance all through the early period of Middle Eastern history. Archaeological digs in the area discovered many important artifacts dating from the 16th to 12th centuries before the Common Era, one of which was the remains of the Beth-Shean Temple. Comments and explanations for tasks 1) What are the actual dimensions of the temple hall? The drawing of the Beth-Shean Temple shows irregular geometric shapes that are probably not familiar to students (e.g. the temple hall is not exactly a rectangle or a trapezoid). Discuss the difference between the actual shapes of the area and regular geometrical shapes. The temple hall is a quadrilateral, with sides of 4 different lengths. Additionally, point out that the widths of the walls must be considered when discussing the area; measurement may have been taken inside or outside, and it must be specified whether internal or external measurements are given. Since the shape of the room is not a regular rectangle, calculations may be estimated. Use the opportunity to discuss problems concerning approximations. 2) What is the ratio between the perimeter of the hall in the drawing and the actual perimeter? How is this ratio related to the given scale? The ratio of perimeters is the same as the ratio of the lengths, that is, they are linear ratios. Thus, the scale is the same for the perimeter, meaning that the scale and the ratio are exactly the same. Studies have revealed, however, that some pre-service teachers and 6th-grade pupils may think that there is a difference between the ratio and the scale. This must be clarified. –––––––––––––– 3
In Middle Eastern archaeology, a ‘tel’ is a raised mound marking the site of an ancient city.
154
AUTHENTIC ACTIVITIES—GROUP 4: SCALING
Point out to the students that “scale”, is a unique concept of ratio, mainly used in drawing maps and diagrams of shapes and objects. 3) What is the ratio between the perimeter of the temple hall and the perimeter of your classroom? This activity can help participants appreciate the actual size of the temple. 4) What is the ratio between the area of the temple hall in the drawing and the area of the actual hall? The ratio between the areas of the hall in the drawing and the actual hall is a second-degree ratio, since it involves areas. The ratio will be the square of the scale: 2
2 1 = 1: ( 200 ) = 1: 40, 000 200
Experience with pre-service teachers and 6th-grade pupils revealed that some had great difficulty grasping the concept of ratios between areas, even after experimenting with actual areas of small-scale diagrams, and calculating the ratios between them. Many kept returning to linear-type answers, instead of the quadratic (squared) type required. This phenomenon is well-documented in the literature as the “Linear Illusion” or the “Linear Trap” (De Bock et al., 1998; De Bock et al., 2002). For this reason, it is important to ensure that students assimilate the concept of non-linear relationships (such as those of areas and volumes). 5) One of the rooms of the temple is a rectangular shape with an actual area of 150 square meters. If the dimensions on the drawing is 10cm × 15cm, what is the scale of the drawing? It is important to draw the attention of the pupils to the units used. Before answering this question, the dimensions must all be converted to identical units. This is a good time to discuss unit conversion (e.g. how many centimeters are in a meter and how many square centimeters are in a meter square). The actual room is 150 m2 = 1,500,000 cm2. The area of the room in the drawing is (10 × 15) 150 cm2. Thus the ratio of the areas is 150: 1,500,000 1:10,000. Since the ratio of areas is the square of the scale, the square root must be determined to arrive at the scale,
10,000 1:100 1 The scale of the drawing is 1:100. 6) If the scale of the drawing would be given as 1: 400 how would this affect the measurements of the actual temple hall (length, width, perimeter, and area) compared to the 1: 200 scale drawing? Explain your answer. Using the exact same drawing, but defining it by a scale of 1: 400 instead of 1: 200, means every centimeter in the drawing now corresponds to 400 centimeters in reality, instead of to 200. That is, the “reality” has essentially been increased by a factor of 2. Thus, the actual lengths, widths and perimeters will now be twice the 155
CHAPTER 11
size of those with a 1: 200 scale. The area, however, will be four times the size, as area is compared quadratically and not linearly. Note: Naturally, however, the dimensions of the actual temple are constant. However, a scale can be defined that will result in a differently sized drawing. For example, the given drawing (1:200) might be enlarged or reduced by a factor of 2, resulting in a scale for the drawing of 1:100 or 1:400, respectively. In other words, if the size of the drawing is enlarged by 2, then the given scale now becomes 1: 100 in order to maintain the actual, real measurements of the temple. Similarly, if the size of the drawing is reduced, the scale is “enlarged,” that is, it will become 1: 400. 7) If a new drawing would be drawn at a scale of 1:100, what would be the ratio of the area of the temple hall in the new drawing compared to the first drawing? Explain your answer. The new drawing, with a smaller scaling factor (from 1:200 to 1:100), will be larger in dimension than the original. Comparing the two can be tackled using two different strategies. a) The area of the room in the new drawing can be determined, and then compared to the area of the original drawing: The area in the original drawing is approximately 4.5cm × 6 cm = 27 square cm; the area in the new drawing will be (4.5 × 2) cm × (6 × 2) cm = 9 cm × 12 cm = 108 square cm. The result is a ratio of 4:1 between areas, and a ratio of 2:1 for any linear dimensions. b) The ratio can be determined using scale alone. That is, in the first drawing, the length of the side of the room is 200 times smaller than that in reality, and in the new drawing, it is 100 times smaller—a factor of 2 (linearly). Thus, the area of the room in the new drawing will be 4 times larger than the area in the original drawing, since a linear enlargement factor of 2 leads to quadratic enlargement factor of 4 (22). For further explanation, see the comments for tasks 4, 5 and 6 above. 8) The original 1:200 drawing is enlarged by a machine (or by a computer) such that the area of the temple hall after enlargement is found to be 243 cm2. What is the scale of this new drawing? Explain your answer. The area of the original drawing is 27 cm2 (see calculations in solution 7.a., above), so the area has been enlarged by a factor of 9 (243:27 = 9). Since this is a squared scale measurement, the scale has actually been increased by a factor 3 (i.e., the square root of 9), and thus according to the note in the solution of 6, the new scale is 1:200/3 = 3:200. We can verify the answer, first by calculating the area of the room in the enlarged drawing:
(4.5 cm × 3) × (6 cm × 3) = 13.5 cm × 18 cm = 243 square cm. Second, we verify that the dimensions of the actual temple are the same in both drawings: 4.5 cm × 200 = 900 cm and 6 cm × 200 = 1200 cm
156
AUTHENTIC ACTIVITIES—GROUP 4: SCALING
according to the original drawing; and 13.5 cm × 200/3 = 900 cm and 18 cm × 200/3 = 1200 cm according to the enlarged drawing. Discuss in class the difference between linear scale, which is one-dimensional (length and perimeter) and quadratic scale, which is two-dimensional (area). A discussion concerning circumferences and areas of circles might also be introduced. 2π r1: 2π r2 is the ratio between the circumferences of two given circles, and is equal to the ratio between the radii. On the other hand, the ratio between the areas of 2 circles is 2π r12: 2π r22 which is equal to the ratio of the squares of the radii. Adapting the activity for elementary-school use: Other similar activities can be given to pupils in school, such as giving the perimeters of scale models and actual buildings, and having the pupils determine the scale. Or, ask: If the ratio of the perimeters is known, is it possible to determine the ratio of the sides, or the ratio of the areas? Why or why not?
157
CHAPTER 11
Activity 4.2: The Beth-Shean Temple Extended Activities Didactic Comments and Explanations The extended activities deal with ratio of volumes, as opposed to linear (one dimensional) ratios. Ratios of volume are ratios to the third power, since three dimensions—length, width, and depth (in the case of a cuboid body)—are affected by the given ratio. Thus, in the product of the actual length by width by height, the scale factor appears three times. In this example, the scale is 1:50, thus: (50 × length) × (50 × width) × (50 × height) = 503 × (length × width × height). Comments and explanations for tasks 1) A 1:50 scale model of the Beth-Shean Temple was constructed at the museum. In the courtyard is a rectangular pool for storing water. Its dimensions in the model are 8 cm long × 6 cm wide × 4 cm deep. a) What is the volume of water that the actual rectangular pool can hold (in cubic meters)? The actual pool would hold the following volume of water: (50 × 4) × (50 × 6) × (50 × 8) = 200 × 300 × 400 = 24,000,000 cm3 = 24 m3. Note: This is a good opportunity to discuss conversion of measurement units: 1 meter = 100 cm; 1 square meter = 1 m × 1 m = 100 cm × 100 cm = 10,000 cm2; 1 cubic meter = 1 m × 1 m × 1 m = = 100 cm × 100 cm × 100 cm = 1,000,000 cm3. b) What is the ratio between the volume of the pool model and the volume of the actual pool? How is this ratio connected to the scale given? Explain your answers. The volume of the pool in the model is 4 cm × 6 cm × 8 cm = 192 cubic cm. The volume of the actual pool (determined above) is 24,000,000 cubic cm. The ratio is 192 1 = = 1:125, 000 24, 000, 000 125, 000
Note that the ratio is exactly the cube of the scale: (1:50)3 = 1:503 = 1:125,000. Various other examples can be given to the students and if needed, the instructor can use the explanation in question a) above. 2) In the outside courtyard of the Beth-Shean Temple is a circular well. The model well’s diameter is 5 cm and its depth is 6 cm.
158
AUTHENTIC ACTIVITIES—GROUP 4: SCALING
a) What is the volume of water that could be stored in the actual well (in cubic meters)? The diameter of the well in the model is 5 cm, and so the radius is 2.5 cm. Since the well is a cylinder, its volume is the product of its base area (π r2) times its depth (height). The volume may be determined by calculating the actual radius and depth, and then calculate the volume of the well: The actual radius is 2.5 cm × 50 = 125 cm = 1.25 m. The actual depth is 6 cm × 50 = 300 cm = 3 m. Hence, the volume of the well is π x (1.25m)2 × 3m = 14.71875 cubic meters. Alternatively, the volume of the model may be determined and then multiplied by the cube of the scale: [π x (2.5cm)2 × 6cm] × 503 = 14,718,750 cm3 = 14.71875 cubic meters. b) What is the ratio between the well’s capacity in the model to its actual capacity? How is this ratio connected to the given scale? Explain your answers. The ratio is 1:125,000, which is the scale (1:50) to the third power (i.e. cubed): 3
1 1 = 50 125, 000
159
CHAPTER 11
Activity 4.2: The Beth-Shean Temple Conducting the Beth-Shean Temple Activity with Pre-service Student Teachers
This authentic scaling activity is an excellent illustration of the complexity of proportional reasoning activities. The authors presented this activity to a group of student teachers during their course of studies at a teachers’ college. Their experience illustrated the dynamic nature of task design, and the added value stimulated by the proportional reasoning component entailed in the task, in terms of mathematical and pedagogical notions. The student teachers worked on the task in small heterogeneous groups (3-4 students each). From the outset, it was evident that the students were encountering difficulty, even from the very first encounter with the sketch of the temple, in which they had to identify the main hall and other parts of the temple, and then decide if they needed to measure the interior or the exterior walls of the main hall. Furthermore, the measurements of the sides of the main hall are not integers, and, to even further complicate matters, the shape of the main hall is a non-rectangular quadrilateral (i.e. not rectangular). Hence, their first hurdle was to discuss and decide how to compute its approximate area. A major goal of this task is for students to clarify for themselves the connection between the scale of the sketch and the ratio of the linear measurements of the sketch and the same linear measures in reality. The authors discovered that it took the students some time before they could accept the concept that scale and ratio were, in this case, indeed one and the same. Several students expressed their reservations by stating that “the scale should be 1 to a number, rather than a ratio between any two numbers.” The existence of non-integer measurements added to their confusion. The student teachers were instructed to begin this activity by preparing a number of pairs of similar rectangles. For each pair, they were to find the scale factor with respect to their sides, to compute the area of each rectangle, and then to find the ratio between the areas. They were also asked to draw sketches of the rectangular desks in their classroom on different scales and compute the linear and quadratic (area) ratios between the sketched desks and the real ones. Nevertheless, when the student teachers had to work on question four of the Beth-Shean Temple Task (What is the ratio between the area of the temple hall in the drawing and the area of the actual hall?), the vast majority of them picked the given linear scale as their answer. As mentioned earlier, this phenomenon is known as the “linear illusion” or “linear trap” (De Bock et al., 1998; De Bock et al., 2002) and refers to the tendency to apply a given linear model, whether or not it is appropriate. This “linear illusion” is widely prevalent and often employed by students of all ages (Modestina & Gagatsis) and in our case specifically in solutions of problems involving lengths, areas and volumes of similar objects. Another important phenomenon, reported by Van Dooren et al. (2009), is the tendency of primary school students to use proportional solution approaches when confronted with missing-value word problems, even if these approaches are 160
AUTHENTIC ACTIVITIES—GROUP 4: SCALING
inappropriate. Van Dooren et al. found that besides the missing-value formulation of word problems, the numbers appearing in word problems are part of the superficial cues that lead students to (over)use proportionality. In order to successfully implement such scaling tasks and to avoid falling into the “linear trap,” the authors of this book found that students require extensive engagement with many different tasks and to work with concrete objects. Analysis of quantitative data obtained from pre- and post-testing on scaling items, indicated this problematic situation. While it was evident that eventually all the students could cope with the problems that arose, in many cases they argued with each other within the working groups until they reached an agreement or were convinced by the explanations of their peers. Even though they all formed tables to organize the results of their measurements and computations, only several of them were able to understand immediately the effect of changing the scale on the size of the sketch or how to execute the backward procedure needed for solving question eight of the task. (The original 1:200 drawing is enlarged by a machine (or by a computer) such that the area of the temple hall after enlargement is found to be 243 cm2. What is the scale of this new drawing? Explain your answer.) Note that for this task, we recommended to the teachers to use computer software, such as Sketchpad, to produce sketches with different scales and present the measurements, in order to create a dynamic situation and to focus on important ideas rather than on technicalities. Many of the student teachers later reported that they had successfully applied the advised teaching strategies and above ideas in their practice lessons. The extended activity questions of this Beth-Shean Temple Task were, at first, found to be too demanding for the student teachers: the values were larger and more unwieldy, even with the use of calculators; and many of them were unfamiliar with the formulas needed for determining volume (of either the rectangular pool or the cylindrical well). However, after enough time was devoted to explaining and dealing with both the problems (unwieldy numbers and volume formulas) the student teachers were able to demonstrate sufficient understanding of the principles involved. Nevertheless, it should be noted that the students were always very enthusiastic and interested in working on this task. During the discussion portion of the activity, many ideas were raised regarding how to present it to pupils in elementary school and how to connect it to geography and to the study of maps. Towards the end of this activity, one of the student teachers summarized the task as follows: “This task is a very good summary of what we must teach our pupils in the upper level of elementary school: scales, ratio, conversion of units, measurements, perimeters, areas, three dimensional objects, and volumes. The task connects all those topics.”
161
CHAPTER 11
Activity 4.3: What’s the Real Size? Worksheet Description Students analyze the findings of a report of a research study on the concept of scaling, and devise methods to adopt activities and didactic strategies that have been shown to work successfully with children. Tasks 1) Read the report: Tracy, D. and Hague, M. (1997). “Toys ‘r’ math.” Mathematics Teaching in the Middle School, V.2. (3), 140-145. (The report describes various activities, detailed below). 2) Discuss the findings of the study, especially with respect to the mathematical concept of scale, and discuss the didactic concepts that arise from learning about ratio and proportion in the way discussed in the report.
Activities in the study 1) Activities using model toys upon which are indicated a scale: a) Examine the numbers marked on the model (use a magnifying glass, if necessary), such as 1/63 or 1:63. What is the purpose of such numbers? b) Measure the model (length, width, height). c) Determine the dimensions of the actual item: length, width, and height. 2) Activities using toys (dolls or figures) upon which there is no indication of scale: Measure the dimensions of the doll. a) b) Determine the dimensions of the actual object that the doll represents (e.g., if a baby doll is an actual baby; if a toy elephant is an actual elephant). The dimensions may be estimated, or determined through use of an encyclopedia, science texts, or actual measurements. Determine the scale ratio of the doll. c) 162
AUTHENTIC ACTIVITIES—GROUP 4: SCALING
Activity 4.3: What’s the Real Size? Didactic Comments and Explanations Theme/Subject matter: Shrinking and stretching - scaling Concepts: Scale, stretching and shrinking factors, linear ratio, stretching and shrinking by adding or subtracting a quantity. Purpose of activity: Analysis of a research study to deepen the understanding of the topic of ratio with respect to scale and its use; determination of actual sizes based on a scale model; determination of scale ratio based on sizes of actual objects and models. Connectivity to other topics: Measurements, various measurement units, converting units, averages. Comments and explanations for tasks 1) Read the report: Tracy, D. and Hague, M. (1997). “Toys ‘r’ math.” Mathematics Teaching in the Middle School, V.2. (3), 140-145. 2) Discuss the findings of the study, especially with respect to the mathematical concept of scale, and discuss the didactic concepts that arise from learning about ratio and proportion in the way discussed in the report. The findings discuss both the mathematical perspective of the concept of scale ratio, and didactic aspects of teaching the topic using toys. The following comments pertain to both. Activities were designed as a result of a study carried out in the United States (Tracy & Hague, 1997). The researchers believed that children everywhere, anytime, and from every cultural and social group enjoy playing with toys. Toys are often scale models of actual objects from the adult word, used to prepare children for adulthood. The researchers of the study developed educational activities using toys for grade-7 pupils, and found that the pupils’ motivation to learn topics such as scale, proportion, and ratio increased greatly as a result of these activities. They found that using toys in the teaching process a) encouraged family involvement, b) created cognitive activities appropriate for the pupils; c) created an opportunity to span age differences, d) strengthened the need for precise measurement, e) introduced pupils to measuring tools such as a compass or measuring wheel, f) developed the pupils’ senses; g) encouraged use of texts and literature to enhance understanding of the topic, and h) bridged the divide between that which is learnt in school and the real world. Activities in the study Previous to commencing formal instruction on the topic of scale, pupils in grade 7 were requested to bring to class various toys. The class was divided into groups, and the members of each group were to use a magnifying glass to examine all the markings printed or embossed on the toys. The findings for each toy were charted under the following categories: a) country of manufacture, b) year of manufacture, c) 163
CHAPTER 11
name of manufacturer, d) name of the toy, e) numbers in general, and f) “strange” numbers. The “strange numbers” meant any numbers that had a “curious” representation, especially if joined with the division symbol, slashes, or other symbols. Both toys that had on them an imprint of scale (e.g. model cars), and those that did not (e.g. dolls and toy animals in various sizes) were chosen. In every activity, the questions were posed in such a way as to lead the pupils to develop an understanding of the concept of scale ratio. 1) Activities using model toy cars upon which are indicated a scale: a) Examine the numbers marked on the model (use a magnifying glass, if necessary), such as 1/63 or 1:63. What is the purpose of these numbers? The class should discuss the numbers and their significance. In the study, initially only 3 out of 152 grade-7-pupils could answer the question correctly. However, continued teaching using the toys led the pupils to understand and assimilate the concept. b) Measure the model: length, width, and height. In the study, a model of a 1985 Chevrolet Camaro IROC-Z 28 was used, with the scale 1:63 stamped on the car. Using compasses, the pupils measured the dimensions of the model. The results obtained were 2.3 cm high × 3.2 cm wide × 7.6 cm long. The researchers pointed out that this was an excellent opportunity to use various types of compasses and teach the proper way use them to measure length segments. c) Determine the dimensions of an actual car: length, width, and height. The pupils surmised (correctly) that the model’s dimensions had to be multiplied by 63 (as was found in a) above) to arrive at the dimensions of the actual car. Using a calculator, they obtained 144.9 cm × 201.6 cm × 478.8 cm, which, when converted to meters, became (approximately) 1.45 m high, 2.02 m wide, and 4.79 m long. 2) Activities using toys (doll) upon which there is no indication of scale: a) Measure the dimensions of the doll. b) Determine the dimensions of the actual object that the doll represents (e.g., if a baby doll is an actual baby; if a toy elephant is an actual elephant). The dimensions may be estimated, or determined through use of an encyclopedia, science texts, or actual measurements. c) Determine the scale ratio of the doll. A “Marge Simpson4” doll was used in the study. The teacher asked the students how they thought they could determine the scale of the doll. The study reports the suggestions and procedure that the class, assisted by the teacher, developed: –––––––––––––– 4
Marge Simpson is a fictional character from the American animated television series The Simpsons. The mother of the Simpson family, she has a distinctive and very high blue beehive hairstyle.
164
AUTHENTIC ACTIVITIES—GROUP 4: SCALING
i) They measured the doll, and found it to be 29 cm high, including Marge’s mass of blue hair. After a discussion in class, they decided it wasn’t logical to include the hair, and thus set the height of the doll at 22 cm. ii) The teacher than asked the class to consider the height of an actual woman. Two methods were suggested for finding the height of an average woman: to estimate the height of one of the mothers, at 5’6” (converted to cm: 5 × 30.5 + 6 × 2.54 = 167.74 cm, or about 1.68 m); or to measure the heights of the three women in the class (the teacher, the researcher and the assistant) and calculate the average. iii) At this point, determining the scale was straightforward. Pre-service teachers were very satisfied with this activity, which is unique in using reports from the literature that present authentic activities. They were especially pleased by the sections of the report that gave practical advice. They took special interest in the section describing the students’ activities: Independent work began. We observed several behaviors: (a) about half our seventh graders lacked appropriate library-research skills; (b) the degree of students’ persistence varied widely; (c) females and males participated equally in research even when toys were sex-typed inversely (Tracy 1987) (e.g., females fervently searched through Hot Rod magazine, and males ardently pursued information on baby bottles); and (d) some groups went outside the library, making telephone calls to the nearest university library, the school district’s bus garage, and friends and relatives (p. 144). The pre-service teachers were directed to try the same activities in their classes and report back which activities worked and which didn’t. The exchange of information proved fascinating to them and they eagerly compared notes. During teacher-training courses, the authors of this book observed that pre-service teachers are generally quite interested in being introduced to actual activities that are potentially useful when teaching the subject in their classes. Suggested extra activities Pre-service and in-service teachers can present the activities described in their actual elementary school classes, document the process of the activity with their students, and compare their results with the results of the study.
165
CHAPTER 11
Activity 4.4: The Puzzle Worksheet Description Puzzles are an all-time favorite. Here, a classic “shape” puzzle is used to study various concepts of ratio and proportion5. Materials Envelopes containing 6 puzzle pieces: A, B, C, D, E, and F, prepared according to the illustration . (One envelope per three or four participants.) Tasks 1) Assemble the puzzle into an 11cm × 11 cm square. 2) Calculate the perimeter and the area of the square. 3) Distribute the puzzle pieces to the members of the group (each should have one or two pieces). Using their piece(s) as a base, a ruler, and graph paper, creates pieces for a new puzzle such that the segment that is 4 cm long in the original puzzle corresponds to one 7 cm long in the new. Assemble the new puzzle. 4) Determine the perimeter and area of the new puzzle. 5) Discuss the following didactic points: What is the purpose of such an activity? a) b) Could this activity also be appropriate as an introductory activity to the topic of ratio and proportion? Why? Explain your answers.
–––––––––––––– 5
The source of the puzzle is: Warfield, V.H. (1992). “Didactic through the back door”. MER Journal, 4–5.
166
AUTHENTIC ACTIVITIES—GROUP 4: SCALING
Figure 4.4: Puzzle
167
CHAPTER 11
Activity 4.4: The Puzzle Didactic Comments and Explanations Theme/Subject matter: Scaling – stretching and shrinking. Concepts: Scale, stretching and shrinking factors, linear ratios, quadratic ratios, stretching and shrinking times a factor, stretching and shrinking by adding or subtracting a quantity. Purpose of activity: To deepen the understanding of the concept of scaling; presentation of length ratios as linear ratios, and area ratios as quadratic ratios. Connectivity to other topics: Fractions, measurements, area and perimeter, units of measurement, converting units. Comments and explanations for tasks This activity might serve as an interesting way to present the topic of ratio and proportion to pre-service teachers and increase their motivation for studying the topic. The activity is a good one to expand on the topic of scale, since the difference between ratios of areas of various geometric shapes, as opposed to ratios of the perimeters of those shapes, are discussed. This activity could also be used as a preliminary introductory activity. In this case, students are not yet acquainted with the topic and methods, and this activity can help identify those with additive thinking skills (see Chapter 5, Proportional Reasoning—A Psychological-Didactical View). Preparing the material for the activity For each group in the class, photocopy the puzzle, cut it into its six pieces and place the pieces into an envelope. Each group receives an envelope with the puzzle, along with graph paper and rulers. Comments and explanations for worksheet questions 1) Assemble the puzzle to obtain a square that is 11cm × 11 cm. The purpose of this activity is to demonstrate that a square may be assembled from the pieces of the puzzle. 2) Calculate the perimeter and the area of the square. This is straightforward. 3) Distribute the puzzle pieces to the members of the group (each should have one or two pieces). Using their piece(s) as a base, a ruler, and graph paper, creates pieces for a new puzzle such that a segment that was 4 cm long in the original puzzle corresponds to one 7 cm long in the new. Assemble the new puzzle. During our presentation of this activity to pre-service teachers, they exhibited different methods of constructing the new puzzle pieces. Some first determined the enlargement factor, enlarged the entire square, and then divided it into its
168
AUTHENTIC ACTIVITIES—GROUP 4: SCALING
individual parts. Others enlarged each part separately according to the enlargement factor, and then assembled the new puzzle into a square. Difficulties arose, however, when students with additive thinking skills enlarged each part by 3 cm; as a result the puzzle could not be assembled properly and a square could not be obtained. Such an error is common when this activity is used as an introductory activity, before students have learnt about the subject. It is worth examining the problems that arise due to additive thinking during the class discussion. 4) Determine the perimeter and area of the new puzzle. Discuss how the enlargement factor used for the lengths of the sides of each puzzle piece relates to that for the perimeter and for the area. 5) Didactic questions. A few minutes should be spent discussing the following points: a) What is the purpose of such an activity? b) Is this activity appropriate as an introductory activity to the topic of ratio and proportion? Why? Explain your answers. This discussion can be based on the findings of the studies presented in Chapter 5 Proportional Reasoning—A Psychological-didactical View.
169
CHAPTER 11
Activity 4.5: The Thief, the Teacher and How They Connect Worksheet Description Photographs and close-circuit cameras offer an interesting opportunity to study proportion and spatial awareness. Part 1 One day, an expensive piece of jewelry was stolen from an exclusive jewelry store. Detective Dave observed that the modus operandi matched that of a well-known thief who happened to be unusually tall. Lacking any hard evidence pointing to his suspect, he studied pictures from the close-circuit camera that showed the back of the thief when he was next to the cash register. Detective Dave claimed that it would be possible to estimate the height of the thief by observing him next to the cash register and thus confirm if his suspicions were correct. Tasks: Part 1 1) Do you think Detective Dave will be successful in determining the height of the thief? How? 2) Suggest how Detective Dave can estimate the height of the thief.
170
AUTHENTIC ACTIVITIES—GROUP 4: SCALING
Part 2 Below is a photograph of a teacher holding a magazine. The actual dimensions of the magazine are 21.5 cm × 29.5 cm.
Figure 4.5: The Thief, the Teacher and How They Connect
Tasks: Part 2 1) What is the teacher’s height? Explain the method you used to arrive at your answer. 2) Is it possible to use the photograph to determine the height of the door behind the teacher? Can the same ratio that was used to find the teachers height work? Explain. 3) Are the results of questions 1 and 2 logical? Explain your answer.
171
CHAPTER 11
Activity 4.5: The Thief, the Teacher and How They Connect Didactic Comments and Explanations Theme/Subject matter: Scaling – stretching and shrinking. Concepts: Scale, linear ratios, stretching and shrinking factors, stretching and shrinking times a factor, stretching and shrinking by adding or subtracting. Purpose of activity: To deepen the understanding of the concept of scaling, and present practical uses of the method. Connectivity to other topics: Percentages, fractions, measurements, perspective and spatial visualization awareness. Comments and explanations for tasks Part 1 One day, an expensive piece of jewelry was stolen from an exclusive jewelry store. Detective Dave observed that the modus operandi matched that of a well-known thief who happened to be unusually tall. Lacking any hard evidence pointing to his suspect, he studied pictures from the close-circuit camera, which showed the back of the thief when he was next to the cash register. Detective Dave claimed that it would be possible to estimate the height of the thief from observing him next to the cash register, and thus confirm if his suspicions were correct. Part 1: Tasks 1) Do you think Detective Dave will be successful in finding the height of the thief? How? 2) Suggest how Detective Dave can estimate the height of the thief. Direct the discussion so that the students realize that they must discover a proportional relationship between the dimensions of some object in the photograph, such as the cash register or the counter, with its actual measurements. They can thus arrive at a scaling factor, and with it estimate the height of the thief. Such discussion is appropriate for introducing the concept of scaling and its use to find the sizes of actual objects. The discussion can be expanded to introduce other uses of scale, such as maps, diagrams, etc. Part 2 Below is a photograph of a teacher holding a magazine. The actual dimensions of the magazine are 21.5 cm × 29.5 cm. Part 2: Tasks 1) What is the teacher’s height? Explain the method you used to arrive at your answer. 172
AUTHENTIC ACTIVITIES—GROUP 4: SCALING
By comparing the dimensions of the magazine in the photo with the actual dimensions of the magazine given, the scaling factor can be determined, which can then be used to calculate the teacher’s actual height. 2) Is it possible to use the photograph to determine the height of the door behind the teacher? Can the same ratio that was used to find the teacher’s height work? Explain. If the students try to use the scaling factor arrived at in 1) to determine the height of the door, they will discover that the calculated height of the door is shorter than that of the teacher! Obviously, this cannot be true. 3) Are the results of questions 1 and 2 logical? Explain your answer. Here, there is the added factor of perspective. Ensure that the students understand that when objects positioned one behind the other are photographed, the further object will appear smaller than a closer object, even if it is actually larger. The transition here is from two dimensions to three dimensions. Thus methods for 2dimensional scaling are inappropriate here. Suggestion: Instructors and teachers can find other appropriate pictures and articles about optical illusions from books and web sites in order to enhance the learning experience. Adapting the activity for elementary-school use: There are many related pictures and special sites for young children which can be used.
173
CHAPTER 11
Activity 4.6: The Giant Slayer Worksheet Description This activity presents another task using a photograph to estimate actual sizes of an object. This time, the idea is from an authentic newspaper article.
A newspaper report6, describes the following event that happened in Germany in 2002: “Hurricane Genine, hurtling through Europe, has to date caused the death of approximately 30 people, and damage in the vicinity of tens of millions of dollars. In the photo (courtesy AP) is the base of a turbine that was uprooted in Germany. The huge dimensions of the turbine can be appreciated by comparing it to the man standing nearby (circled). Task 1) Look at the picture. How can the perimeter of the turbine base be calculated? Explain your answer.
Figure 4.6 The Giant Slayer
–––––––––––––– 6
From Ma’ariv, 29.10.2002, reported by Elad Beck
174
AUTHENTIC ACTIVITIES—GROUP 4: SCALING
Activity 4.6: The Giant Slayer Didactic Comments and Explanations Theme/Subject matter: Shrinking and stretching, ratio in scaling. Concepts: Stretching and shrinking factors, linear ratios, stretching and shrinking times a factor, stretching and shrinking by adding and subtracting quantity. Purpose of activity: To deepen the understanding of the concept of scaling and the use of scale; using ratio to determine actual sizes. Connectivity to other topics: Geometry: geometrical forms such as hexagon, octagon, circles; areas, perimeters, symmetry, measurements; perspective and spatial visualization awareness. Comments and explanations for tasks A newspaper report7, describes the following event that happened in Germany in 2002: “Hurricane Genine, hurtling through Europe, has to date caused the death of approximately 30 people, and damage in the vicinity of tens of millions of dollars. In the photo (courtesy AP) is the base of a turbine that was uprooted in Germany. The huge dimensions of the turbine can be appreciated by comparing it to the man standing nearby (circled). Task 1) Look at the picture. How can the perimeter of the turbine base be calculated? Explain your answer. In this activity students are presented with an authentic newspaper article to stimulate their imagination and to present the connection between theoretical discussions and real events. The purpose of the activity is to extend the use of the scaling concept to find the actual scale of a known object, and from there the actual size of another object. This is an extension to the concept of ratio of scaling by shrinking or stretching. Additionally, the activity touches on the concept of proportion. During the discussion, point out to the students that in order to answer the question, they must be aware of the following points: a) Before the circumference of the turbine base may be calculated, the geometric shape must be determined. The photograph does not allow this to be known for certain; explore with the students possible shapes of the base, such as octagon, hexagon, or perhaps a pentagon or a nonagon. Ask the students for geometric explanation for each one of the choices. Summarize and emphasize that, assuming we are seeing at least one half of the base in the photo, it cannot be a –––––––––––––– 7
From Ma’ariv, 29.10.2002, reported by Elad Beck
175
CHAPTER 11
pentagon nor a hexagon, and thus the polygon which makes up the base must be of at least 8 sides. b) After the geometric shape is determined, its actual size has to be found. A practical way to find the actual size of a photographed object is by using the scale of the photograph. In this case, we can assume that the actual height of the man in the photograph is approximately 1.75 m. His size in the photo is measured, and the ratio of the two sizes determines the scale, or the shrinking factor, of the photograph. The actual perimeter of the turbine’s base can thus be calculated. c) This activity can be an opportunity to review how to find perimeters of other geometrical shapes, including the circumference of a circle. In addition, the man’s height can be thought of as the diameter of the circle that encircles him, and can be used to find the circumference of that circle. d) To conclude this activity, draw the students’ attention to the perspective in the photograph. In Activity 4.5, The Thief and the Teacher, the perspective in the photograph was a factor that distorted the results. In this photo, however, there is no problem due to perspective, since the man and the turbine are the same distance from the viewer.
176
AUTHENTIC ACTIVITIES—GROUP 4: SCALING
Activity 4.7: The Reduction Triangle Worksheet Description A unique way to promote a savings opportunity in a store provides an interesting way of investigating ratio and proportion.
The owner of an electronics store uses a picture of scissors cutting a triangle to illustrate the percent-off the price of his products (by percent or simple fraction). The portion of the triangle which is cut off represents the amount of reduction he is giving on his merchandise.
Figure 4.7-a. The Reduction Triangle
Tasks 1) What is the price reduction represented by the gray area? 2) If the reduction “line” is lowered to 2 units from the top, and the area marked grey, what would the percent reduction be now? 3) If the cut would be made at five units (half the height), what reduction is now represented? 4) If we wish to represent a 50% reduction, where would the line need to be drawn? An approximation may be given. 5) A right-angled triangle is presented below.
Figure 4.7-b. Right-angled Triangle 177
CHAPTER 11
a) How does the area increase if each side is increased times 2? b) How does the area increase if each side is increased times 4? 6) The owner of another electronics store decides to represent his price reduction in a similar manner, but with a rectangle. How would he illustrate a 50% reduction? Where should he position the cutting line?
Figure 4.7-c. Rectangle
7) Compare the presentation of the two stores.
178
AUTHENTIC ACTIVITIES—GROUP 4: SCALING
Activity 4.7: The Reduction Triangle Didactic Comments and Explanations Theme/Subject matter: Ratio in scaling. Concepts: Stretching and shrinking factors, quadratic ratios, areas, stretching and shrinking times a factor. Purpose of activity: To deepen the understanding of the concept of scaling, and the use of scale. Connectivity to other topics: Percentages, fractions, measurements, areas and perimeters of specific geometrical shapes. Comments and explanations for tasks 1) What is the price reduction represented by the gray area? In this activity, attention must be paid to the portion of the area obtained by dividing the triangle at a given height. Intuition may incorrectly lead to using linear proportion instead of quadratic (2nd-order) proportion. The size of the triangle is purposely given in “units” (and not actual measurements) to demonstrate calculation of the area simply on one side and height. The “unit” is defined as being one tenth of the height of the triangle. In our example, the line is drawn one unit from the top and parallel to the side of 20 units. The small triangle (the shaded one) is similar to the original triangle, hence the new side segment will be one tenth the length of the larger side, that is, 2 units. The area of the small triangle will thus be 1 unit square (height × side/2 1 × 2/2=1). The area of the original triangle (representing full price) is 100 units square (10 × 20/2). Therefore, the reduction is a mere 1%. Put differently, the height of the “reduction area” is 1/10th of the original, the side is 1/10th of the original, and thus the reduction represented (the area) is (1/10 × 1/10) is actually 1/100th of the original full price. So, while the reduction may appear to be “1/10th, or 10%, off,” in reality, according to the illustration, savings only amount to 1%! On the other hand, perhaps who ever thought of using a triangle didn’t understand the mathematical and geometrical implications. 2) If the reduction “line” is lowered to 2 units from the top, and the area marked grey, what would the percent reduction be now? Two units out of ten is 1/5 of the height. The side, by similar considerations, will be 1/5th of the original side. Thus, the “reduction area” will be 1/25 of the total original area, or 4 square units. The percent reduction is a 4% reduction (and not the “20%” which may seem apparent at first) . 3) If the cut would be made at five units (half the height), what reduction is now represented? Here the height is at half the triangle. Half the height and half the side will give an overall “reduction area” of ½ × ½ = ¼ that is 25%. This may also be calculated
179
CHAPTER 11
directly: The height of the triangle is 5 units, the side is (1/2 × 20) 10 units and the area is (5 × 10/2) 25 square units, or 25% of the original. 4) If we wish to represent a 50% reduction, where would the line need to be drawn? An approximation may be given. The answer may be arrived at by trial and error, continuing the above method (i.e. moving the cutting line) and calculating the reduction each time until the correct percentage is discovered. E.g., when the cutting line is 6 units down, the reduction triangle is 36/100, or 36%. (Or, by direct calculation, the height is 6 units, the base will be 12 units, and the area will be 36 square units). When the line is 7 units down, the reduction triangle will be 49/100 or 49%. Even closer to 50% may be approached by trying 7.1 units, which gives a triangle area of 50.41%, which is a good approximation to 50%. The student should accurately draw a line parallel to the base, 7.1 units down the triangle. It is possible to calculate the value directly by using the square route of 50 (provided that pupils are aware of the use of square roots). 5) A right-angled triangle is presented below. a) How does the area increase if each side is increased times 2? b) How does the area increase if each side is increased times 4? If the height is increased by a factor of two, the base is also increased by a factor of 2, and the area will be increased by a factor of 4. Similarly, if the dimensions are increased by a factor of 4, the area will be increased by a factor of 16. 6) The owner of another electronics store decides to represent his price reduction in a similar manner, but with a rectangle. How would he illustrate a 50% reduction? Where should he position the cutting line? In this case, it is enough to simply place the line at the halfway mark to represent 50% of the area. The base stays the same. 7) Compare the presentation of the two stores. When using a rectangle, the base of the new figure remains the same dimension as the original no matter where the height is determined. However with a triangle, both the length of the height and the length of the base change, and thus the relative size of the area changes quadratically.
180
CHAPTER 12
GROUP 5:
INDIRECT PROPORTION ACTIVITIES
Activity 5.1:
How Heavy is the Meteoroid?
Activity 5.2:
Turn-of-the-Century Bicycle
Activity 5.3:
Graduation Honors Stage
181
CHAPTER 12
Activity 5.1: How Heavy is the Meteoroid? Worksheet Description A method for determining the weight of an object using ratio.
Scientists at a university acquired a small meteoroid that was brought from the moon. When they got to the laboratory to weigh it, they were disappointed to discover that the special scale for weighing small objects was being recalibrated. Anxious to determine the weight of their meteoroid, they searched for another way.
Figure 5.1-a. A Meteoroid
They discovered an unequal-arm balance in the lab (i.e. the lengths of the arms a ≠ b). After some discussion, they came up with a simple way to discover the weight of the meteoroid (W). They did the following: They placed the meteoroid (W) on one of the pans (labeled H in Fig. 5.1-b), and found that it could be balanced by weight to of 10 grams in the second pan. They then placed the meteoroid on the second pan (K in Fig. 5.1-b), and found it could be balanced with a weight of 40 grams in the first pan. After a few calculations, they came up with the weight of the meteoroid.
Figure 5.1-b. Unequal-arm Balances 182
AUTHENTIC ACTIVITIES—GROUP 5: INDIRECT PROPORTION
Tasks 1) Explain how the scientists determined the weight of the meteoroid, and give its weight. 2) Write down the reasoning you used to arrive at a solution. 3) Suggest a way of explaining to elementary-school pupils the meaning of the concept “balance” or “equilibrium” of a scale, or the meaning of the term “balanced scale.”
183
CHAPTER 12
Activity 5.1: How Heavy is the Meteoroid? Didactic Comments and Explanations Theme/Subject matter: Proportion of indirect ratios. Concepts: Indirect ratios, proportional formula, constant products, first- and second-degree algebraic equations. Purpose of activity: Using inverse proportion and indirect ratios to find equilibrium. Connectivity to other topics: Physical concepts – equilibrium. Comments and explanations for tasks This activity is presented as a riddle. It is a suitable activity for introducing the idea of balance and to initiate a class discussion in which various suggestions for solving the problem are presented. The discussion should be guided so that the reason that the scientists weighed the meteoroid twice should be discovered (and why comparable data must be obtained). The discussion may be ended by presenting the properties of inverse proportion and indirect ratio (see Part Two, Theoretical Background, Chapter 4, A Mathematical Perspective of Ratio and Proportion). Alternatively, this activity could also be used as a final activity to wrap up the topic of inverse proportion. In addition to the discussion on the mathematical concepts involved, a discussion on the difficulties that young pupils and adolescents might have solving problems of inverse proportion should be encouraged (see Chapter 5, Proportional Reasoning—A Psychological-Didactical View). 1) Explain how the scientists determined the weight of the meteoroid, and give its weight. 2) Write down the reasoning you used to arrive at a solution. The weight of the meteoroid is found by comparing the data that was obtained for each weighing. This comparison is effective because a state of inverse proportion is present between the length of the arm and the weight of the object on the pan. Equilibrium occurs when their products are equal. If we let x represent the weight of the meteoroid, and a and b the lengths of the arms of the scale, we obtain: First weighing: a × x = b × 10, or to present it as the proportional formula: a 10 = . b x
Second weighing a × 40 = b × x, or, a x = . b 40
184
AUTHENTIC ACTIVITIES—GROUP 5: INDIRECT PROPORTION
Since x is the same for both and we use the same unequal-arm balance, comparing the above results leads to: a x 10 x2 = 400 x = 20 grams, = = b 40 x
which is the weight of the meteoroid. 3) Suggest a way of explaining to elementary-school pupils the meaning of the word “equilibrium” on a balance, or the meaning of the term “balanced scale.” Presenting the topic of inverse proportion to pupils should be done through demonstrations and hand-on activities. Even grade-six pupils can intuitively find practical solutions for such problems. The topic should be taught formally—that is, using the proportional formula—only in grades seven or eight, after pupils have been introduced to algebra.
The meaning of the term “equilibrium” (or “balanced scale”) implies that there is a state of equilibrium between the lengths of the balance and the weights in the pans on the end. When an equal-arm balance is in equilibrium, the weights of the items in each of the pans are equal. This is the way that vegetables and other produce were weighed in the past, by balancing the item with a known set of weights. This is also in principle, the way a baby scale works. This principle is also nicely demonstrated on a children’s seesaw, when the heavier child causes her partner to swing up in the air (the seesaw in not in equilibrium). An unequal-arm balance, on the other hand, uses the principle of inverse proportion and the product of the lengths of the arms and the weights in the pan. These principles are also used for lifting a heavy object, as in the case of a crane. The heavy object can be lifted if it is attached to the short arm, and a counterweight is attached to the long arm. The point of the center of gravity is determined so that the counterweight can balance the heavy weight at the other end. Equilibrium is achieved when the products of the weights by the lengths of the arms are the same; by changing the equilibrium (e.g. by increasing the weight of the counterweight), the first object rises. For additional practice and review, more problems of this nature can be found in the following chapter, especially in Groups 6-B and 6-D. Note The term “center of gravity” (or "center of mass") is based on the same principle regarding the equilibrium of the equal- or unequal-arm balance. For example, the centroid (center of gravity) of a triangular object is found at the intersection of its three medians (the segments drawn from the vertices to the bisectors of the opposite sides). These three medians always meet at one point, and this point is the center of gravity in the sense that if we set the triangle on the point of the pin at this point, the triangle will be in equilibrium (i.e., it will be in perfect balance). 185
CHAPTER 12
Any other point will result in the triangle not being in equilibrium and the surface will slant to one side of another. Another example is when hanging a picture on the wall. The point at which the picture is hung on the nail must be exactly at the center of gravity of the picture; otherwise, the picture will slant to one side.
186
AUTHENTIC ACTIVITIES—GROUP 5: INDIRECT PROPORTION
Activity 5.2: Turn-of-the-Century Bicycle Worksheet Description An intriguing bicycle is the topic of investigation in this interesting activity.
A museum has an exhibition of turn-of-the-century bicycles. One of them aroused the curiosity of one grade-six student who asked the guide the following: “How can this bicycle possibly work? When the front wheel has moved 1 meter, the back wheel has moved considerably less.” The guide answered: “And yet they work fine. Perhaps you can think about it and explain how it works.”
Figure 5.2. A Turn-of-the-Century Bicycle
Tasks 1) Write down any explanations that you think the pupils might have offered and analyze their answers. 2) Try to discover a mathematical explanation for the bicycle’s motion. How would you explain this to the students? 3) If the circumference of the large front wheel of the bicycle is 462 cm, and the circumference of the small back wheel is 132 cm, what is the distance that the bicycle must travel so that the back wheel makes 30 revolutions more than the front wheel?
187
CHAPTER 12
Activity 5.2: Turn-of-the-Century Bicycle Didactic Comments and Explanations Theme/Subject matter: Inverse proportion. Concepts: Indirect ratio, proportional formula, constant products, algebraic equations of the first and second degrees. Purpose of activity: Using inverse proportion to solve problems of motion. Connectivity to other topics: Physical concepts – laws of motions of wheels. Comments and explanations for tasks 1) Write down any explanations that you think the pupils might have offered and analyze their answers. 2) Try to discover a mathematical explanation for the bicycle’s motion. How would you explain this to the pupils? Grade-six pupils have not yet studied inverse proportion, but their intuition might enable them to find practical answers and to explain that the larger the wheel, the fewer revolutions it will make over a given distance. If they are given the opportunity to try the bike, that is to move the bike and observe the motion of the wheels, then it is certain that most of the pupils will appreciate the principle. A similar situation occurs with gears. When discussing the answers given by pre-service course participants, direct their attention to answers of a more mathematical nature. Any of the following questions can be used to elicit mathematical explanations and reasoning: 1) Is it enough to know either the circumference of the wheels or the number of revolutions that each wheel made in order to find the distance that the bicycle traveled? (Answer: No. Both measurements must be known for at least for one of the wheels.) 2) Is it enough to know the circumference of one of the wheels and the number of revolutions it made to discover the distance the bicycle traveled? (Yes.) 3) Mathematically, how can the distance that the bike traveled be found? (The distance will be the product of the circumference and the number of revolutions of either one of the wheels.) 4) End the discussion by demonstrating a general solution for this type of problem, as detailed below.
Let the number of revolutions that the front and back wheels make be represented by n1 and n2, respectively, and the circumferences of the front and back wheels be represented by p1 and p2, respectively. Since the distance that each wheel travels must be the same: a) p1 × n1 (distance front wheel traveled) = p2 × n2 (distance back wheel traveled). The ratio between the circumference and the number of revolutions is an b) indirect ratio, expressed mathematically as: p1 × n1 = p2 × n2 p1/p2 = n2/n1 188
AUTHENTIC ACTIVITIES—GROUP 5: INDIRECT PROPORTION
3) If the circumference of the large front wheel of the bicycle is 462 cm, and the circumference of the small back wheel is 132 cm, what is the distance that the bicycle must travel so that the back wheel makes 30 revolutions more than the front wheel? The distance that the bicycle travels is (obviously) equal to the distance both the front and back wheels travel. Let x represent the number of revolutions that the front wheel makes. The number of revolutions the back wheel makes will thus be x + 30. The distance the front wheel travels (p1 × n1) is equal to the distance that the back wheel travels (p2 × n2). Thus: 462x = 132(x + 30), which gives (462-132) x = 3960 x = 3960/330 = 12 The front wheel made 12 revolutions, which is 12 × 462 cm = 5544 cm or 55.44 m.
In elementary school, pupils can be asked to solve this problem by “trial and error,” by giving the number of revolutions of one wheel, calculating the distance traveled, and then calculating the number of revolutions the other wheel made. Comparisons and adjustments will be made until the desired solution is arrived at. More problems for practice and review can be found at the next chapter entitled: Group 6: Additional Activities for Practice and Enrichment. See, in particular, group’s 6-B and 6-D.
189
CHAPTER 12
Activity 5.3: Graduation Honors Stage Worksheet Description How long does a task take? It depends on some inversely related factors.
It is graduation time at Hero Elementary School. Seven pupils have been chosen to design and decorate the stage. They have to work 21 hours each in order to do the job. Unfortunately, before they even begin the task, four pupils come down with chickenpox and have to stay home. Tasks 1) How many hours will it take for each of the remaining three pupils to design and decorate the stage? Describe the strategy used to get the answer. 2) Find a different strategy to arrive at the same answer.
190
AUTHENTIC ACTIVITIES—GROUP 5: INDIRECT PROPORTION
Activity 5.3: Graduation Honors Stage Didactic Comments and Explanations Theme/Subject matter: Inverse proportion. Concepts: Indirect ratio, proportional formula, constant products, first- and second-degree algebraic equations. Purpose of activity: Using inverse proportion to solve work and rate problems. Connectivity to other topics: Algebra, solving equations. Comments and explanations for tasks 1) How many hours will it take for each of the remaining three pupils to design and decorate the stage? Describe the strategy and used to get the answer. At first reading, it may be obvious that inverse proportion is the concept needed to solve the problem. That is, the inverse relationship is hidden. It should be explained to the students that there is an inverse ratio between the number of students in the work team and the number of hours that they need to do the job of designing and decorating the stage. In order to find the number of hours that the reduced team (the three healthy pupils) requires preparing the stage, it must be understood that the product of the number of hours of work for each one and the number of workers in the group must remain constant. If the number of workers decreases, the number of hours for each one must increase, and vice versa, if the number of workers increases, the number of hours required from each will decrease. That is, the number of workers and the number of hours are inversely proportional. In our problem, the first group had 7 pupils that were to finish the decorations by working 21 hours each. In the reduced group there were only 3 pupils and we must calculate how many hours each one has to work in order to do the same work required to decorate the same stage. We represent the number of hours for each one of the small group by x, and since the product of pupils and hours must remain constant,
x × 3 = 21 × 7
3x = 147
x = 49 hours.
It should be emphasized that the inverse proportion has been obtained: 7/3 = x/21. In general, when two teams of workers must do the same job, we can represent the time (number of days) required by the first team by t1, and the time required by the second as t2. The number of workers in each team is n1 and n2 respectively. The ratio between the number of days the first team requires to the number of days the second team requires (t1:t2) is equal to the inverse of the number of workers in each team (n2/n1). In other words, t1/t2 = n2/n1. This can also be expressed by the product of the number of workers times the number of days: t1 × n1 = t2 × n2.
191
CHAPTER 12
2) Find a different strategy to arrive at the same answer. The solution given above is an algebraic one. Pupils in grade 6 are not yet familiar with algebra, but they can solve the problem using pre-formal strategies. For example, pre-service teachers who participated in a research study used the following strategy: The number of pupil-hours required for the decoration is 21 × 7=147 hours. However, since there are only 3 pupils instead of 7, they will need 147/3 = 49 hours. Grade-six pupils will probably use a similar strategy. Another possible strategy is that of “missing value”. Those with potential proportional reasoning skills will intuitively understand that there is an inverse relationship between the number of hours and the number of workers and will derive the following:
7 pupils 3 pupils
....... .......
21 hours each ? hours each
Using horizontal multiplication, the answer is arrived at thus: ? hours = 21 × 7/3 = 49 hours. The most common mistake in solving such problems is incorrectly identifying the relationship as a direct one, resulting in using the missing value table as for direct proportion. In such a case, the answer obtained would be 9 hours (? = 21 × 3/7). However, it should be immediately obvious that this answer is incorrect, since it is illogical that fewer pupils would finish the job faster! Another incorrect strategy is to use the formula incorrectly, arriving at ? = 7 × 3/21 = 1 hour. Although the reasoning does show some inkling of the idea of inverse proportion, the technique used is faulty. Again, students would immediately perceive that the answer (1 hour) is illogical and that their strategy must be rethought. In class, a discussion concerning difficulties solving such problems should take place, along with suggestions for presentation methods in school. It should be emphasized that most problems concerning work-time/rate are those of inverse proportion; typical problems involve numbers of workers, or pools that are to be filled by two different taps. However, sometimes the context can be misleading. Example 1 The following problem involves workers, but is NOT a rate problem (i.e., inverse proportion) and is thus one of direct proportion. Two workers were hired to do a specific job for $520. After 3 days, one got sick. His partner continued alone and needed 4 more days to complete the job. They decided to split the pay according to the number of days that each worked. How much did each worker earn? Solution: Here, direct ratio is used. The $520 must be divided between the two workers according to the number of days each worked, or in a ratio of 3/7 (the first worked only 3 days, the second worked 3 + 4 =7 days). 192
AUTHENTIC ACTIVITIES—GROUP 5: INDIRECT PROPORTION
x/(520 - x) 7x 7x 10x x
= = = = =
3/7 3 × (520 - x) 1560 - 3x 1560 $156
In other words, the first worker receives $156, and the second receives (520156) $364. Example 2 Another example in which the context may be misleading is the following: A student read two books that had equal number of pages. The first volume he read 1.5 times faster than the second. If it took him 15 days to read both books, how long did it take him for each one? This problem doesn’t have “workers” and thus doesn’t appear to be a work-rate problem, but essentially it is since it is “reading rate,” and it thus an inverse proportion between the speed and the time required. As the speed increases, the time decreases, but their product remains constant. To solve the problem:
x/(15 – x) 1.5x 2.5x x
= = = =
1/1.5 15 - x 15 6
It took 6 days to read the first book and (15-6) 9 days to read the second. Note It should be emphasized that the language in which a problem is presented plays an important task. It may be confusing when terms such as “the speed was greater times 1.5” is used; when the time is calculated there will be the tendency to multiply it by 1.5 instead of dividing it by 1.5.
193
CHAPTER 13
GROUP 6: ADDITIONAL ACTIVITIES FOR PRACTICE AND ENRICHMENT (ALL TOPICS)
Group 6-A: Finding Ratio in Situations of Direct Proportion Group 6-B: Finding Ratio in Situations of Indirect Proportion Group 6-C: Even More Situations with Direct Proportion Group 6-D: Even More Situations with Indirect Proportion
195
CHAPTER 13
Additional Activities: Group 6-A Finding Ratio in Situations of Direct Proportion
The situations below all have some multiplicative relationship (ratio) between the values. Find the ratio between the values and state if the values have the same unit or if a new unit will be generated (e.g. km/h, individuals per square meter, price per unit, etc.). An example showing how to determine whether a new unit is generated. Problem Two partners decide to split the profits from their business according to the number of days per week that each invests in the business. The first works 4 days per week, and the second 6. What is the ratio of the profits that each gets? Answer For every 4 days that A works, B works 6 days. The ratio of the division of profits will be equal to the ratio of days, which is 4/6 (or 4:6), which can be reduced to 2/3 (2:3). Thus, A will receive 2/5 (40%) of the profits and B will receive 3/5 (60%). In this case, the values have the same unit (4 days/6 days), thus the ratio is 2:3 similar to a fraction with no unit attached (sometime called a “pure” ratio). No new unit has been generated. 1) The school library has 450 books in Spanish and 350 books in English. What is the ratio of Spanish to English books? ***** 2) A bus travels 240 km in 3 hours. What is the ratio between the distance that the bus travels to the time? What is such a ratio called? ***** 3) The length of the side of square A is 36 cm, and the length of the side of square B is 60 cm. What is the ratio of the areas of square A and square B? ***** 4) The circumference of a wheel with radius 19.1 cm is 120 cm. What is the ratio between the circumference and the diameter? What is this ratio called? *****
196
AUTHENTIC ACTIVITIES—GROUP 6: ADDITIONAL
5) The distance between two cities on a map is 6 cm. In reality, the two cities are 6 km apart. What is the ratio between the distance on the map and the actual distance? What is such a ratio called? ***** 6) What is the ratio between the number of girls to boys in a group, if it is known that the number of girls is 1.5 times smaller than the number of boys? ***** 7) What is the ratio between a mother’s age and her son’s, if the mother’s age is now 4 times that of her son? ***** 8) Nir’s stamp collection is 2/3 the size of Dan’s collection. What is the ratio between the two collections? If Dan has 450 stamps, how many does Nir have? ***** 9) What is the ratio between two numbers if a) the first is 25% larger than the second; b) the second is 25% smaller than the first. Why are the answers different? ***** 10) What is the ratio between the allowances that the eldest and youngest children get, if the eldest receives 1/5 more than the youngest? General description of the activities The problems above show a variety of situations in which a direct multiplicative relationship between values exists. These relationships may be quantified, that is to say, a ratio between the factors described in the situations can be determined. Point out to the students the wide range of areas where ratio can be found, along with the various ways that they can be described. Occasionally, it may be difficult for the students to pinpoint the multiplicative relationship, quantify it, and determine the ratio.
The purpose of these activities is to discover where problems arise, and how students can be assisted when they do. The following steps should be taken when solving the additional ratio and proportion problems. 1. Read through the description of the problems to appreciate the variety of situations that present multiplicative relationships between values. Discuss the subjects and areas that are familiar to the pupils/students, and familiarize them with other areas of knowledge. In which areas might they have difficulties finding the ratio? 2. Determine what characterizes the situation under study. Analyze it as follows:
197
CHAPTER 13
a) Determine the numerical relationships. Try to write them in more than one way (see the example). In any problem where discovering the ratio proved difficult, discuss the situation and determine what characterizes the problem. Explore with the students where they believe pupils might have difficulty, and how they, as mathematics teachers, can help their pupils overcome these difficulties. b) Determine if the numerator and denominator in the ratio are of the same unit. What significance does this have if they are? (When the numerator and denominator are of the same unit, the ratio is a simple fraction.) c) Determine if the numerator and denominator in the ratio are of different units. What is the significance in this case? (A new unit value is created.) Discuss what typifies a situation in which a new unit value is created? How should the mathematics teacher relate to this new value? What difficulties, if any, may occur with this new value and how can pupils be helped to overcome them? Specific comments and explanations for Group 6-A Activities: Finding Ratio in Situations of Direct Proportion Following are mathematical and psychological-didactic comments relating to aspects of various situations in which a direct ratio exists. The purpose of this exercise is to point out to the students the wide range of areas where direct ratio can be found, along with various ways that it can be described. Emphasize discovering in which situations new units are created, and in which the answer is a pure number. 1) The school library has 450 books in Spanish and 350 books in English. What is the ratio of Spanish to English books? Solution: The ratio of Spanish to English books is 450:350, which can be reduced to 9:7. Comments, explanations and difficulties: This is an obvious ratio without any unit value, as the numerator and denominator have the same units. The result is a fraction that can be reduced. Pupils may tend to write the ratio as 7/9 instead of 9/7 because they are used to fractions where the numerator is smaller than the denominator. Point out that the order of the numbers in a ratio depends on the wording of the problem and cannot be changed at will. ***** 2) A bus travels 240 km in 3 hours. What is the ratio between the distance that the bus travels to the time? What is such a ratio called? Solution: The ratio between distance and time that the bus traveled is 240 km:3 hours, or 80 km:1 hour. Such a ratio (distance/time) is an expression of “velocity,” and in this instance the answer should be written as 80 km/h. Comments, explanations and difficulties: Since the ratio is determined by measuring two different types of quantities (distance and time), the numerator and denominator have different units, and thus a new unit value is produced. The values can be reduced to create this new unit, which describes the motion of the bus. *****
198
AUTHENTIC ACTIVITIES—GROUP 6: ADDITIONAL
3) The length of the side of square A is 36 cm and the length of the side of square B is 60 cm. What is the ratio between the areas of square A and square B? Solution: The ratio between the areas of square A to square B is 362:602, or 1296 cm2:3600 cm2. This can be reduced to 9:25. Comments, explanations and difficulties: The actual ratio that is asked for is rather hidden, as the values given in the problem are not the values requested. That is, the values given are those of lengths of the sides, whereas the ratio asked for is for area. The numerator and denominator have the same units, and thus there is no new unit value created. Difficulties arise if pupils think that the ratio between lengths of sides is the same as ratio between areas, which is incorrect. Area does not increase by the scaling factor (as perimeter, e.g., does: if the lengths of the sides of one square is 4 times the lengths of another, the ratio between the sides of the two squares will be identical to the ratio of their perimeters). Area, on the contrary, is a multiplicative enlargement of one side by the other side and thus the area changes by a different factor each time. The area being a product of two linear quantities, is a quadratic value. Another difficulty may arise when reducing the ratio of 362:602 . Students/pupils may incorrectly think that they may simply “cancel out” the superscript (the exponent) when reducing the numerator and denominator, thus giving a wrong answer of 36:60, or to 3:5. By writing the fraction out in full (36x36:60x60) it should be obvious that this is not possible. Point out that the correct answer may also be derived by first determining the ratios of the sides, and THEN squaring: 36:60 = 3:5 (ratio of the sides) 32:52 = 9:25 (ratio of the areas). ***** 4) The circumference of a wheel with radius 19.1 cm is 120 cm. What is the ratio between the circumference and the diameter? What is this ratio called? Solution: The ratio is 120 cm: 38.2 cm = 3.14136...:1 The number 3.14136... is, of course, the number π (pi). Comments, explanations and difficulties: The ratio to be determined is obvious. The same units (cm) are in both the numerator and denominator and so no new unit is formed. The ratio becomes a fraction that, when reduced (with denominator = 1), will yield the special number π, pi, which should be clarified in class. In this case, we divide two rational numbers, hence the result is also rational number; as a result the solution for π (pi) is only approximation since it is known that π is irrational number meaning that in its decimal representation it is nonterminating and non-recurring/non-repeating decimal. ***** 5) The distance between two cities on a map is 6 cm. In reality, the two cities are 6 km apart. What is the ratio between the distance on the map and the actual distance? What is such a ratio called?
199
CHAPTER 13
Solution: The ratio is 6cm:6km, which is converted to 6cm:600,000 cm, or 1:100,000. This ratio is called “scale.” Comments, explanations and difficulties: The ratio is obvious. Both the numerator and denominator describe a measurement of length. Care must be taken to ensure that they are identical units (in this case, changing the km to cm). Difficulties may arise in converting both lengths to the same unit, and in reducing the fraction. In addition, it should be pointed out that scale is generally expressed with the numerator as “1”; the numerator indicating the unit on the map or diagram, and the denominator indicating the actual length. ***** 6) What is the ratio between the number of girls to boys in a group, if it is known that the number of girls is 1.5 times smaller than the number of boys? 1 :1 = 1:1.5= 2:3 Solution: 1.5
Another way of solving this is 1:1.5 = 1:
2 3 = 1 x = 2:3. 3 2
Comments, explanations and difficulties: Here the ratio is not obvious and difficult to quantify. The values given do not give any numbers relating to the actual number of boys and girls, and in fact gives the multiplicative relationship only. Providing an actual (numerical) example is helpful. Explain to the pupils that if the number of girls is 1.5 times smaller than the number of boys, then the number of boys is 1.5 times greater than the number of girls (This is true for all multiplicative relationships: if value a is greater k times than value b, then value b will be smaller k times than value a.) If we represent the number of girls by “1” (being the smallest and easiest number with which to work), the number of boys will be 1.5. Conversely, if the number of boys is represented by “1.”, then the number of girls will be 1/1.5. 1 :1 (or Another difficulty may be encountered understanding how the ratio 1.5 1/1.5:1) is converted to eventually arrive at 1:1.5 or 2:3. This should be clarified in class. ***** 7) What is the ratio between a mother’s age and her son’s, if the mother’s age is now 4 times that of her son? Solution: The ratio between the age of the mother to the age of her son is 4:1. Comments, explanations and difficulties: This ratio is similar to exercise 6, yet much simpler, as whole numbers are used. The numerator and denominator have the same units, and thus the ratio is without units. The age of the son is represented by “1” and thus the mother’s age will be four times that, in other words, “4.” It will
200
AUTHENTIC ACTIVITIES—GROUP 6: ADDITIONAL
be interesting to discuss with the students/pupils possible ages for the mother and her son in this situation. ***** 8) Nir’s stamp collection is 2/3 the size of Dan’s collection. What is the ratio between the two collections? Solution: The ratio between the number of stamps of Nir and Dan is: 2 :1 = 2:3 3
Comments, explanations and difficulties: The ratio is hidden as there is no information on the actual number of stamps and the multiplicative relationship is given indirectly, that is one value is expressed by enlarging or reducing the other value by a certain factor. That is to say, either one of the values is expressed as a fraction of the other, and thus is smaller by a certain amount (as in this case), or one of the values comprises the second plus an extra part. For example, if the number of stamps that Nir has is 1.5 times Dan’s, then one of the factors will be 1.5 times the other. It should be explained that in such cases, the value with which one starts (the one that is increased or decreased—in this case the number of stamps that Dan has) is represented by “1” (the unit, or the “whole”), and the second factor (here, Nir’s stamps) is enlarged or reduced accordingly. So, the number of stamps that Dan has is represented by 1, and the number of 2 2 stamps that Nir has is represented as 2/3 of 1, that is 1 × = . In this case, the 3 3 2 ratio of the number of stamps of Dan:Nir is thus 1: or 3:2. 3 The ratio is a pure number, without units. ***** 9) What is the ratio between two numbers if a) the first is 25% larger than the second; b) the second is 25% smaller than the first. Why are the answers different? Solutions: a) 125%:100% = 125:100 = 5:4. b) 100%:75% = 100:75 = 4:3. Comments, explanations and difficulties: The ratio is hidden. Similar to question 8, above, the value that is 100% is the one from which the other value is derived by enlarging or reducing by the required percentage. The phrasing of the question is important and attention must be paid to discern which value, indeed is the “whole” (100%) one, and how the second is derived from it. Obviously the location of the 100% determines the difference between the two cases a) and b). 201
CHAPTER 13
It is important to emphasize the difference between enlarging or reducing by a given number, and enlarging or reducing by a percentage. Enlarging a number by 25% and then reducing it by 25% will not yield the original number, whereas enlarging a number (for example, 100) by 25, and then reducing the result by 25 will return to the original number (100 + 25 = 125 125 - 25=100). ***** 10) What is the ratio between the allowances that the eldest and youngest children get, if the eldest receives 1/5 more than the youngest? Solution: Allowance of the oldest: allowance of the youngest 1 6 1 :1 = :1 = 6:5. 5 5
Comments, explanations and difficulties: The requested ratio is hidden, as actual values are not given, only the multiplicative relationship between them. The explanation is identical to the problem with percentages (see question 9), however in this case “1” represents the whole, and not 100%.
202
AUTHENTIC ACTIVITIES—GROUP 6: ADDITIONAL
Additional Activities: Group 6-B Finding Ratio in Situations of Indirect Proportion
The following situations all have some inverse multiplicative relationship (ratio) between the values. Find the ratio between the values and state if the values have the same unit (and the answer is without any unit) or if a new unit is generated (e.g. km/h, individuals/square meter, price per unit, etc.). 1) A father and son are playing on a seesaw at a playground. The father weighs 76 kg and the son 38 kg. What should the ratio of their distances from the fulcrum (pivot point of the seesaw) be in order that they will be at equilibrium. ***** 2) Seven workers were given a job to do. Four fell sick, not being able even to start, and the remaining three finished up the job. What is the ratio between the number of days that the entire group should have taken to the number of days that the smaller group needed? ***** 3) Two cars are traveling the same route. The first car travels at 60 km/h, and the second at 80 km/h. What is the ratio between the times that the first and second car needs to complete the distance. ***** 4) Two wheels, one (A) with circumference 120 cm and one (B) with circumference 80 cm, rotate over the same distance. What is the ratio of revolutions that the two wheels make? What is the ratio of the radii of the two wheels? ***** 5) In order to weigh a very heavy mass, an unequal-arm balance is constructed. What should the ratio of the arms be so that a mass of 10 kg will be able to balance one of 800 kg? General description of the activities The problems above show a variety of situations where an indirect multiplicative relationship between values exists. These relationships may be quantified, that is to say, a ratio between the factors described in the situations can be determined. Point out to the students the wide range of areas where inverse ratio can be found, along with the various ways that they can be described.
Occasionally, it may be difficult for the students to pinpoint the indirect multiplicative relationship, quantify it, and determine the ratio. The purpose of these activities is to discover where problems arise, and how students can be assisted when they do. 203
CHAPTER 13
The following steps should be taken when solving the additional ratio and proportion problems. 1. Read through the description of the problems to appreciate the variety of situations that present multiplicative relationships between values. Discuss the subjects and areas that are familiar to the pupils/students, and familiarize them with other areas of knowledge. In which areas might they have difficulties finding the ratio? 2. Determine what characterizes the situation under study. Analyze it as follows: a) Determine the numerical relationships. Try to write them in more than one way (see the example). In any problem where discovering the ratio proved difficult, discuss the situation and determine what characterizes the problem. Explore with the students where they believe pupils might have difficulty, and how they, as mathematics teachers, can help their pupils overcome these difficulties. b) Determine if the numerator and denominator in the ratio are of the same unit. What significance does this have if they are? (When the numerator and denominator are of the same unit, the ratio is a simple fraction.) c) Determine if the numerator and denominator in the ratio are of different units. What is the significance in this case? (A new unit value is created.) Discuss what typifies a situation in which a new unit value is created? How should the mathematics teacher relate to this new value? What difficulties, if any, may occur with this new value and how can pupils be helped to overcome them? Specific Comments and Explanations for Group 6-B Activities: Finding Ratio in Situations of indirect Proportion Following are mathematical and psychological-didactic comments relating to aspects of various situations in which inverse ratio exists. The purpose of this exercise is to point out to the students the wide range of areas where inverse ratio can be found, along with various ways that it can be described. Emphasize discovering in which situations new units are created, and in which the answer is a pure number. 1) A father and son are playing on a seesaw at a playground. The father weighs 76 kg and the son 38 kg. What should the ratio of their distances from the fulcrum (pivot point of the seesaw) be in order that they will be at equilibrium? Solution: The distance of the father from the axis is represented by h1, and the distance of the son as h2. The weights are represented as w1 and w2, respectively. The ratio between the distances when the seesaw is in equilibrium will be indirect, and will be: h1 w2 38 1 = = = h 2 w1 76 2
In other words, in order to achieve equilibrium, the son’s distance from the fulcrum must be twice that of the father. On a seesaw with 1.2-meter arms, if the son sits at the end, the father must sit 0.6 meter away from the axis. 204
AUTHENTIC ACTIVITIES—GROUP 6: ADDITIONAL
Comments, explanations and difficulties: The requested ratio is hidden. The weights are given and the distances from the axis must be determined. The solution involves the physical law of equilibrium (which is true for both beams and balances). The rule states that in order to achieve equilibrium, the products of the weight of each of the objects and their distance from the center must be equal. Mathematically, it is expressed as h1 × w1 = h2 × w2. The relationship between h1 and w1 (or h2 and w2) is also ratio but with multiplication rather than division. The resulting ratio in most cases creates a new unit, as in this case the new unit is meter x kg. From this, it can be concluded that if the weight of the object increases, its distance must decrease, and vice versa, since the product must remain constant. That is, if one weight is increased by constant, k, the distance must be decreased by k, and vice versa. Thus, the ratios between the weights and the distances can be expressed as, h1/h2 = w2/w1, which can be seen to be an indirect ratio. Some students may have difficulty understanding the concept of equilibrium, and a hands-on demonstration using Lego© (or similar) to build a balancing beam or a balance could be very useful. ***** 2) Seven workers are given a job to do. Four fell sick, not being able even to start, and the remaining three finished up the job. What is the ratio between the numbers of days that the entire group should have taken to the number of days that the smaller group needed? Solution: Let the time required by the larger group (group one) be represented by t1, and the time required by the smaller group by t2. The number of workers in each group will be represented by n1 and n2, respectively. The ratio between the times that each group must work is t1/t2 which is inversely proportional to the number of members in the group (n2/n1), or 3/7. Comments, explanations and difficulties: The ratio is hidden. The students must understand that the total number of worker days needed to complete the job is identical in both instances, and is equal to the number of workers (n) times the number of days each works (t). This value is constant, pointing to the existence of an inverse ratio—fewer workers need more time. Another aspect is to focus on the time— if the job must be completed sooner (fewer number of days), then the number of workers needed increases. To solve the problem: Seven workers would have worked t1 days, so total worker-days would have been 7 × t1, which must remain constant. With only 3 workers, t2 will obviously be larger than t1, and 3 × t2=7 × t1. Thus t2 = 7/3t1, or t1/t2 = 3/7 = n2/n1 The ratio between the times required by each group will be: t1/t2 = n2/n1. ***** 3) Two cars are traveling the same route. The first car travels at 60 km/h, and the second at 80 km/h. What is the ratio between the times that the first and second car needs to complete the distance.
205
CHAPTER 13
Solution: Let the time traveled by the first car be t1, and the time traveled by the second car be t2. The ratio between the times of the second to the first car will be t2/t1= v1/v2 = 60/80 = 3/4. Comments, explanations and difficulties: The ratio is hidden: there is no information on actual times, so the ratio must be determined from the velocities of the two cars. The distance traveled by both cars is constant, and is, in essence, the product of a car’s velocity and the time it travels at that velocity. If velocity increases, time, naturally, decreases for the same distance. The velocity of the first car is represented by v1, and the second v2, and thus the distance in both instances will be v1 × t1 = v2 × t2. By dividing both sides of the equation by v2 x t1, an inverse ratio between time and velocity is obtained. Mathematically, v1 × t1 = v2 × t2, or v1/v2 = t2/t1. There is inverse ratio between velocity and time (given that the distance is constant) and this relationship creates the unit of the distance such as meter or km (for example: km/h x h = km). It should be pointed out that in cases where velocity is kept constant, there will be a direct ratio between distance and time. In other words, the ratio of distance to time remains constant—if distance increases, so will the time, and vice versa. On the other hand, if distance is kept constant, then the ratio between velocity and time is indirect (the faster the car, the less time, and vice versa). ***** 4) Two wheels, one (A) with circumference 120 cm and one (B) with circumference 80 cm, rotate over the same distance. What is the ratio of revolutions that the two wheels make? What is the ratio of the radii of the two wheels? Solution: The number of revolutions of wheels A and B will be represented by n1 and n2, respectively. Their circumferences will be represented by p1 and p2, respectively. The ratio between the number of revolutions that the first wheel must make to the second is: n1:n2 = p2:p1 = 80:120 = 2:3. The ratio of the radii of the two wheels equals to the ratio of the circumferences of the wheels (direct ratio): r1:r2 = c1:c2 = 120:80 = 3: 2. Comments, explanations and difficulties: The requested ratio is hidden, since there is no information on the number of revolutions that either of the wheels makes, nor the distance, and the ratio must be found based on the information of their circumferences only. The answer is based on the fact that a given distance covered by the wheel, is, in essence, the product of its circumference and the number of revolutions required to complete the given distance. When the circumference of a wheel is greater, fewer revolutions are required to cover the same distance. Thus, for a given distance c1 × n1 = c2 × n2. In the case of the ratio between circumferences and number of revolutions, an inverse proportion is obtained, namely: c1 × n1 = c2 × n2 c1/c2 = n2/n1 *****
206
AUTHENTIC ACTIVITIES—GROUP 6: ADDITIONAL
5) In order to weigh a very heavy mass, a scale of unequal-arm balance is constructed. What should the ratio of the arms be so that a mass of 100 kg will be able to balance one of 800 kg? Solution: The ratio between the length of the arm (d1) holding the lighter weight (w1) to the length of the arm (d2) holding the heavier weight (w2) is d1/d2 = 800 kg/100 kg = 8:1. In other words, for each unit of the second arm, the first must be 8 times the length. For example, if the second arm is 1 meter, the first one must be 8 meters. (Note: In theory, the problem is straightforward to solve. In actuality, a balance of this size would have to be of extremely sturdy construction. The practicality of this method may be discussed with the students.) Comments, explanations and difficulties: The requested ratio is hidden—there is no information on the actual lengths of the arms and the ratio is determined only from the relation of the weights. The logic is based on the fact that equilibrium occurs when the products of length of the arms times mass at each end are equal. If the weight increases, the length of the arm must decrease. Mathematically: w1 × d1 = w2 × d2 w1/w2 = d2/d1. In this representation of division it is obvious that there is no new unit produced, as the numerator and denominator are of the same unit on both sides of the equation. Nevertheless, the inverse ratio between the weight and the length of the arm does create a new unit: kg x meter. A demonstration of the inverse ratio is valuable and the students should be given an opportunity to experiment in class.
207
CHAPTER 13
Additional Activities: Group 6-C Even More Situations with Direct Proportion8 1) In a middle-school survey, pupils were asked who prefers to listen to the radio and who prefers to watch television. The survey found that 60 pupils preferred to watch television and 40 preferred to listen to the radio. Below are 6 statements that compare between the given data. For each statement, state whether it can be true according to the data presented, and try to explain your reasoning. Choose the statement(s) which, in your opinion, best describe the comparison made between the pupils that like watching television and those that like listening to the radio. Explain your reasoning. a) The ratio of pupils that prefer watching television to those that prefer to listen to the radio is 6 to 4. b) The number of pupils that prefer watching television is greater by 20 than the number that prefers listening to the radio. c) The ratio between the number of pupils that prefer watching television to those that prefer listening to the radio is 3:2. d) The number of pupils that prefer watching television is 1.5 times greater than those that prefer listening to the radio. e) 60% of pupils prefer watching television to listening to the radio. f) 2/5 of the pupils prefer listening to the radio. ***** 2) An advertisement for a brand of bread used the statistics that 5 to 3, and also 18,095 to 10,857, people preferred one brand of bread over another. a) Write four different ratios that have the same implication. Use pairs of numbers that describe the same ratio between those that preferred each brand of bread. Explain your reasoning. b) Ratios are often expressed as fractions. For example 3/2 can be a representation of the ratio 3 to 2. What mutual relationships/ operations can be found between finding proportions between equal ratios and comparing fractions? Explain your reasoning. Didactic note
This question can be used to initiate a discussion in class on applying the rules and properties of fractions (see Part II, Theoretical Background, Chapter 4, Mathematical Properties of the Concepts of Ratio and Proportion). ***** –––––––––––––– 8
Some of the exercises presented in this section (1-28) have been adapted from the CMP-Connected Mathematics Project (2002) with minor alteration.
208
AUTHENTIC ACTIVITIES—GROUP 6: ADDITIONAL
3) Below is a suggestion for some wording for a chewing gum advertisement. Try to suggest more effective wording. Explain your reasoning.
Juicy Sugarless Chewing Gum Three thousand, seven hundred and fourteen dentists out of the four thousand, nine hundred and fifty two that tried Juicy Sugarless Chewing Gum, now recommend chewing it as often as possible to their patients.
***** 4) Karin arrived late to a party at a pizza place. When she came in, she saw her friends sitting around 3 tables, on which were delicious pizzas as follows: At Table A were 5 friends and 2 pizzas; At Table B were 12 friends and 5 pizzas; At Table C were 7 friends and 3 pizzas. At each table there was an empty chair, and she had no preference with whom she wanted to sit, so she wanted to sit where she would get the biggest portion of pizza. Where do you suggest she sit? Explain your reasoning. ***** 5) In a grade 6 class there are 18 boys and 12 girls. Write the relationship between the numbers of boys and girls using at least three different methods. Explain why each method still refers to the same ratio. ***** 6) The traffic from the suburbs to the city is so dense that every morning Sarah drives 10 km in 15 minutes, and Rudy drives 23 km in 30 minutes. Whose average speed is faster? Explain your reasoning. ***** 7) Two friends are riding their bikes. Yael rides 8 km in 23 minutes, and Ayelah rides 3.5 km in 10 minutes. Who rides faster? Explain your reasoning. ***** 8) A store sells cereal at 5 boxes for $8.65, and a second store sells the same cereal at 2 boxes for $3.50. Where is the value-for-money better? Explain your reasoning. ***** 9) The following table presents data on the number of new book titles published in one of the Western countries in 1999 and 2009, showing total number, and a few categories.
209
CHAPTER 13
Total New Titles By category: Art Education Science Fiction Young Adult Fiction Literature
1999 42,377
2009 46,738
1691 1011 2835 2859 1686
1262 1039 5764 2049 2049
a) Using subtraction, give the difference in the numbers of new titles for 1999 and 2009 (for the total number and for each category). E.g., find the difference between the number of new science fiction titles published in 1999 and 2009. b) Using ratios, fractions and percentages, describe the changes in the number of books in each category between 1999 and 2009. E.g., find the fraction or the percentage of the new titles of art books in 1999 vs. 2009. c) Questions a) and b) use various ways of comparison. Explain the differences between the methods, and explain the reasoning for choosing each one. d) Which method would you choose if - you were a reporter describing the changes in consumer behavior and interest in books that have occurred over the decade? Why? - you were a university professor trying to reveal the trends over time in the area of book publishing? Why? ***** 10) Suggested Classroom Activity. Have pupils conduct a study to determine if there is a correlation between the length of foot and shoe size. Have each of them measure their feet (by placing a ruler on the floor and stepping on it). Using this measurement and their shoe size, create a table to determine if there is a correlation and if it is possible to predict which foot length requires which shoe size. ***** 11) Write instructions for a friend explaining how to estimate the number of fish in a tank. Explain what thinking process should be used for each situation below in order to arrive at the best estimate for each tank. a) A biologist took a sample of 100 fish from the tank, marked each one with a red clip on its tail, and then released them back into the tank. He then took a second sample of 80 fish (from the same tank) and found that four of the fish had a marker. b) A diver entered a pool with a total bottom area of 750 square meters. In an area of 100 square meters he counted 30 fish.
210
AUTHENTIC ACTIVITIES—GROUP 6: ADDITIONAL
c) Park rangers caught and marked 40 fish from a pond, and released them back into the pond. Over the next month, they took samplings. On an average, they found that 30% of the fish in their sample were marked. ***** 12) Avi took some samples out of a jar of beans in which there were 150 yellow beans dispersed amongst the others. (Note: after each sampling, he returned all the beans to the jar before removing the next sample.) His findings are presented in the following table: Sample Size
25
50
75
100
150
200
250
Number of Yellow Beans in Sample
3
12
13
17
27
38
52
Percent yellow beans in sample
12
a) Complete the table (percentages). b) Draw a graph illustrating total number of beans in the sample vs. number of yellow beans in the sample. Describe the relation between the total number of beans in the sample and the expected number of yellow beans. Derive a formula that expresses this relation. c) Draw a graph illustrating number of beans in the sample vs. percent yellow beans in the sample and describe the relationship between the two values. Derive a formula that expresses this relation. ***** 13) Yael wanted to estimate the number of beans in a jar. She took out 150 beans and painted them yellow. She returned them to the jar, mixed it well, and then took out four samples as follows: Number of Beans in Sample Sample 1 Sample 2 Sample 3 Sample 4
25 75 150 250
Number of Yellow Beans in Sample 2 10 23 38
How many beans do you estimate are in the jar? Explain your reasoning. ***** 211
CHAPTER 13
14) Describe a method for counting the number of leaves that are littering a sports field without having to count each individual leaf. ***** 15) A factory that manufactures light bulbs found, after many, many samplings, that 2 out of every 1000 light bulbs had some defect. Every year, over a billion light bulbs are purchased in the USA. Estimate how many defective light bulbs are sold every year. Explain your reasoning. ***** 16) A teacher asked the students in her grade 6 class which rock band out of three they preferred. Each pupil could only choose one band. For the class of 35, the results were: Band A: 20, Band B: 8; and Band C: 7. a) Would you expect the same results (ratio-wise) if 10 pupils in another grade6 class were asked the same question? Why or why not? b) Would you expect the same results if any 10 pupils from the same school were asked the same question? Why or why not? c) What is the difference between questions a) and b)? Explain your reasoning. ***** 17) Left-handed vs. right-handed. Count the number of left-handed and righthanded pupils in your class. Assuming that the class is a good representative of the population of the country, how many left-handed people can you estimate are in the country? Write a description of the method and results, and discuss whether it is a valid estimate of the actual number of left-handed people in the country. ***** 18) Two friends traveled at exactly the same speed. The first traveled 8 km in 24 minutes. How far will the second travel in 6 minutes? ***** 19) Vinegar contains 5.4% acetic acid. How many ml of acetic acid would be in 50 ml of vinegar? ***** 20) Below are values given by the manufacturer of a brand of chocolate syrup: Grams of chocolate syrup 50 150 300 500
212
Calories 150 450 900 1500
AUTHENTIC ACTIVITIES—GROUP 6: ADDITIONAL
a) How many calories would be consumed in 75 grams of syrup? b) How many grams of syrup need to be eaten to consume 1000 calories? c) Draw a graph illustrating the data and give the equation for the number of calories per gram of syrup. d) A chocolate cake weighs 1 kg and contains 20 g of syrup for every 100 g of cake. How many calories would we “save” by using “diet” syrup that had no calories whatsoever? ***** 21) A juice manufacturer packs its juices in various types of containers. a) Complete the table, indicating how many of each container is needed to pack 240 liters of juice. Container volume (in liters)
10
4
2
1
½
¼
1/10
No. of containers required for 240 liters of juice
b) For each container, derive the formula that gives the number of containers (n) required for a certain volume of juice. c) The factory decides to package 240 liters of apple juice in ½-liter cartons. If the amount of juice manufactured increases by 20%, how many ½-liter cartons will they require? d) State the difference between questions a) and b) with respect to the concept of ratio and proportion. ***** 22) Orit and Michael love to play basketball together. They compare their results for free shots. Out of 500 throws, Orit managed to score 275 baskets. Michael scored 180 out of 300 throws. a) Compare the results. Who is the better player? b) During a neighborhood basketball game, Orit threw 40 shots and Michael threw 35. If we assume that their success rate (as calculated in a) didn’t change, how many baskets did each one score? c) How does their success rates change if they each try 10 more shots, and are successful each time. Calculate for their results in both situations. ***** 23) A local grocery store is having a special sale on packets of cookies. It is selling 2 packets for $3. a) How many packets can be bought with $20? b) If the price is raised by 7%, how many packets can then be bought with $20? ***** 213
CHAPTER 13
24) The 32 pupils in grade 6 were asked to specify in which sport(s) they wished to participate. The results are shown in the table below. Sport Basketball Gymnastics Baseball Total in Class
Girls 14 7 10 17
Boys 13 13 8 15
a) b) c) d)
What portion of the class are girls? What percentage of the class are girls? What is the ratio of girls to boys? What is the ratio between the number of participants in basketball to the number of participants in gymnastics? e) Which sport has the highest percentage of participants from the whole class? f) In which sport the percentage of boys participating is the highest? g) In which sport is the percentage of girls participating higher than the boys? *****
25) A study of the physical activity of 270,628 people yielded the results in the table below: Table. Physical Activities Among Various Portions of the Population
a) b) c) d) e)
Physical Activity
Men 18-54
Women 18-54
Adolescents 12-17
Adults 55-64
Swimming
30,833
35,348
9,959
3,153
Bicycle riding
26,896
27,067
9,327
2,617
Camping
24,572
22,505
5,244
2,727
Walking
24,708
44,851
2,850
8,600
Fishing
28,664
13,114
4,054
2,831
Total
111,112
117,643
20,716
21,157
What portion of the sample do adults over 55 who walk represent? What is the preferred sport of the men? of the women? What portion of those who walk are 12-17-year-olds? What is the most popular activity among the 12-17-year-olds? After answering the above questions, write a description of the comparisons between the various age groups that participate in walking. *****
214
AUTHENTIC ACTIVITIES—GROUP 6: ADDITIONAL
26) In a large city there are 3 playgrounds. One is 5,000 m2, the second is 7,235 m2, and the third is 3,060 m2. a) On a particular day, there are 400 children in the first playground, 630 in the second, and 255 in the third. Which playground is most crowded? Explain your reasoning. b) Which playground is the second-most crowded? Explain your reasoning. c) Outside the city is another playground with an area of 5240 m2. On that same day there were 462 children there. How can the density with the other playgrounds are compared. Explain your reasoning. ***** 27) Below are two diagrams of college student dorms. The larger room is intended for two students and the smaller for a single student. Both rooms are rectangular. a) Are the rectangles similar? b) What is the area of each room? c) Which room gives its occupants more space? Explain your reasoning. d) How should the dimensions of each room be changed so that the same ratio (space per person) is maintained, but there will be sufficient area for 4 students? Explain your reasoning. *****
Figure 6C-1. Diagrams of Dorm Rooms
28) Mathematical Reflection. The previous problems required comparisons between values. Various strategies using several methods were applied : a) Ratios – comparison by ratios. E.g., in a brand of bread samples, the ratio of participants that preferred brand A over brand B was 5:3.
215
CHAPTER 13
b) Differences – comparison by differences. E.g., the number of participants that preferred brand of bread A was 7,238 greater than those that preferred brand of bread B. c) Fractions – comparison by fractions. E.g., the number of participants who preferred brand of bread B constitutes 3/5 of participants preferred brand of bread A. d) Percent – comparison by percents. E.g., 28% percent of American children between 12-17 years attend some type of summer camp. e) Rates – comparison by rates. E.g., Mary's car uses 19 liters of gasoline to travel 290 km. Note Terms used are often dependent on what is being described and the data. Review your answers and find examples for each of the above terms, and explain why the term was chosen. Find examples where you believe a different way of expressing the results could be justified. Explain your reasoning.
216
AUTHENTIC ACTIVITIES—GROUP 6: ADDITIONAL
Additional Activities: Group 6-D Even More Situations with Indirect Proportion 1) Below is an illustration of a balance in equilibrium. The arms of the balance are not equal (a ≠ b). If the 300-gram weight is moved one step to the left, in which direction, and by how much, must the 200-gram weight be moved to keep the balance in equilibrium? Explain your reasoning in detail.
Figure 6D-1. Balance in State of Equilibrium
***** 2) Two children want to balance on a board so that it will remain perfectly level. They weigh 40 kg and 55 kg, respectively. The total length of the board is 3.8 m. Where should the pivot point be placed? Draw a diagram of the board, indicating which child (40 kg or 55 kg) is at which end, where the pivot point is, and what the length of each side is. ***** 3) Give an explanation of equilibrium of a balance that would be appropriate for elementary-school pupils. ***** 4) Explain how an unequal-arm balance can be used to measure out a quantity of 8.50 kg, using an 85 kg weight. Draw a diagram. ***** 5) An unequal-arm balance is in equilibrium. The arms are 35 cm and 85 cm. At the end of one arm the weight is 700 grams. What is the weight of the object at the other arm (2 answers possible). Explain your reasoning. ***** 6) A boy and a girl who weigh 24 kg and 12 kg, respectively, want to play on a seesaw of 3 meter long. Where should the boy sit so that the girl won’t have to work too hard? ***** 217
CHAPTER 13
7) Two wheels are moving concurrently. The circumference of the larger wheel is 60cm, the circumference of the smaller wheel is 40 cm. Over a certain distance, it is known that the larger wheel rotates 20 times less than the smaller wheel. What is this distance? ***** 8) In the morning, it takes one hour for Tom to drive to work at an average speed of 80 km/h. How long will it take him to return home in the evening if the traffic is heavy and he can travel at an average speed of only 60 km/h? ***** 9) Two cars are traveling the same route. One travels at 100 km/h and the second at 80 km/h. What is the ratio between the times that each takes? ***** 10) If 5 workers can perform a job in 12 days, how many workers are needed to get the job done in only 3 days? ***** 11) If 6 painters can paint a room in 7 hours, how long will it take to paint the same room if there are only 4 painters? (All the painters work at the same rate and concurrently.) ***** 12) A student read two volumes of a book. Each volume was the same number of pages, but she read the first volume 1.5 times faster than the second. If it took her 15 days to read both volumes, how many days did it take her for each? ***** 13) A crate holds 40 kg of mangos. The grocer calculated that to make a fitting profit, he must charge $9 per kg of the fruit. He then discovered that 4 kg of the mangos were rotten and would need to be discarded. How much must he charge for the remaining fruit (per kg) so that he can still earn the same amount? ***** 14) A single pipe has the capacity to fill a pool of 480 cubic meters in 10 hours. a) How long will it take the same pipe, at the same rate of flow, to fill a pool of 672 cubic meters? b) How long will it take two pipes, at the same rate of flow, to fill the pool of 672 cubic meters?
218
PART FOUR
ASSESSMENT TOOLS
Chapter 14:
Introduction to Assessment Tools
Chapter 15: Chapter 16: Chapter 17:
Attitude Questionnaire
Questionnaire for Assessing Mathematical Knowledge Assessing Research Reports and Building a Student Portfolio
219
CHAPTER 14
INTRODUCTION TO ASSESSMENT TOOLS
The link between assessment and learning is widely acknowledged and highly significant. Sainsbury and Walker (2007), for example, mention four functions of assessment that directly influence student learning: motivating learning, focusing learning, consolidating and structuring learning, and guiding and correcting learning. Rust (2007) concludes that "any scholarship of assessment must therefore be predicated on the value that good assessment supports and positively influences student learning." Brown (2004) clearly states that "teachers' pedagogy is influenced by their beliefs about teaching, learning and assessment.” Harrison (2007) confirms that a central challenge for teacher educators internationally is the measurement and demonstration of specific outcomes in teacher education. He also states that teacher knowledge and teacher expertise clearly have significant influences on pupils’ learning. Based on such perspectives, Chamberlin, Powers and Novak (2008) surveyed a group of mathematics teachers in a professional development course on their perceptions of assessment as a tool to enhance their mathematical knowledge. The researchers were surprised by the overall results, finding that the teachers felt that assessment had an impact on their learning by encouraging them to study more than they would have had they not been assessed. Birenbaum and Rosenau (2006) examined the effect of introducing authentic activities into a pre-service teaching program, and then compared the learning orientations, strategies and assessment preferences of the pre-service teachers, with those of in-service teachers. The result of their study showed that in-service teachers exhibited a deeper approach to learning and assessment due to their constant engagement in meaningful learning experiences. Another valuable paper on this issue is that of the Australian Association of Mathematics Teachers (AAMT) Inc. (2008) in which the authors state that assessment in mathematics education should be in ways that are appropriate; fair, inclusive, and provide information and feedback to the students on the progress of their learning and action. An elaboration of each statement is provided in the paper. Another study that pre- and post-service teachers should be aware of is that regarding the diagnostic assessment of children's proportional reasoning by Misailidou and Williams (2003), who created a “proportional reasoning item bank” from the relevant literature and tested it in various forms. Following identification of significant errors, they formed an empirical hierarchy of pupils’ attainment of proportional reasoning, incorporating the significant errors and the additive scale. According to the NCTM Assessment Standards for School Mathematics (NCTM, 1995), assessment is defined as a process of gathering evidence about a 221
CHAPTER 14
student's knowledge of, ability to use, and disposition towards mathematics and of making inferences from that evidence for a variety of educational purposes. Taking this definition into account, it can be appreciated why the teaching model (see Part One, Chapter 3) includes modules to evaluate pre-service teachers’ knowledge and attitude both before and at the culmination of the teacher training course. To this end, therefore, two questionnaires are included below, the first, to test the teachers’ attitudes to the topic and their teaching thereof, and the second to test the teachers’ mathematical content knowledge and pedagogic knowledge. In addition, since the study and analysis of research reports is also an important component of the teaching module, guidelines (for students) for assessing research reports along with guidelines (for instructors) for evaluating their students’ competence in handling such reports are presented in Chapter 17, along with instructions for compiling a student portfolio. ATTITUDE QUESTIONNAIRE
Chapter 15 presents an attitude questionnaire along with comments and explanations. The purpose of this questionnaire is to determine how pre-service teachers, prior to the course, and then after it, perceive the topic of ratio and proportion in general, and also how they evaluate their feelings about their ability to teach the topic. Twenty statements rate their views on teaching mathematics in general, their confidence in teaching the subject, their perception of difficulties they may have teaching it, and their feelings of the importance of teaching the subject. In addition, three open-end questions elicit didactic evaluation of the concepts. Following the questionnaire, a discussion of the statements themselves and an analysis of results obtained from several groups of pre-service teachers to whom the questionnaire was administered are presented. Please note: The attitude questionnaire should be given to the pre-service student teachers (or in-service teachers) before the diagnostic one. DIAGNOSTIC QUESTIONNAIRE
The diagnostic questionnaire on content knowledge presented in Chapter 16 is designed to evaluate the knowledge level of the students prior to the course and then, as a post-course test, to evaluate progress made. It comprises two parts: a set of brief investigative questions regarding the topic of ratio and proportion, and a set of fraction problems. The investigative problems are divided into three sub-topics: rate/capacity ratio problems (price per unit, speed, density, etc.); ratio problems (i.e., “pure ratio”); and scaling exercises (stretching and shrinking). For all the exercises, it is important to demand detailed, written solutions in order to assess the understanding and thinking processes of the students.
222
INTRODUCTION TO ASSESSMENT TOOLS
A sample questionnaire that was given to pre-service teachers at a teachers college and the analysis of its results can be found in several research reports [BenChaim, Ilany, & Keret (2002), Keret, Ben-Chaim, & Ilany (2003), and Ilany, Keret, & Ben-Chaim (2004)]. In addition, an article by Ben-Chaim et al. (1998) explains how to analyze data obtained by administration of such a test. The fraction problems are to assess how students solve simple fraction problems that are not based on verbally phrased questions. The diagnostic questionnaire is also appropriate for assessing middle and elementary school pupils' knowledge after they have completed their study of the topic of ratio and proportion. The paper by Ben-Chaim et al. (1998) also gives details of a study of middle-school pupils that used a short form of this diagnostic questionnaire to test and analyze their achievements and solution strategies with respect to rate/capacity problems. At the end of the chapter, specific results obtained from pre-service student teachers and from middle school students are presented and discussed. GUIDELINES FOR ASSESSING RESEARCH REPORTS AND PREPARING A PORTFOLIO
Assessing Research Reports
Because the analysis of scientific articles and research reports is a key part of the teaching model for this course of studies, Chapter 17 provides Guidelines for Assessing Research Reports. These guidelines describe four simple steps required for the assessment of a research report, and that provide an excellent tool to extract full benefit from the research articles included in the course of study. In addition, further information is given on how to relate to the main points presented within a research report, develop critical unbiased reading skills, and generalize concepts presented therein in order to allow their practical application. This evaluation tool is applicable to both theoretical and empirical research studies. Guidelines for Compiling a Portfolio
Students should be instructed to compile a portfolio that will include —in addition to the questionnaires presented to them upon commencement of the course and completed worksheets and analyses of research reports—notes, summaries, personal reflections and any other relevant information gathered during the course. By regularly reviewing students’ portfolios, instructors can assess what teaching alternatives should be used to further enhance their students’ learning experience, and prepare their lessons accordingly. It will also help the instructor understand, if necessary, just where in the learning process the student may be having difficulties. Chapter 17 provides an in-depth discussion of the advantages of the use of the portfolio as an assessment method, and specific instructions as to how to prepare one.
223
CHAPTER 15
QUESTIONNAIRE: ATTITUDE TOWARD RATIO AND PROPORTION Name of student (or other identification for pre/post comparison): Date: _____________________ Course of study: _____________________
_____________________
Thank you for filling out this questionnaire. The results will help in developing learning materials for pre- and in-service elementary school teachers.
1
1. I am confident in my ability to teach the topic of ratio and proportion. 2. I feel that I have the mathematical knowledge required for teaching the topic of ratio and proportion. 3. I feel that I have the didactical knowledge required for teaching the topic of ratio and proportion. 4. I feel that I do not have sufficient knowledge of the topic to teach ratio and proportion. 5. Mathematics teachers should have a wide range of mathematical knowledge (beyond the material learned in school). 6. Teaching the topic of ratio and proportion seems to me to be very complicated. 225
Totally Agree
Agree
Totally Disagree
Section A: Please place an X in the space that represents your attitude.
2
3
4
5
CHAPTER 15
Questionnaire: Attitude Toward Ratio and Proportion (Continued) 1
7. Among the subjects taught in school, mathematics is one of my favorites. 8. The theoretical knowledge I have regarding the topic of ratio and proportion is not sufficient for teaching it. 9. It is important for me to study the topic of ratio and proportion. 10. Even a teacher without expanded mathematical knowledge is capable of teaching mathematics at the elementary school level. 11. Teaching the topic of ratio and proportion is irrelevant for teachers as well as for students. 12. Because many teachers have difficulties in understanding the topic of ratio and proportion, it is difficult for them to teach it. 13. I feel that I am capable of teaching the topic of ratio and proportion. 14. The topic of ratio and proportion is important for the mathematical development of pupils in elementary school. 15. I do not enjoy teaching mathematics. 16. The topic of ratio and proportion should be included within the framework of teacher education (pre-and-in service education). 17. Many pupils have difficulty understanding the topic of ratio and proportion. 18. It is important to teach the topic of ratio and proportion at the elementary school level. 19. Teaching the topic of ratio and proportion seems easy to me 20. No need to teach the topic of ratio and proportion
226
2
3
4
5
ATTITUDE QUESTIONNAIRE
Section B: Answer the following questions.
1. Please describe a situation/problem related to the topic of ratio.
2. Please describe a situation/problem related to the topic of proportion.
3. Please indicate concepts/words/subjects related to ratio and proportion.
Thank you for your cooperation.
227
CHAPTER 15
REMARKS CONCERNING THE ATTITUDE QUESTIONNAIRE
Administration of the attitude questionnaire will give both students and instructors a better understanding and appreciation of the students’ attitude towards ratio and proportion in particular and proportional reasoning in general. Furthermore, administering the attitude questionnaire to student teachers both before and after a pre- or in-service professional development course will serve as an indicator of how the course, by providing instruction to the topics primarily through the use of authentic investigative activities, influenced their attitudes. The first part of the questionnaire, the statements of attitude, is measured along a Likert scale of 1-5 (1 indicating total disagreement and 5 indicating total agreement). The items can be broken down into four categories as follows: 1) attitude toward teaching mathematics in general (4 items: # 5, 7, 10, 15); 2) confidence in ability to deal with ratio and proportion (7: # 1, 2, 3, 4, 8, 13, 19); 3) attitude toward teaching ratio and proportion in particular (3: # 6, 12, 17); 4) attitude toward the importance of teaching ratio and proportion (6: # 9, 11, 14, 16, 18, and 20). An analysis of the results of the four categories of the attitude questionnaire (administered both before and after the courses) was conducted in pilot studies during one-semester proportional reasoning courses in Israeli teacher colleges. The results from two groups of pre-service teachers (n = 49 and n = 15) are given below and can serve as a basis for comparison and reference to tests conducted in other applied courses. Table 15.1. A Summary of Attitudes toward Ratio and Proportion, Scale (1-5), Group 1
No of items
4 7 3 6
228
Attitudes toward teaching mathematics in general. Confidence in ability to deal with ratio and proportion. Attitudes toward difficulties in teaching ratio and proportion. Attitudes toward the importance of teaching ratio and proportion.
Mean Before Instruction N = 49
Mean After Instruction N = 12 (a sample)
4.13
4.78
2.95
3.75
2.99
3.67
3.69
4.24
ATTITUDE QUESTIONNAIRE
Table 15.2. A Summary of Attitudes toward Ratio and Proportion, Scale (1-5), Group 2
No of items
4 7 3 6
Attitudes toward teaching mathematics in general. Confidence in ability to deal with ratio and proportion. Attitudes toward difficulties in teaching ratio and proportion. Attitudes toward the importance of teaching ratio and proportion.
Mean Before Instruction N = 15
Mean After Instruction N = 15
4.45
4.81
2.81
3.89
3.22
3.25
4.62
4.59
As indicated by the data in both tables, the pre-service teachers started out with a positive attitude towards teaching mathematics in general, and this improved slightly by the end of the course. Their confidence, however, which started out at a much lower level, improved significantly. The standard deviation measure of post testing indicates that by the end of the course, all the participants were much more confident in their ability to deal with and teach ratio and proportion. Their attitudes regarding difficulties they might encounter in teaching ratio and proportion proved more problematic: they started the course in the middle of the scale; at the end there was relatively little improvement (2.99 to 3.67 for group1 and 3.22 to 3.25 for group 2), indicating that this is an area that is more difficult to improve in one semester of training. As for the fourth category, their attitude toward the importance of teaching ratio and proportion, most considered the topic to be important, and continued to believe so by the end of the course. Interestingly, after exposure to proportional reasoning tasks, the students viewed teaching ratio and proportion as more complicated than before. Interviews with participating teachers strengthened this finding, yielding comments such as “I thought that the topic of ratio and proportion was easy and that I knew how to teach it, but now, after this course, I realize that it is very complicated and that I still lack a lot of knowledge”; or “It exposed me to a topic about which I did not know how much I don’t know and how unready I am to teach it.” Another important result of exposure to the proportional reasoning tasks is the participants’ attitudes to the need to include ratio and proportion as part of pre- and in-service teacher training. Before the course, many examinees did not think it very important to include a course related to ratio and proportion; after, almost all the participants agreed to its importance. For example, one of the interviewees stated “It is very important to teach this topic of ratio and proportion in college since it is
229
CHAPTER 15
the A B C of mathematics. If you are not familiar with the topic, it is impossible to teach other topics.” These findings indicate a significant improvement in the participants’ attitudes toward the overall components and aspects of ratio and proportion topics.
The difference between the responses to the three open–ended questions before and after the course also indicates a significant improvement in the student teachers’ understanding of ratio and proportion. Typical Answers Obtained for the Open-Ended Questions Question 1: Please describe a situation/problem related to the topic of ratio.
Common answers from pre-service teachers before the course Over 75% of the respondents gave answers such as - “I don’t know” - “I did not tackle the subject” - “I have not yet taught fourth grade classes” - “In my opinion, the questionnaire should be given at the end of the course”
About 20% gave examples similar to - “In a class of 20 boys and 15 girls, what is the ratio between them?” Common answers received after the course About 60% gave an answer similar to the following: - In a class there are 35 pupils. The ratio between the number of boys to the number of girls is 2:5. How many boys and how many girls are in the class? **** Question 2: Please describe a situation/problem related to the topic of proportion.
Common answers from pre-service teachers before the course Over 95% of the respondents gave answers such as - “In my opinion, the word proportion is a synonym to the word ‘ratio’ and therefore I am taking the same problem as before.” - “When something wrong happens in our life, we are told to take it in ‘the right proportion’ and we learn to accept it in the right proportions.” - “Minimal clothes that cost maximum price (lack of proportion).” - Many blank answers (“I don’t know,” etc.)
About 20% gave examples similar to - In a class of 20 boys and 15 girls, what is the ratio between them?
230
ATTITUDE QUESTIONNAIRE
Common answers received after the course Over 90% gave answers such as the following: - equal relation between two ratios; - A mathematical notation of proportion: a/b = c/d, a, b, c, d ≠0. - Find the unknown in the following proportion: 7/12 = 35/? Question 3. proportion.
*** Please indicate concepts/words/subjects related to ratio and
Common answers from pre-service teachers before the course - “Equals, similar, bigger, smaller - “Lack of proportion, ratio for example of 1:3” - “Direct ratio and opposite ratio” - “Division, multiplication, big, small, long, short, larger by, smaller by” - “Comparison, differences, similarity” Common answers received after the course - “Percentages, fractions, ‘the rule of three,’ quantities - “Percentages, fractions, enlargement, reduction, scaling factor”
By comparing the answers to the attitude questionnaire before and after, the benefits of a course such as the one described in this book become clear.
231
CHAPTER 16
DIAGNOSTIC QUESTIONNAIRE IN RATIO AND PROPORTION
Name of student (or other identification for pre/post comparison): Date: _____________________ Course of study: _____________________
_____________________
Important: Answer all questions in full, providing detailed explanations of the problem-solving process.
RATE PROBLEMS
A Trip to the Zoo
Max, Alice, Alex, and Sima planned a class bicycle trip to the zoo. The pupils gathered in the parking lot of the school and rode their bikes along the bike path leading to the zoo. They watched the animals for a few hours, and then met by the lake for some snacks and cold drinks before riding back to the school. 1) Max and Alice had to buy the beverages. They saw that cherry soda cost $2 for 16 single-serving boxes. Grapefruit juice cost $1.60 for 12. They decided to buy the grapefruit juice. Was this the best choice economically? Show in detail all the calculations and thought processes with which you arrived at your answer. 2) Sima and Alex organized the purchase of chocolate bars and apples, but they lost their receipts. They remembered, though, that the chocolate cost $2.60 for 8 bars, and the apples were 6 for $1.95. a) How much did they pay for 20 chocolate bars? Show your work. b) How much did they pay for 20 apples? Show your work. 3) After the trip, Sima and Alex decided to see who could ride the fastest back home. Sima rode 5 km in 20 minutes. Alex rode 7 km in 25 minutes. Who rode the fastest? How do you know? 4) The next weekend, Max and Alice rode their bikes to the park, taking the long route around the lake. The route is 30 km and it took them 1.5 hours. They ate 233
CHAPTER 16
lunch, and then rode back the short way, which is only 20 km. This took them ¾ of an hour. In which segment of their trip did they ride the fastest? How do you know? 5) In the field near their homes, Max and Alice noticed a number of stray cats. They made a number of phone calls and discovered that in their town there are about 1000 stray cats, and in the neighboring town there are about 1500. Their town has an area of 60 square kilometers, and the neighboring town is 100 square kilometers. Assuming that the cats are evenly scattered over the areas, in which town is there a higher likelihood of seeing a stray? Explain your reasoning. RATIO PROBLEMS
Getting to School
At City Elementary School there are 400 pupils. Some get to school by school bus, and the others get to school on their own, either by walking, riding their bikes, or getting a lift with parents. 1) In Mr. Erez’s class, 20 students come by bus and 15 arrive on their own. In what different ways could you compare the number of students that arrive by bus to the number that arrive on their own to school? Explain your reasoning in detail. 2) In Ms. Shula’s class, 18 students come by bus, and 12 arrive on their own. In what different ways could you compare the numbers of bus riders and those who come on their own in Ms. Shula’s class to those in Mr. Erez’s class? Explain your reasoning in detail. 3) Is the ratio of bus riders to those who come on their own in Ms. Shula’s class the same as in Mr. Erez’s class? Explain your reasoning in detail. 4) Of the 400 students in the school, 240 arrive by school bus daily. Is the ratio between the numbers of pupils that arrive by bus to the number that arrive on their own in Ms.Shula’s class the same as that of the whole school? How do you know? 5) In Ms. Nancy’s class, 25 students arrive by school bus and 15 arrive on their own. Ms. Nancy claims that the ratio between the numbers of pupils who arrive by bus to those that arrive on their own is 5:3. Is she correct? Explain your reasoning in detail.
234
DIAGNOSTIC QUESTIONNAIRE
SCALING PROBLEMS
In the Photography Store
Phil and Fran are photographers who develop their own pictures and also restore old photographs. They have an enlarging and reducing machine that can change the size of photographs as shown below.
Figure 1: Photographs
1) A customer brings in an old photograph to be restored and enlarged. She asks Fran if it can be enlarged from the size on the left to the one on the right. What appears to be the enlargement factor here? How do you know? 2) A customer asks Fran to enlarge a 3 inch by 2 inch photograph to 18 inches by 12 inches. Can this be done without cutting or distorting the picture? How do you know?
Figure 2: Question 1
235
CHAPTER 16
3) Phil took a photo of a man and a tree and their shadows. The real-life man is 1.75 meters tall. In the photo, the man is 3 cm tall, his shadow is 1.2 cm long, and the shadow of the tree is 4.5. cm long.
Figure 3: Question 3
If the photo included the entire tree, how tall would the image of the tree be? How tall is the real-life tree in meters? Show your work. 4) To help prevent damage to photos that will be displayed on the wall, Phil laminates the prints with a special sealant. If he needs 400 grams of sealant to laminate a 10 cm by 15 cm print, how much will he need for a 20 cm by 30 cm print?
Figure 4: Question 4
5) If Fran were to put a photograph in the machine and enlarge it once, then put that enlargement in the machine and enlarge it by the same amount again, which series of lines below shows what could happen to an image of a line in the photograph? Explain why.
236
DIAGNOSTIC QUESTIONNAIRE
Figure 5: Question 5
PROBLEMS WITH FRACTIONS
1) What is the number that can replace the “?” in each of the following problems. Explain your reasoning and show your work for each.
a)
5/6 =?/18
b) 8/5 = 20/? c)
2/5 = 2.4/?
2) Circle the smaller fraction in each pair. If they are equal, circle them both. Explain your reasoning and show your work for each.
a)
5/7
8/10
b) 3/2 c)
18/12
5/20
7/25
COMMENTS ON THE DIAGNOSTIC QUESTIONNAIRE
The diagnostic questionnaire on proportional reasoning includes four parts as follows: First are five rate and density problems. The first two deal with unit prices, one involving numerical comparison and the second a missing value. The third and the fourth deal with numerical comparison of proportional relations between distance, time and velocity, the main difference between them being their numerical structure—one using only integers and the other using fractions and decimals. The fifth problem, about population density, also involves numerical comparison, but 237
CHAPTER 16
with larger numbers. In all the numerical comparison problems, the ratios are not equal and thus can be considered more difficult than those with equal ratios (Karplus et al., 1983 a,b). Next are five ratio problems. For the first two, there is no need to solve the problems numerically—the task is to specify ways to find the ratio between the data under study. The third problem compares two ratios, while the fourth compares different ways of representing ratios. In the fifth problem, the whole value must be determined from a given ratio. Five scaling problems follow. All five require calculation of a ratio and its application with respect to enlarging or reducing the dimensions of pictures. Each problem introduces a different aspect of scaling: the first asks to find the scaling factor; the second asks to compare two ratios; the third one is a missing-value problem; the fourth involves quadratic enlargement (areas); and the fifth concerns a situation with two consecutive scaling steps. Finally, there are six fractions exercises covering a range of methods, from simple numbers and fractions to decimals. These exercises represent the mathematical proficiency that would be required to solve the rate, ratio and scaling problems presented in the first parts of the diagnostic questionnaire and thus can be used to diagnose sources of difficulties students might have with computations or understanding of the verbal parts of the problems. It should be noted that the assessment tasks of the diagnostic questionnaire are different from those that appear in standard tests, and stem from familiar situations such as buying soft drinks, riding a bicycle, and population density. Moreover, the problems and the situations are different from any of the investigative activities given during the course. Rating Form
A rating form was created to score and analyze the diagnostic questionnaire. Three different answer categories are identified: correct, incorrect, and no response. Because students are asked to provide support work and give reasons for their answers, the correct answer category was further subdivided into 1) correct answer only, 2) correct answer with correct support work, and 3) correct answer with incorrect support work. Similarly, the incorrect answer category was subdivided into 1) incorrect answer only, 2) incorrect answer with partial understanding, and 3) incorrect thinking. In scoring test papers, the most problematic subcategory is that of “incorrect answer with partial understanding.” Students’ responses that should be placed in this category are those that show that the student’s thinking was incorrect, even though their computations were correct; those that indicate correct understanding of relationship involved yet include mistakes in calculating the appropriate units; and those that showed most of the problem completed correctly yet with minor mistakes upon doing the final calculations.
238
DIAGNOSTIC QUESTIONNAIRE
To illustrate how the analysis may be done, presented below are examples of performance results obtained from one group of pre-service Israeli student teachers, and two groups of American 7th graders—one group that was taught according to the Connected Mathematics Project (CMP) curriculum, and a control group that were taught using a traditional curriculum. The results from the preservice teachers are based on the three parts of the diagnostic questionnaire and show results both before and after exposing them to some of the authentic investigative activities in ratio and proportion. Regarding the scaling problems, the findings indicate that pre-service mathematics teachers had special difficulty solving problem four, in which they were required to deal with quadratic (area) enlargement. Both before and after the course, the rate of success was only 40%. Obviously, the subject of quadratic enlargement was not assimilated successfully. This corresponds to the findings of previous studies regarding pre-service teachers (Keret, 1998). In contrast, the performance on problem five was much better: 65.5% before the course and to 80% after. In this problem, the examinees were asked to consider double enlargements. This problem was presented in two versions: one version included an illustration of line segments (no numbers) and the question was to choose which represented the overall enlargement; the second version included a description of a machine that enlarged times 2 and after that times 3, and the students were asked to determine what the resulting enlargement would be. For both versions, the rate of success was almost the same. Below are the results of the pre-service teachers’ performance, before and after the course. Note that the first two ratio problems are not included in this table and were analyzed separately.
239
CHAPTER 16
DIAGNOSTIC QUESTIONNAIRE IN RATIO AND PROPORTION: RATING FORM
Type of and number of problems: Rate _______ Ratio _______ Scaling ______
Overall total
School/ Group
Correct answer
240
Correct answer only
Correct support work
Incorrect support work
Incorrect answer Incorrect answer only
Correct thinking but wrong conclusion
Incorrect thinking
No answer provided
DIAGNOSTIC QUESTIONNAIRE
Table 16-1: Overall Pre/Post Results for Pre-service Elementary Mathematics Teachers
13 Problems (5 Rate, 3 Ratio, 5 Scaling), N = 32 Correct answer Correct answer only
Correct support work
Incorrect answer
Incorrect support work
Incorrect answer only
Correct thinking but wrong conclusion
Incorrect thinking
No answer provided
Rate Pre
1
56
3
2
11
8
19
Post
-
86
3
-
9
1
1
Ratio Pre
1
38
10
-
6
7
39
Post
1
81
6
-
10
-
2
8
18
19
15
8
3
Scaling Pre
1
51
3
-
1 70 3 *All of the numbers in the table are percentages. Post
It can be seen that before the course and the authentic investigative activities, 56%, 38% and 51% (Rate, Ratio and Scaling, respectively) of the pre-service teachers responded correctly with correct support work. After the course, their performance improved dramatically, to 86%, 81% and 70%. Furthermore before experience with proportional reasoning activities, 27%, 46% and 37% of the preservice teachers could not even attempt the problems or used incorrect thinking, whereas, after the course only 2%, 2% and 11% could not solve the problems. As far as showing their work, the majority of participants provided detailed written support for their answers both before and after the course: before—78%, 61% and 80% (Rate, Ratio and Scaling, respectively), after—99%, 97% and 96%. Hence, when the examinees were asked to “show your work”, “how do you know?”, or “explain” they did not hesitate to add written explanations. Yet, further analysis shows that the quality of writing clearly improved after the course. After having been taught how to explain and discuss their reasoning and ideas, the arguments of the participants were more detailed, clearer and of a better quality. With respect to “Correct answer with incorrect support work,” 3%, 10% and 3% (Rate, Ratio and Scaling, respectively) of the participants fell into this category in the pre-test. In other words, they seemed to have guessed the correct answer, or fell 241
CHAPTER 16
upon it despite not understanding the concepts involved. On a typical mathematics exam, one that does not ask for justification of answers, those examinees would receive full marks, yet their misconceptions would be unrecognized and uncorrected. The results of the post-test showed almost the same figures on this category. It is interesting to compare the results pertaining to “Incorrect answer with partial understanding/thinking” category in which there were 11%, 6% and 5% (Rate, Ratio and Scaling, respectively) before the course, and 9%, 10% and 10% after. This subcategory represents examinees who think through the problem correctly but then execute the calculations incorrectly, or those who are able to decide upon the correct numbers and information to work with but then combine the measurement units incorrectly. It can be assumed that these students are beginning to grasp the content, but their understanding is still shaky. For such students, some extra, complementary instruction will probably be enough to consolidate their understanding and they will not need more aggressive instruction as would those who answered just incorrectly or left blank paper. The values in the chart above do not include the first two ratio problems of the diagnostic test (which ask for qualitative descriptions of different ways to present and compare ratios). The data for these questions show that before the course, 68% of pre-service teachers could answer question one and even fewer, only 50%, could answer question 2. In other words, 32% and 50%, respectively, could not come up with even one way of presenting some form of ratio. After the course, however, only 3% had difficulty in either problem. Also, it should be noted that before the course, a “successful answer” might only have provided one method of solving the problem; after the course, the majority of the 97% of the participants who correctly solved each problem were able to suggest more than two different ways to describe the ratios. The table below presents the performance of two samples of 7th grade students, who answered the diagnostic questionnaire. The samples represent pupils from several American states (N=1498 for the CMP curriculum group and N=1019 for the control [traditional] curriculum group). It is obvious that the CMP pupils performed much better than the control group, but in both cases the levels are far from acceptable. The tests were given in the middle of the 7th grade after there had been some teaching of ratio and proportion topics, nevertheless the overall score for the CMP group was 43 and for the CNT sample, 21. It is also clear that the results indicate the difference in difficulty between the three types of questions, rate being easier than ratio, and both being easier than scaling. Maybe it is no surprise that this echoes the results obtained from the student teachers. An analysis of the results of the rate problems can be found in Ben-Chaim et al. (1998). The report of this study includes results of each group on each of the Rate problems and analysis of solution strategies applied by the students. It might be worthwhile to point out that both pre-service student teachers and 7th-grade students performed similarly both in pre- and post-testing, all of whom were able to solve the fractions exercises with no particular difficulty. 242
DIAGNOSTIC QUESTIONNAIRE
Table 16-2: Overall Results for 7th-Grade American Students Connected Mathematics Project (CMP) students vs. control (CNT) students
Correct answer [%] Correct answer only
Correct support work
Incorrect answer[%]
Incorrect support work
Incorrect answer only
Correct thinking but wrong conclusion
Incorrect thinking
No answer provided [%]
Rate CMP N=496 CNT N=364
2
51
7
2
13
18
7
5
28
14
6
10
28
9
Ratio CMP N=372 CNT N=255
5
43
9
4
6
19
14
4
21
20
5
5
20
25
Scaling CMP N=630 CNT N=400
4
36
1
17
2
23
17
4
16
4
17
2
30
27
Overall CMP N=1498 CNT N=1019
3
43
5
9
7
20
13
4
21
12
10
6
27
20
* All of the numbers in the table are percentages.
243
CHAPTER 17
ASSESSING RESEARCH REPORTS AND BUILDING A STUDENT PORTFOLIO
GUIDELINES FOR ASSESSING RESEARCH REPORTS AND ARTICLES
Instructions for Students
After reading the research report/article, write a 1–2 page analysis following the guidelines below. 1) State the central idea of the paper, and give the main idea/ideas in 3-4 sentences. 2) Evaluate, both positively and negatively, the various ideas that are presented in the paper. 3) State for whom the idea/activity given in the paper is appropriate, and how you could incorporate it into your teaching. 4) Generalize the central idea or theme in the paper, and suggest other activities based on it.
Comments and Explanations for Instructors General. The teaching model presented in this book incorporates into the teaching process the reading and analysis of reports pertaining to both the mathematical and pedagogic-didactic perspectives of ratio and proportion. The guidelines presented above, the results of many years of experience working with pre-service teachers, will guide pre- and in-service teachers in efficiently analyzing such reports. They present an effective tool for analyzing the many and varied types of reports, including those that investigate various mathematical, didactical or scientific phenomena, those that discuss and analyze difficulties that may be encountered while teaching (and how to deal with them), or those that discuss certain aspects of the curriculum. Reading and analyzing reports on mathematical perspective help expand and deepen participants’ content knowledge. In appropriate situations, students should be also asked to briefly discuss the mathematical topic in the report. This will aid in understanding and consolidating the content knowledge required. 245
CHAPTER 17
With regard to articles pertaining to the pedagogic-didactic perspective, studying such articles will help enhance practical and professional skills. Suggestions presented throughout the training course, are based on conclusions drawn from studies described in articles that are also included in the learning program. By incorporating actual scientific reports into the learning program, preand in-service teachers will be able to better appreciate the difficulties that some of their pupils may have in learning the concepts of ratio and proportion; this will help them develop effective ways to overcome these difficulties. Ideally, the evaluation should not exceed two pages. It should not simply be a summarization of the report, but a thoughtful review and analysis of the data and conclusions. In addition, the students should be encouraged to express their opinion (both good and bad) with respect to the purpose, method, explanations, and innovations that are presented in the report. Questions 1-3 of the evaluation are subjective, and students should be encouraged to give their opinion freely and without reproach. Note that question 2 asks for an evaluation of both the good and bad points of the report. It is important that the instructor avoid the terms “criticism” or “critique” with respect to evaluating research reports and articles, in order to avoid any connotation implying that only negative points should be addressed. Considering Question 4. Question 4 requests a summarization or generalization of the central idea, and then expansion of this idea to come up with other activities inspired by the report. The latter demands deeper understanding of the subject to allow the creativity needed to suggest other activities. The research leading to these guidelines showed that students exhibited their greatest difficulties with this question, in which they first and foremost identify the main point or central idea of the report to make a generalization that relates that idea to the same area or field of mathematics, and then expand on that generalization to include other areas or activities. For example, a report may deal with the ratio between two linear (first-degree) values. Generalization could lead to how ratios can also be formed between second- or third-degree values. Expansion could lead to a description of how a similar activity could be devised that demonstrated how such basic geometrical linear calculations are used in other fields of study, such as geography, physics or another science discipline. Or, a report might suggest ways of demonstrating the relationships between different angles that are formed when two parallel lines on a plane are bisected. A generalization might suggest a demonstration using two parallel lines bisected by a third in three-dimensional space. Expansion would be to take the process beyond the scope of plane geometry and to demonstrate its significance in, say, geography, such as when discussing elevation lines or geological layering. Impact of Assigning Research Reports. In addition to the argument for the importance of incorporating literature into the authentic research activities presented in Chapter 7, the following is presented to further illustrate the impact this activity has on the students’ didactical knowledge and teaching confidence.
246
RESEARCH REPORTS AND STUDENT PORTFOLIO
During the pilot course that the authors gave on proportional reasoning, student teachers worked on several activities of each type (Introductory, Rate, Ratio, Proportion, and Scaling). The 3-4 scaling tasks included Activity 4.1 (Wimpy in Wonderland) and Activity 4.2 (The Beth-Shean Temple), during which they were required to read, analyze and discuss the research articles using the guidelines provided. It was obvious that the student teachers were concerned not only with their lack of proportional reasoning content and pedagogical knowledge, but also with how they would teach it in the future. Hence, it became clear that research reports on trials of practical proportional reasoning activities with children would be most helpful and productive. Thus, during the activities mentioned, they were asked to study and analyze two research reports related to the scaling tasks: “Toys 'r' math” (Tracy & Hague, 1997) and “Fractions attack! Children thinking and talking mathematically” (Alcaro, Alston, & Katims, 2000). Two student teachers were interviewed to find out what they had learned from reading and analyzing the reports. One concluded: “. . . it provided me with a variety of devices to use when introducing the topic of proportional reasoning in my class; it gave me confidence. I know now what they did and what the results were. It will be interesting to compare what happens in my class to what happened in the report.” Another said: "There were many experiments suggested [in the literature reports we read], and I like to be involved in experiments of methods and strategies in addition to numbers. Here they showed me the experiment; it was more meaningful and interesting for me.”
THE STUDENT PORTFOLIO
The Portfolio as Alternative Assessment: Reasons, Goals and Advantages
There is a growing trend to use alternative assessment methods to evaluate the progress and achievements of students. According to Macías (2002), alternative assessment includes a variety of tools that can be adapted to varying situations and can reflect the goals of the class and the activities being implemented in that classroom to meet those goals. These tools include checklists of student behaviors or products, journals, reading logs, videos of role-plays, audiotapes of discussions and class discourse, self-evaluation questionnaires, samples of work, and teacher observations or anecdotal records. Since the evaluation involves a collection of student’s work, such assessment is termed (in the professional literature) “portfolio assessment”. Using a portfolio to evaluate student progress provides an alternative to traditional forms of standardized assessment and all its associated problems. It is more sensitive to multicultural differences; is free of the norm, linguistic, and
247
CHAPTER 17
cultural biases found in traditional testing, and provides a means to focus on students in all dimensions. Alternative assessment gives an advantage over traditional testing in that it a) does not intrude in regular classroom activities; b) reflects the whole integration of the curriculum, teaching and learning that are actually being implemented in the classroom; c) provides information on the strengths and weaknesses of each individual student; and (d) provides multiple indices that can be used to evaluate student progress. García and Pearson (1994) (quoted by Macías [2002]) state that the main goal of alternative assessment is to gather evidence about how students approach, process, complete, and reflect on real life authentic tasks in a particular domain, such as mathematics in general and proportional reasoning in particular. Students are evaluated on what they have integrated and produced rather than on what they are able to recall and reproduce. An educational portfolio is thus defined as a purposeful collection of a student’s work that exhibits the student’s efforts, progress and achievements in the area of study, and, moreover, involves the student in selecting contents, the criteria for selection, the criteria for judging merit, and evidence of student self-reflection (Widiatmoko, 2005a). Thus, a portfolio is a living, growing collection of a student’s work. Its greatest value lies in the fact that students become active participants not only in the learning process but also in its assessment. The educational portfolio allows flexibility for students to give a representative view of their accomplishments and competence. For the student teacher, the use of an educational portfolio should ultimately a) increase self-directed learning and promote habits that foster life-long learning; b) encourage reflection on their own level of competence, educational needs, and the treatments and psychosocial needs of their future pupils; and c) allow more flexibility and creativity to demonstrate achievements in knowledge and skills, and attitudes changes necessary in the teaching profession. Of these goals, the most important is the promotion of reflective thinking. Next in importance is to encourage students to be self-directed in determining the direction of their future learning. Certainly, the development of life-long learning skills is critical to any teacher’s future success in their profession. However, this must be coupled with accurate self-assessment to direct any future education. In addition, it can be hoped that by experiencing this method of assessment and being convinced of its advantageous value, the student teachers will be led to implement such methods in the future when they are teachers. Types of Portfolios
There are many different types of portfolios, each of which serves one or more specific purposes. The following three types of portfolios are the most prevailing in the education field and also very often cited in the literature (Widiatmoko, 2005b):
248
RESEARCH REPORTS AND STUDENT PORTFOLIO
Documentation Portfolio. Also known as the “working portfolio”, this comprises a collection of work over time, demonstrating the student’s growth and improvement over the span of the course, and their success in reaching the specified goals. Such a portfolio includes everything related to producing the assignments, from notes written whilst brainstorming, to drafts, to finished products. Because it is meant to give an overall view of the student’s learning process, it will include samples of both their best and weakest work. Process Portfolio. This approach documents all facets and phases of the learning process, and is useful in demonstrating the students' overall learning process. It shows how the student integrated specific knowledge or skills in the progress towards both basic and advanced mastery. Additionally, the process portfolio emphasizes the student’s reflection on the learning process, including the use of reflective journals, logs, and related forms of metacognitive processing. Showcase Portfolio. Best used for the summative evaluation of students' mastery of curriculum outcomes, the showcase portfolio will include only the students' best, completed work. In addition, this type of portfolio is compatible with audiovisual artifact development, and can (and should) include any photographs, videotapes, and/or electronic records of their completed work. Which work to include is determined through a combination of student and instructor selection, thus the portfolio will include a written analysis by the student reflecting upon the decision-making process used to determine the content. Implementing the Portfolio in the Course
In the case of the course of studies outlined in this book, the educational portfolio furnishes evidence demonstrating the progressive acquisition of knowledge and skills of the students, along with a change in their attitudes. Because the authors of this book determined portfolio assessment to be the most appropriate tool for both the pre-service and in-service courses, it was implemented in each one of the training courses conducted during their pilot studies. Course participants were instructed to include in the portfolio documentation of the authentic investigative activities, including any discourse and the didactical methods exhibited by the course instructor. This documentation will be invaluable to them, especially in their first steps in teaching. Also incorporated into the portfolio were the results of the diagnostic tests conducted on content knowledge and their attitudes towards teaching and learning the subject of proportional reasoning—see Chapters 14–16). Thus, the portfolio gave a clear picture of the student's experiences in the various learning situations. Usually, the portfolio used by the student teachers in the training course consisted of a folder containing the entire student's written work, including a selfevaluation of the strengths and weaknesses of it. Often, it contained documentation illustrating the progress of a project as it evolved through the various stages of conception, draft, and revision, as for example illustrating the entire path of an 249
CHAPTER 17
authentic investigative activity assigned as homework, or, as another example, a reaction to reading an assigned article and it analysis according to the guidelines provided. The students were directed to use either the documentation (type 1) or process (type 2) portfolios throughout the course. Most of them used type 2, possibly because they were interested in amassing a collection of all the activities and didactical pedagogical methods presented at class, knowing that in the near future they might need to implement them in their own classes. However, for their final assessment and grading, they were requested to compile a showcase portfolio. Developing the Portfolio
In general, there are three phases to portfolio development: organization and planning, collection (selection), and reflection. Although there is no single correct way to develop a portfolio for final presentation and assessment, the processes of collection, selection, and reflection is an additional learning tool for the students. According to Sweet (1993), the process of determining the basis for their choices, aided by teacher and peer input, allows students to generate and appreciate the criteria for exemplary work. By providing them clear, structured guidelines and specific examples of what constitutes good work right from the very beginning of the course, the instructor can instill in them enthusiasm to meet their learning goals. Organization and planning. The initial phase of portfolio development, organization and planning, entails exploring essential questions right at the beginning of the process, so that students will understand the purpose of the portfolio and its status as a means of monitoring and evaluating their own progress. Key questions, such as ‘How do I select items, materials, etc. to reflect what I am learning in this class?’ ‘How do I organize and present the items, materials, etc. that I have collected?’ and ‘How will portfolios be maintained and stored?’ must be addressed and decided upon by both the students and teachers. Collection. The second phase is collection. This involves the collection of meaningful artifacts and products reflecting the students' educational experiences and goals alongside the criteria and standards that the instructor has identified for evaluation. Decisions are made at this phase about the context and contents of the portfolio based on the intent and purposes identified for it. The selection and collection of artifacts and products are based upon a variety of factors, including BUT NOT ONLY, the particular subject matter being studied, the learning processes involved, and any special projects and/or themes included in the unit. Reflection. The third and most important phase is reflection. Wherever possible, evidence of students' metacognitive reflections on the learning process and their monitoring of their evolving comprehension of key knowledge and skills should be included. These reflections may take the form of learning logs, reflective journals, and written notes pertaining to their experiences, thinking processes used, and the 250
RESEARCH REPORTS AND STUDENT PORTFOLIO
habits of mind they employ at given points in time and across time periods. Also important is to include any teacher feedback upon the products, processes, and thinking articulated in the portfolio wherever appropriate. Preparing the Portfolio
The portfolio used by the student teachers in the training course should consist of a folder containing the entire body of the student's written work and included the following: 1. Initial and final diagnostic questionnaires, including results, corrections and reflection 2. Analyses of all research reports assigned and summaries of any other reading 3. Worksheets (with answers) for each of the authentic investigative activities explored. 4. Self-evaluations of the strengths and weaknesses experienced while doing the activities. 5. Documentation illustrating the progress of the various projects as they evolved (through the various stages of conception, draft, and revision). Conclusion
Portfolio assessment is a solution to the problems faced by using traditional assessment methods, as it deals with all the students’ works within the learning period and involves the student in selecting, and ultimately meeting, the criteria used to define a successful program of studies. Due to its continuity, multidimensionality, and methods used to reflect the students’ thinking processes and metacognitive introspection, portfolio assessment is an appropriate means for alternative assessment in pre-service teacher education in general, and should be employed in the mathematical course training in proportional reasoning. Pilot studies showed that both instructors and students were very satisfied with the implementation of the portfolio as a means of assessment and as a way of providing challenging, significant processes for evaluation that would have implication in their future teaching careers. Indeed, just as authentic investigative activities enhance and encourage the learning process, so too, does the construction of a portfolio as an authentic assessment method.
251
PART FIVE
ANNOTATED RESOURCES AND BIBLIOGRAPHY
CHAPTER 18
ANNOTATED RESOURCES
The annotated articles presented herein are those which were deemed especially appropriate to support, broaden, and deepen the knowledge acquired from performing the authentic investigative activities in the course. Most are from journals specifically geared to elementary and middle school mathematics teachers, and mainly document how various activities in the topic of ratio and proportion were actually applied for use in educational systems and their results. The authors of this book believe that combining the theoretical and practical knowledge presented in these professional articles into the teaching process will aid the pre- or in-service teacher in comprehending the theoretical ideas and converting them to a conceptual framework of professional knowledge. Because incorporating theoretical articles into the course necessitates summarization of the mathematical concepts involved, the student will have a better chance to grasp the principals; presentation of the results of the research studies will lead the students to a broader perspective, encourage deeper discussion and bestow on them a better ability to choose appropriate and varied instructional methods in practice. As detailed in the teaching model presented in the beginning of the book (see Chapter Three), it is highly recommended that theoretical reading matter be combined into the curriculum of the proportional reasoning course for pre- or inservice mathematics teachers. For this, the course instructor may choose appropriate articles from the bibliography at the end of this section, use sections from Part II of the book (Theoretical Background) that discuss the theoretical side of the proportional reasoning topic at hand, and/or choose articles from the list of annotated references immediately following. They may either combine the article into the authentic investigative activities themselves (Part III), or devise a specific assignment using the article. (Please note that a tool to guide the student teachers in the analysis of the articles is presented in Part IV.) The annotation includes a brief summary of the article describing its how it might be useful to the students’ understanding. In instances where some technical or analog connection to a specific activity is apparent, extra explanations and specific recommendations as to how or when to combine this in the course are provided. The annotated references are divided into three categories: those specifically to Ratio and Rate, specifically to activities of scaling, and the third which are generally related to ratio and proportion.
255
CHAPTER 18
USING THE INTERNET
In addition, we also would like to remind the reader that the internet can be a rich source of instructional materials, demonstrations, exercises and explanations. The following sites present explanations, exercises (and their solutions) in the theory of ratio and proportion: 1. http://www.shodor.org/unchem/math/r_p/index.html 2. http://www.purplemath.com/modules/ratio.htm The following BBC site has a very rich selection of visual demonstrations, including animations and short movie clips. It also offers factsheets, games, quizzes, activities, worksheets and more. 3. http://www.bbc.co.uk/skillswise/numbers/wholenumbers/ratioandproportion/ ratio/ The following is an example of a site that provides a bounty of suggestions on the topic of fractals: 4. http://www.ics.uci.edu/~eppstein/junkyard/fractal.html Note also the sites and clips on YouTube.com that are suggested in Chapter 7, in the section on incorporating the literature into the authentic research activities. ARTICLES SPECIFICALLY RELATED TO RATIO AND RATE ACTIVITIES
1.
Abrahamson, D. (2003). Text Talk, Body Talk, Table Talk: A Design of Ratio and Proportion as Classroom Parallel Events. In N. A. Pateman, B. J. Bougherty, & J. Zilliox (Eds.). Proceedings of the 27th annual meeting of the International Group for the Psychology of Mathematics Education Conference held jointly with the 25th PME-NA Conference, (Vol. 2, 1-8). Honolulu, HI.
The paper describes the rationale and 10-day implementation in a 5th-grade classroom (n = 19) of an experimental ratio-and-proportion instructional design. In this constructivist-phenomenological design, coming from our theoretical perspective, design research, and domain analysis, students: a) link “real-world” and “mathematical” objects reciprocally through classroom enactment of word-problem situations vis-à-vis guided reading/writing of spatial-numeric inscriptions; b) interpret and invent rate, ratio, and proportion texts as patterned cells in and from the multiplication table; c) revisit and consolidate addition and multiplication as conceptual domain foundations. Students of diverse ethnicity, SES, and mathematical competence engaged successfully in discussing and solving complex problems, outperforming older students on comparison items. 2.
256
Alatorre, S., Flores, M., & Solís, T. (2011). Proportional reasoning of primary teachers. In B. Ubus (Ed.) Proceedings of the 35th Conference of the International Group for the Psychology Mathematics Education, (Vol. 2, 9-16). Ankara, Turkey: PME.
ANNOTATED ARTICLES
This paper deals with the ability that school teachers have in proportional reasoning. It was written within the framework of an ongoing investigation on the strategies used by subjects of different ages and schoolings when faced with different kinds of ratio comparison tasks. It reports a case study carried out with five in-service primary teachers to whom were posed several kinds of ratio-comparison problems with different contexts and numerical structures. The obtained results are analyzed quantitatively and qualitatively, and a didactical strategy is proposed that can also be applied in teacher training and professional development. 3.
Brinker, L. (1998). Using recipes and ratio tables to build on students' understanding of fractions. Teaching Children Mathematics, 4, 218-224.
The context of cooking for different numbers of people is intended to give students opportunities to use their informal strategies to multiply and divide fractions. The number of servings of a given recipe is increased or decreased, which implicitly addresses the idea of ratio as a constant relationship. 4.
Che, S. M. (2009). Giant pencils: Developing proportional reasoning. Mathematics Teaching in the Middle School, 14(7), 404–408.
This article describes a mathematically rich problem about giant pencils, which encourages students to reason proportionally. The students learn how to develop proportional reasoning and apply it to many aspects. When the students walked into class, they noticed huge pencils taped up against the wall. They were very large and identified as the pencil a giant would use in a mathematics classroom. They were then given the task to find out information about the giant based on the size of the pencil. 5.
Clark, M. R., Berenson, S. B., & Cavey, L. O. (2003). A comparison of ratios and fractions and their roles as tools in proportional reasoning. The Journal of Mathematical Behavior, 22(3), 297–317.
In an attempt to develop authors' shared understanding of the relationship between ratios and fractions, they began a phenomenological study to gather evidence from teachers and textbooks and to collect evidence from their own experiences. In this article, they present five possible models for this relationship and a summary of evidence to support each. They also present the model that they developed to represent their shared understanding, and provide the results of a study for which they have used their model to help them analyze students’ uses of ratios and fractions in their solutions to proportion-related problems. 6.
Condon, G. W., Landesman, M. F., & Calasanz-Kaiser, A. (2006). What's on your radar screen? Distance-rate-time problems from NASA. Mathematics Teaching in the Middle School, 12(1), 6–13.
257
CHAPTER 18
This article features NASA's FlyBy Math, a series of six standards-based distance-rate-time investigations in air traffic control. Sixth-grade students— acting as pilots, air traffic controllers, and NASA scientists—conduct an experiment and then use multiple mathematical representations to analyze and solve a problem involving two planes flying on intersecting routes. The activities presented in this article are ideally combined with activities concerning rate, especially activity 2.1, Who’s Correct? The concept of speed as a rate as explored in this article, will help clarify for the student the mathematical meaning of motion. By exploring the topic with their pupils, teachers can help them realize that in order to make decisions about speed in the air traffic controller’s tower, it is essential to apply the relationships between speed, time and distance. 7.
Hino, K. (2011). Students’ uses of tables in learning equations of proportion: A case study of a seventh grade class. In B. Ubus (Ed.) Proceedings of the 35th Conference of the International Group for the Psychology Mathematics Education, (Vol. 3, 25–32). Ankara, Turkey: PME.
In this paper, the author examines the development of proportional reasoning both theoretically and empirically, and studies the proportional reasoning of three seventh-grade students when learning a new tool for proportion in the classroom. Observations of and interviews with the students indicated that they relied on tables, to which they were accustomed, in their process of learning the y = ax equations. Students applied meanings to these algebraic statements based on the way in which they interpreted proportional relationship tables, which was predominantly based on within-measure-space ratio reasoning. However, the students struggled with coordinating their views of tables because the equations impelled them to draw on between-measure-space ratio reasoning. 8.
Levin-Weinberg, S. (2001). “How Big Is Your Foot?” Mathematics Teaching in the Middle school, 6(8), 476–481.
Students develop personal units of measurement to compare standard and nonstandard measurements. In this activity, the ratios of distances in the human body are discussed. 9.
Lo, J., Watanabe, T., & Cai, J. (2004). Developing ratio concepts: An Asian perspective. Mathematics Teaching in the Middle School, 9(7), 362– 367.
The authors discuss the unique approaches that Asian cultures utilize in introducing the concepts of ratio and proportion. The Asian text books emphasize the connection to multiplication, rather than introducing it as another method to write a fraction. Pictorial representations are used to reinforce conceptual understanding.
258
ANNOTATED ARTICLES
10. Mihaila, I. (2004) Farey sums and understanding ratios. Mathematics Teacher, 98(3), 158–162.
The author stresses the importance of visual representations in assisting students in understanding ratio relationships. Students are encouraged to draw pictures when problem solving ratios. 11. Parmjit, S. (2000). Understanding the concepts of proportion and ratio constructed by two grade six students. Educational Studies in Mathematics, 43(3), 271–292.
Parmjit studied the strategies used by two students in completing proportion and ratio problems. The study focuses on how students transition from solving ratio problem by iterating composite ratio units to using multiplication and division. Findings suggest that the unit method should not be taught to students until they are well educated in unit coordination schemes. This article discusses a method for building proportional reasoning among seventh grade students. It outlines the procedures taken to teach these methods and the outcomes of student achievements. 12. Silvestre, A. I., & Ponte J. P. (2011). Missing value and comparison problems: What pupils know before the teaching of proportion. In B. Ubus (Ed.) Proceedings of the 35th Conference of the International Group for the Psychology Mathematics Education, (Vol. 4, 185–192). Ankara, Turkey: PME.
This paper analyses the mathematical processes and difficulties encountered in solving proportion problems in sixth graders before the formal teaching of this topic. Using qualitative methodology, they examine the pupils’ thinking processes at four levels of performance for missing value and comparison problems presented in both a written test and in a video-recorded oral test. The results show that pupils tend to use scalar composition and decomposition strategies in missing value problems and functional strategies in comparison problems. Pupils’ difficulties are related to a lack of recognition of the multiplicative nature of proportion relationships. 13. Telese, J. A., & Abete, J. Jr. (2002). Diet, ratios, and proportions: a healthy mix. Mathematics Teaching in the Middle school, 8(1), 8–13.
This article describes the implementation of a real-world context focused on teaching proportional reasoning. It reiterates the opinion of the authors that using authentic investigative activities increases motivation in both students and teachers. It can be combined into the course after some rate activities have been completed, as for example activity 2.3, Beads, Beads, Beads or any other activity that emphasizes the need to find the unit.
259
CHAPTER 18
ARTICLES SPECIFICALLY RELATED TO SCALING ACTIVITIES
1.
Buhl, D., Oursland, M., & Finco, K. (2003). The legend of Paul Bunyan: An exploration in measurement. Mathematics Teaching in the Middle School, 8(8), 441–448.
This article describes classroom activities in which measurements of various components of the legend of Paul Bunyan is used focus on scale factors and proportion in distance, area, and volume. 2.
Drum, R. L., & Petty, W. G. (2001). Miniature toys introduce ratio and proportion with a real-world connection. Mathematics Teaching in the Middle School, 7(1), 50–54.
Miniature plastic toys make ideal models for introducing ratio and proportion by concretely emphasizing the real-world connection of the concepts to objects. The article walks us through four problems using the themes of car rentals, boxes, movie tickets and dog grooming, each of which includes a number of different versions of the problem. By successfully using all three representations of the first problem, the dog-grooming problem, high mathematics will become more accessible to the students. Making a table to represent the problem, then moving on to a functional equation and then a graphical representation, allows for easy access of the mathematical concepts involved for the students. The next problems trail is more challenging: followups to the idea of representations and problem solving. Each problem is detailed enough to implement within the classroom as a successful problemsolving representation lesson. By helping students understand multiple representations, we allow them to reach higher levels in mathematical understanding. The activities described in this article are especially appropriate for use with scaling activity 4.3, What’s the Real Size? 3.
Dwyer, N. K., Causey-Lee, B. J., & Irby, N. M. (2003). Conceptualizing ratios with look-alike polygons. Mathematics Teaching in the Middle School, 8(8), 426–431.
This article presents an activity using similar rectangles to help children conceptualize ratio relationships in several different ways. The development of proportional reasoning is introduced without the process of crossmultiplication. 4.
Gray, E. D., & Tullier-Holly, D. (2007). Connecting measurement & architecture: Building an inflatable. Mathematics Teaching in the Middle School.13(3),144–149.
This article describes a joint effort between a mathematics educator and a middle school art teacher who wanted their students to experience how construction works. It started with students designing and building scale 260
ANNOTATED ARTICLES
models for a large inflatable item in which they display their art and extended to building the actual structure. The objective of the lessons was to have the students determine the linear measure, the surface areas and the volumes for scale models of the original design. The students needed to build models of real building and to draw small pictures of famous artists. This article is especially appropriate for Scaling Activity 4.2, The BethShean Temple, where it will help in understanding the progression from linear ratios to those of two dimensions (area) and of three (volume). 5.
Herron-Thorpe, F.L., Olson, J.C., & Davis, D. (2010). Shrinking your class. Mathematics Teaching in the Middle School, 15(7), 386–391.
This article describes a situation in which students were learning about scale factors in a CMP (Connected Mathematics Project) unit called Shrinking and Stretching. The students first measured and explored the toys to discover different scaling factors. The authors note that as a result of the classroom discussion about the equations involved, the students developed their understanding of ratios, scale factors, fractions, measurement and arithmetic. On the next day of this unit, the students were provided with materials to construct scale models of them, and then spent another day making scale models of objects that would create a cohesive diorama. 6.
Johnston, D. E. (2004). Measurement, scale, and theater arts. Mathematics Teaching in the Middle school, 9(8), 412–417.
This article describes a middle-school project that challenged students to design scale models of three-dimensional blocks used in theater programs. Students applied skills such as measurement, proportionality, and spatial reasoning in a cooperative setting. 7.
Mamolo, A., Sinclair, M., & Whiteley, W. J. (2011). Proportional reasoning with a pyramid. Mathematics Teaching in the Middle School, 16(9), 545–549.
A three-dimensional model and geometry software can help develop students’ spatial reasoning and visualization skills. 8.
Roberge, M. C., & Cooper, L. L. (2010). Map scale, proportion and Google ™ Earth. Mathematics Teaching in the Middle School, 15(8), 448– 457.
Aerial imagery has a great capacity to engage and maintain student interest while providing a contextual setting to strengthen their ability to reason proportionally. Free, on-demand, high-resolution, large-scale aerial photography provides both a bird's eye view of the world and a new perspective on one's own community. This article presents an activity that focuses on proportional reasoning with map scale, a critical part of “Element One, Standard 1” of the “National 261
CHAPTER 18
Geography Standards.” Using images from Google™ Earth, students cross both mathematical and geographic boundaries while learning about map scale and proportional reasoning. In this activity, the authors challenged their students to master two concepts: a) map scale from geography; and b) proportional reasoning from mathematics. They concluded that a great strength of this activity was that the experience of developing the map scale (physically measuring the image-size football field and relating it to its known size) later helped students understand the relationship between values as they constructed proportions or created football-field rulers to calculate distance between objects on the images. 9.
Tracy, D., & Hague, M. (1997). Toys 'r' math. Mathematics Teaching in the Middle School, 2(3). 140–145.
This article describes a study in which toys were used as a learning prop for pupils in seventh grade. The researchers discovered that the motivation of the students to learn about scale, proportion and ratio increased as a result of these activities. The researchers concluded that the program that used toys as pedagogical tools succeeded in the following: a) encouraged the involvement of family members, b) created cognitive activities appropriate for the students, c) created opportunities to bridge age differences, d) emphasized the need for exact measurement techniques, e) introduced the students to such tools as protractors and measuring wheels, f) developed their instincts about the subject, g) encouraged the use of literature to increase understanding, and h) connected the subject matter to the real world. This article is especially recommended for reading in the event that activity 4.3 (What’s the Real Size) is omitted from the course program. ARTICLES RELATED TO PROPORTIONAL REASONING IN GENERAL
10. Abrahamson, D., & Cigan, C. (2003) A Design for Ratio and Proportion Instruction. National Council of Teachers of Mathematics, 8(9), 493–501.
An alternate method for teaching ratio and proportion to 5th grade students is introduced. The research supports exploring patterns of multiplication tables and then moving the lessons learned to the concept of ratio/rate as a single column within the multiplication tables. Teachers interviewed expressed their belief that such a method supports meaningful transitions to ratio and proportion problems. 11. Alcaro, P. C., Alston, A. S, & Katims, N. (2000). Fractions attack! Children thinking and talking mathematically. Teaching Children Mathematics, 6(9), 562–567.
The authors explain how to know when children are thinking mathematically, how to establish a setting that elicits mathematical thinking, and what can be 262
ANNOTATED ARTICLES
learned about children as a result. Fourth grade students think and talk mathematically while tackling a real-life ‘PACKETS’ program. The article also addresses content standards involving proportional reasoning as well as the process standards of problem solving, reasoning, communication, and connections. 12. Beckmann, C. E., Thompson, D. R., & Austin, R. A. (2004). Exploring proportional reasoning through movies and literature. Mathematics Teaching in the Middle school, 9(5), 256–262.
Movie makers use proportional reasoning when they create believable sets in which to portray stories from literature. Several problems are posed for students to consider. 13. Billings, E. M. H. (2001). Problems that encourage proportion sense. Mathematics Teaching in Middle School, 7(1), 10–14.
Esther Billings discusses the problems with simply teaching students how to solve proportions by using the cross multiplication and division method. While this method, when used correctly, does work, it does not allow the students to understand what it is that they are truly doing. Billings argues that qualitative reasoning is what should be addressed in schools and more problems where students should apply this method should show up in classrooms. 14. Bright, G. W., Joyner, J. M., & Wallis, C. (2003), Assessing proportional thinking. Mathematics Teaching in the Middle School, 9(3), 166–172.
Article explores the performance and thinking of eighth- and ninth-grade students in their solution to proportional reasoning problems in multiplechoice and open-ended formats. The two formats provide different pictures of students' proportional reasoning strategies. The assessment analyzed in provided with sample student responses. 15. Cai, J., & Sun, W. (2002). Developing students’ proportional reasoning: A Chinese perspective. In B. H. Litwiller, & G. Bright (Eds.), Making sense of fractions, ratios and proportions, (pp. 195-205). National Council of Teachers of Mathematics 2002 Yearbook. Reston, VA: NCTM.
This article provides an alternative approach to proportional reasoning. The article focuses on teaching concepts from multiple perspectives so that students can develop conceptual understanding across concepts. 16. Chapin, S. H., & Anderson, N. C. (2003). Crossing the bridge to formal proportional reasoning, Mathematics Teaching in the Middle School, 8(8), 420–425.
The article describes a project that helps students make the transition from using an informal conceptual solution method to using the formal proportional 263
CHAPTER 18
formula. The students had many opportunities to reason about a myriad of proportional situations. It can be assigned following the presentation of activity 4.7, The Reduction Triangle. 17. Fernandez, C., Salvador, L., Van Dooren, A., De Bock, D., & Verschaffel, L. (2010). How do proportional and additive methods develop along primary and secondary school? Proceedings of the 34th Conference of the International Group for the Psychology in Mathematics Education, (Vol. 2, 353-360). Belo Horizonte: Brazil.
This study focuses on the transition from additive to multiplicative (proportional) reasoning. In particular, it investigates simultaneously two phenomena that have been studied and isolated during the last years: the development from primary to secondary school of the use of additive methods in proportional situations, and the use of proportional methods in additive situations. The findings presented here indicate that while the over-use of additive methods in proportional situations increased during primary school and decreased during secondary school, the over-use of proportional methods in additive situations increased along primary and secondary school. The presence or absence of integer ratios strongly affected this behavior but the nature of quantities only had a small influence on the use of proportional methods. 18. Fisher, L. (1988). Strategies used by secondary mathematics teachers to solve proportion problems. Journal for Research in Mathematics Education, 19(2), 157–168.
This study investigated the strategies described by secondary school mathematics teachers as they solved proportion problems. The data collected during this research indicated that teachers were not well prepared for teaching multiple methods and strategies to their students. In their conclusion, the author urged equipping teachers with multiple techniques for approaching proportion problem solving. 19. Langrall, C.W., & Swafford J. (2000). Three balloons for two dollars: Developing proportional reasoning. Mathematics Teaching in the Middle School, 6(4), 254–261.
How do students develop proportional reasoning through problem solving? This article identifies the essential components of proportional reasoning and includes recommendations for instruction. 20. Lanius, C. S., & Williams, S. E. (2003). Proportionality: A unifying theme for the middle grades. Mathematics Teaching in the Middle school, 8(8), 392–396.
Middle school mathematics topics are often taught as separate, discrete topics without a unifying thread. Proportionality is a concept with the potential to 264
ANNOTATED ARTICLES
unite, relate, and clarify many important, complex middle grades topics into a cohesive theme. 21. Lo, J. J, Watanabe, T. (1997). Developing ratio and proportion schemes: A story of a fifth grader. Journal for Research in Mathematics Education, 28(2) 216–236.
Bruce, a fifth grader, is followed on his discovery of ratios and proportions. He is given various problems and asked to explain his thinking. After multiple exercises, Bruce differentiates how to solve the problems depending on the numbers given. Some of the techniques he used were scalar reasoning and functional reasoning. 22. Miller, J., & Fey, J. (2000). Proportional reasoning. Mathematics Teaching in the Middle School, 5(5) 310–313.
In this study, students studying under a new, standards-based curriculum were compared with students in a control group. The study examined how students think about solving proportion problems and common misconceptions they ran into. The study concluded that when students are able to use their background knowledge to help them with proportional thinking, it helps develop flexible strategies when solving proportion problems. 23. Moss, J., & Caswell, B. (2004). Building percent dolls: Connecting linear measurement to learning ratio and proportion. Mathematics Teaching in the Middle school, 10(2), 68–74.
This article presents a series of lessons in which grade 5 and 6 students use measurement activities to design and construct proportion dolls. It highlights how measurement can connect learning about percents, decimals, and proportions. The measurement exercises and visual displays evoked discussions of proportions. 24. Newton, K. J. (2010). The sweetest chocolate milk. Mathematics Teaching in the Middle School. 16(3), 148–153.
Using a non-routine problem can be an effective way to encourage students to draw on prior knowledge, work together, and reach important conclusions about the mathematics they are learning. This article discusses a problem on the mathematical preparation of chocolate milk which was adapted from an old book of puzzles (Linn 1969) and has been used for professional development and methods courses, among others. Although it is an interesting problem for secondary school students, the author used it on the first day of a methods course as a way to introduce significant pedagogical ideas. In the chocolate milk problem, the importance of equal parts and equal units is highlighted as students discuss possible solution methods. The successful solution methods can be characterized four ways. The first two methods rely on a deep understanding of two basic yet critical concepts related to fractions: 265
CHAPTER 18
“equal parts” and “equal units.” A third solution strategy, called the “numerical approach,” involves making the problem more concrete. The fourth approach is more formal and involves algebra. This article is appropriate for reading alongside activity 1.3, How Do We Compare, especially part 1.3.1. 25. Pagni, D. L. (2005). Angles, Time, and Proportion. Mathematics Teaching in the Middle School, 10(9), 436–441.
An investigation connects the time on an analog clock and the angle between the minute hand and the hour hand. Clock-angle problems involve two types of different measurements: angles and time. To solve the problem, the relationship between the time shown (or an elapsed time) and the position of the hands (as given by an angle) must be found. 26. Parker, M. (2004). Reasoning and working proportionally with percent. Mathematics in the Middle School, 9(6), 326–330.
This article discusses a specific strategy for teaching percents. The author shows how ‘referent reps’ (referring to a set of three rectangles that give a visual display of the relative sizes of the three quantities in percent problems of part to whole, change, or comparison) can be used to visually show the proportions equated with percent problems. This method can be taught to students in elementary school and then be used as a tool throughout middle school. 27. Sharp, J. M., & Adams, B. (2003). Using a pattern table to solve contextualized proportion problems. Mathematics Teaching in Middle School, 8(8), 432–439.
The authors focus on instructional strategies involving pictorial representations in order to solve contextualized proportion problems. Students used tables, drawings, and other visual representations to enhance learning presented in a week-long, problem-based mathematics curriculum that focused on proportions. The article explains instructional and assessment strategies. 28. Stemn, B. S. (2008). Building middle school students' understanding of proportional reasoning through mathematical investigation. Education, 36(4) 383–392.
The author describes and shares an innovative pedagogical approach that holds promise in contributing to the teaching and learning of proportions in middle school. The teaching and learning of mathematics with understanding framework was used as a vehicle to help 21 seventh-grade students reason proportionally. The findings of this study suggest that a classroom culture that encourages students to make connections between their existing and new ideas, and to reflect and communicate their thinking and ideas, makes an 266
ANNOTATED ARTICLES
important contribution to their emerging understanding of proportions. The use of an authentic and non-routine task involving liquid measurements also heightened their interest, curiosity and enthusiasm, thereby contributing to their excitement about the mathematics they were learning. 29. Van Dooren, W., De Bock, D., Evers, M., & Verschaffel, L. (2009). Students' overuse of proportionality on missing-value problems: How numbers may change solutions. Journal for Research in Mathematics Education, 40(2), 187–211.
Previous research has shown that when confronted with missing-value word problems, primary school students strongly tend to use proportional solution approaches, even if these approaches are inappropriate. The authors investigated whether (besides the missing-value formulation of word problems) the numbers appearing in word problems are part of the superficial cues that lead students to (over)use proportionality. 30. Van Dooren, W., De Bock, D., Verschaffel, L., & Janssens, D. (2003). Improper applications of proportional reasoning. Mathematics Teaching in the Middle school, 9(4), 204–209.
This article describes the authors’ findings concerning the improper proportional reasoning displayed by many students aged 12–16 when solving problems about the areas of enlarged geometric figures, and how persistent the students are in this behavior. It is ideally read after completing the section on scaling, especially after activities involving two- and three-dimensional problems. See also the articles by De Bock et al. (1998); De Bock et al. (2002); and Van Dooren et al. (2005) in the bibliography. 31. Weinberg, L. S., Hammrich P. L., & Bruce, M. H. (2003). The giants project. Mathematics Teaching in the Middle school, 8(8), 406–413.
This article describes a professional development program for upper elementary and middle school teachers that included a sequence of four activities designed to foster improved understanding of the connections among measurement, ratio, scale, and proportion. Similar to the teaching model described in Chapter 3 of this book, the program also recommends including hands-on investigative activities for the teachers, following which the teachers use these same activities with their pupils. The teachers then report back with their findings for discussion and conclusions with their peers. Such a teaching model adds to the professional development of the teachers and increased understanding of the concepts of proportional reasoning. This article is ideal for assignment during the final stage of the professional development course, though it can also be assigned at other times. The analysis can be written up and included in the portfolio that the students prepare for evaluation. 267
CHAPTER 19
BIBLIOGRAPHY
Adjiage, R., & Pluvinage, F. (2007). An experiment in teaching ratio and proportion. Educational Studies in Mathematics, 65, 149–175. Alcaro, P. C., Alston, A. S., & Katims, N. (2000). Fractions attack! Children thinking and talking mathematically. Teaching Children Mathematics. 6(9), 562–567. American Mathematical Society (AMS) and Mathematical Association of America. (2001). The mathematical education of teachers. Providence, RI: Author. Australian Association of Mathematics Teachers Inc. (2008). Position paper on the practice of assessing mathematics learning. Accessed: Avcu, R., & Avcu, S. (2010). 6th grade students’ use of different strategies in solving ratio and proportion problems. Procedia Social and Behavioral Sciences. 9, 1277–1281. Available online at www.sciencedirect.com Ball, D. L., & Cohen, D. K. (1999). Developing practice, developing practitioners: Toward a practicebased theory of professional education. In G. Sykes, & L. Darling-Hammond (Eds.) Teaching as the learning profession: Handbook of policy and practice (pp.3–32). San Francisco: Jossey Bass. Ball, D. L., Thames, M. H., & Phelps, G. (2008). Content knowledge for teaching: What makes it special? Journal of Teacher Education, 59(5), 389–407. Baumert, J., Kunter, M., Blum, W., Brunner, M., Voss, T., Jordan, A., Klusmann, U., Krauss, S., Neubrand, M., & Tsai, Y. M. (2010). Teachers' mathematical knowledge, cognitive activation in the classroom, and student progress. American Educational Research Journal, 47(1), 133–180. Behr, M. J., Harel, G., Post, T., & Lesh, R. (1992). Rational Number, Ratio, and Proportion. In D. A. Grouws (Ed.), Handbook of research on mathematics teaching and learning (pp.296–333). New York: MacMillan Publishing. Ben-Chaim, D., Fey, J. T., Fitzgerald, W. M., Benedetto, C., & Miller, J. (1998). Proportional reasoning among 7th grade students with different curricular experiences. Educational Studies in Mathematics, 36, 247–273. Ben-Chaim, D., Ilany, B. S., & Keret, Y. (2002). Mathematical and pedagogical knowledge of pre- and in-service elementary teachers before and after experience in proportional reasoning activities. In A. D. Cockburn, & E. Nardi (Eds.) Proceedings of the 26th International Conference for the Psychology of Mathematics Education (Vol. 2, pp. 81–88). Norwich, U.K. Ben-Chaim, D., Ilany, B. S., & Keret, Y. (2008). Authentic investigative activities for teaching ratio and proportion in elementary and middle school mathematics teacher education. Journal of the Korea Society of Mathematical Education Series D: Research in Mathematical Education, 12(2), 85–100. Ben-Chaim, D., Keret, Y., & Ilany, B. S. (2007). Designing and implementing authentic investigative proportional reasoning tasks: The impact on pre-service mathematics teachers’ content and pedagogical knowledge and attitudes. Journal of Mathematics Teacher Education, 10, 333–340. Berk, D., Taber, S. B., Gorowara, C. C., & Poetzl, C. (2009). Developing prospective elementary teachers’ flexibility in the domain of proportional reasoning. Mathematical Thinking and Learning, 11, 113–135. Berliner, D. C. (1986). In pursuit of the expert pedagogue. Educational Researcher, 15(7), 5–13. Billings E. M. H. (2001). Problems that encourage proportion sense. Mathematics Teaching In the Middle School, 7(1), 10–14. Birenbaum, M., & Rosenau, S. (2006) Assessment preferences, learning orientations, and learning strategies of pre-service and in-service teachers. Journal of Education for Teaching, 32(2), 213–225. 269
CHAPTER 19 Borowski, E. J., & Borwein, J. M. (1989). Collins Dictionary of Mathematics. London, U. K.: Harper Collins Publishers. Brown, G. (2004). Teachers' conceptions of assessment: Implications for policy and professional development. Assessment in Education, 11(3), 301–318. Chamberlin, M. T., Farmer, J. D., & Novak, J. D. (2008). Teachers' perceptions of assessments of their mathematical knowledge in a professional development course. Journal of Mathematics Teacher Education, 11, 435–457. Chazan, D., Ben-Chaim, D., & Gorman, J. (1998). Shared Teaching assignments in the service of mathematics reform: Situated professional development. Teaching and teacher education, 14(7), 687–702. Clapham, C., & Nicholson, J. (2009). The Concise Oxford Dictionary of Mathematics (fourth edition). USA: Oxford University Press. Clark, C. M., & Peterson, P. L. (1986). Teachers' thought processes. In M. C. Wittrock (Ed.), Handbook of Research on Teaching (3rd ed., pp. 255–296). New York: Macmillan. Cobb, P. (1997). Accounting for mathematical learning in social context of the classroom. L’Educazione Mathematica, 5, 65–81 (part one), 123–142 (part two). Cramer, K., Post, T., & Currier, S. (1993). Learning and teaching ratio and proportion: Research implications. In D.T. Owens (Ed.), Research ideas for the classroom: Middle grades mathematics (pp.159–178). New York: MacMillan Publishing. De Bock, D., Van Dooren, W., Janssens, D., & Verschaffel, L. (2002). Improper use of linear reasoning: An in-depth study of the nature and the irresistibility of secondary school students' errors. Educational Studies in Mathematics, 50, 311–334. De Bock, D., Verschaffel, L., & Janssens, D. (1998). The Predominance of the Linear Model in secondary school students' solutions of word problems involving length and area of similar plane figures. Educational Studies in Mathematics, 35, 65–83. Doerr, H. M., & English, L. D. (2006). Middle grade teachers’ learning through students engagement with modeling tasks. Journal of Mathematics Teacher Education, 9, 5–32. Elbaz, F. L. (1983). Teacher thinking; A study of practical knowledge. London: Croom Helm. Empson, S. B., & Junk, D. L. (2004). Teachers' knowledge of children's mathematics after implementing a student-centered curriculum. Journal of Mathematics Teacher Education, 7, 121– 144. Empson, S. B., & Turner, E. E. (2006). The Emergence of Multiplicative Thinking in Children’s Solutions to Paper Folding Tasks. Journal of Mathematical Behavior, 25, 46–56. Even, R., & Ball, D. L. (Eds.) (2009). The professional education and development of teachers of mathematics. The 15th ICMI Study. New York : Springer. Even, R., & Tirosh, D. (1995). Subject-matter knowledge and knowledge about students as sources of teacher presentation of the Subject matter. Educational Studies in Mathematics, 29, 1–20. Even, R., & Tirosh, D. (2002). Teacher knowledge and understanding of students' mathematics learning. In L. English (Ed.) Handbook of international research in mathematics education (pp. 219–240). Mahwah, NJ: Erlbaum. Fischbein, E. (1982). Intuition and proof. For the Learning of Mathematics, 3(2), 9–18, 24. Fischbein, E. (1987). Intuition in science and mathematics: An educational approach. Dordrecht, Holland: Reidel Publishing. Fischbein, E. (1994). The interaction between the formal, the algorithmic, and the intuitive components in a mathematical activity. In R. Biehler, R.W. Scholz, R. Strasser, & B. Winkelmann, (Eds.) Didactics of mathematics as a scientific discipline (pp. 231–245). Dordrecht, The Netherlands: Kluwer Academic Press. Fischbein, E., Manzat, I., & Barbat, I. (1975). The development of the investigative capacity in students. Internal Publication of Tel-Aviv University, Israel. Fischbein, E., Deri, M., Nello, M.S., & Marino, M.S. (1985). The role of implicit models in solving verbal problems in multiplication and division. Journal for Research in Mathematics Education, 16(1), 3–17. 270
BIBLIOGRAPHY Fischbein, E., Jehiam, R., & Cohen, D. (1994). The irrational number and the corresponding epistemology and obstacles. In P. J. Pedro,& M. J. Filipe (Eds.) Proceedings of the Eighteenth International Conference for the Psychology of Mathematics Education (Vol.2, pp. 352–359). Lisbon, Portugal: University of Lisbon. Fisher, C. L. (1988). Strategies used by secondary mathematics teachers to solve proportional problems. Journal for Research in Mathematics Education, 19(2), 157–168. Ford, M. I. (1994). Teachers' beliefs about mathematical problem solving in the elementary school. School Science and Mathematics, 94, 314–322. Freudenthal, H. (1978).Weeding and sowing: A preface to a science of mathematical education. Dordrecht: Riedel. Freudenthal, H. (1983). Didactical phenomenology of mathematical structures (pp. 178–209). Dordrecht: Reidel. Fuson, K. C., & Abrahamson, D. (2005). Understanding ratio and proportion as an example of the apprehending zone and conceptual-phase problem-solving models. In J. Campbell (Ed.), Handbook of mathematical cognition (pp. 213–234). New York: Psychology Press. Gallenstein, N. L., & Hodges, D. (2011). Mathematics for all: Instructional strategies to assist students with learning challenges. Association for Childhood Education International (ACEI). Greer, B. (1987). Non-conservation of multiplication and division involving decimals. Journal of Research in Mathematics Education, 18, 37–45. Greer, B. (1993). The modeling perspective on world problems. Journal of Mathematical Behavior, 12, 239–250. Harel, G., Behr, M., Lesh, R., & Post, T. (1994). Invariance of ratio: The case of children's anticipatory scheme for constancy of taste. Journal for Research in Mathematics Education, 25(4), 324–345. Harel, G., Behr, M., Post, T., & Lesh, R. (1994). The impact of the number type on the solution of multiplication and division problems: Further investigations. In G. Harel, & J. Confrey (Eds.) The development of multiplicative reasoning in the learning of mathematics (pp. 363–384). Albany: State University of New York Press. Harel, G., & Confrey, J. (Eds.) (1994). The development of multiplicative reasoning in the learning of mathematics. Albany: State University of New York Press. Harrison, J. (2007). The assessment of ITT Standard One, professional values and practice: Measuring performance, or what? Journal of Education for Teaching, 33(3), 323–340. Hart, K. M. (Ed.) (1981). Children's understanding of mathematics (pp. 11–16). London: John Murray Ltd. Hoffer, A. (1988). Ratios and proportional thinking. In T. Post (Ed.) Teaching mathematics in grades K–8: Research based methods (pp. 285–313). Boston: Allyn and Bacon. Howe, C., Nunes, T., & Bryant, P. (2010a). Intensive quantities: Why they matter to developmental research. British Journal of Developmental Psychology, 28, 307–329. Howe, C., Nunes, T., & Bryant, P. (2010b). Rational number and proportional reasoning: Using intensive quantities to promote achievement in mathematics and science. International Journal of Science and Mathematics Education, 9(2) 391–417. Ilany B. S., Keret, Y., & Ben-Chaim, D. (2004). Implementation of a model using authentic investigative activities for teaching ratio and proportion in pre-service teacher education. In H. M. Johnson, & F. A. Berit (Eds.) Proceedings of the 28th International Conference for the Psychology of Mathematics Education (vol.3, pp. 81–88). Bergen, Norway: PME. Inhelder, B., & Piaget, J. (1958). The growth of logical thinking from childhood to adolescence. New York: Basic Books. Jaworski, B. (2005). Learning communities in mathematics: Creating an inquiry community between teachers and didacticians. In R. Barwell, & A. Noyes (Eds.) Research in Mathematics Education: Papers of the British Society for Research into Learning mathematics (Vol. 7, pp, 101–119). London: BSRLM.
271
CHAPTER 19 Jaworski, B. (2006). Theory and practice in mathematics teaching development: Critical inquiry as a mode of learning in teaching. Journal of mathematics teacher education. Special issue: Relations between theory and practice in mathematics teacher education. 9(2), 187–211. Jaworski, B. (2007). Learning communities in mathematics: Research and development in mathematics teaching and learning. In C. Bergsten, B. Gervholm, H. S. Masoval, & F. Ronning (Eds.) Relating practice and research in mathematics education. Proceedings of Norma 05, Fourth Nordic conference on mathematics education (pp. 71–96). Trondheim, Norway: Tapir Academic Press. Kaput, J., & West, M. M. (1994). Missing-value proportional reasoning problems: Factors affecting informal reasoning patterns. In G. Harel, & J. Confrey (Eds.) The development of multiplicative reasoning in the learning of mathematics (pp. 235–287). Albany: State University of New York Press. Karplus, R., Pulos, S., & Stage, E. K. (1983a). Early adolescents' proportional reasoning on "rate" problems. Educational Studies in Mathematics, 14(3), 219–233. Karplus, R., Pulos, S., & Stage, E. K. (1983b). Proportional reasoning of early adolescents. In R. Lesh & M. Landau (Eds.), Acquisition of mathematics concepts and processes (pp. 45–90). New York: Academic Press. Kennedy, N. S. (2009). Towards a dialogical pedagogy: Some characteristics of a community of mathematical inquiry. Eurasia Journal of Mathematics, Science & Technology Education, 5(1), 71– 78. Keret, Y. (1999). Change processes in adult proportional reasoning: Student teachers and primary mathematics teachers, after exposure to ratio and proportion study unit. In O. Zaslavsky (Ed.) Proceedings of the 23rd International Conference for the Psychology of Mathematics Education (vol.3, pp. 145–152). Haifa, Israel. Keret, Y., Ben-Chaim, D., & Ilany, B. S. (2003). A model using authentic investigative activities for teaching ratio and proportion in pre-service elementary education. Proceedings of SEMT '03— International Symposium Elementary Mathematics Teaching, (pp. 94–99). Prague, Czech Republic. Lamon, S. J. (1993). Ratio and proportion: Connecting content and children's thinking. Journal for Research in Mathematics Education, 24(1), 41–61. Lamon, S. J. (1994). Ratio and proportion: Cognitive foundations in unitizing and norming. In G. Harel, & J. Confrey (Eds.) The development of multiplicative reasoning in the learning of mathematics (pp. 89–120). Albany: State University of New York Press. Lamon, S. J. (2006). Teaching fractions and ratios for understanding: Essential content knowledge and instructional strategies for teachers. Mahwah, NJ: Lawrence Erlbaum Associates. Lamon, S. J. (2007). Rational numbers and proportional reasoning: Toward a theoretical framework for research. In F. K. Lester (Ed.) Second handbook of research on mathematics teaching and learning (Vol. 1, pp. 629–668). Charlotte, NC: Information Age Publishing. Langrall, C. W., & Swafford, J. (2000). Three balloons for two dollars: Developing proportional reasoning. Mathematics Teaching in the Middle School, 6(4), 254–261. Lappan, G., Fey, J. T., Fitzgerald, W. M., Friel, S. N., & Phillips, E. D. (2002). CMP – Connected Mathematics Project. Michigan State University: Prentice Hall. Lappan, G., Phillips, E. D., & Fey, J. T. (2007). The case of connected mathematics. In C. R. Hirsh (Ed.), Perspectives on the design and development of school mathematics curricula (pp. 67–80). Reston, VA: National Council of Teachers of Mathematics. Lappan, G., & Phillips, E. D. (2009). Challenges in US mathematics education through a curriculum developer lens. Educational Designer, Journal of the International Society for Design and Development in Education, 1(3), 1–9. Retrieved from: http://www.educationaldesigner. org/ ed/volume1/ issue3/article11/ Lawton, C.A. (1993). Contextual factors affecting errors in proportional reasoning. Journal for Research in Mathematics Education, 24, 460–466. Leinhardt, G., Weidman, C., & Hammond, K. M. (1987). Introduction and integration of classroom routines of expert teachers. Curriculum Inquiry, 17(2), 135–175.
272
BIBLIOGRAPHY Leinhardt, G., Young, K. M., & Merriman, J. (1995). Integrating professional knowledge: The theory of practice and the practice of theory. Learning and Instruction, 5, 401–408. Lesh, R., Post, T. R., & Behr, M. (1988). Proportional reasoning. In J. Hiebert, & M. Behr (Eds.) Number concepts and operations in the middle grates (pp. 93–118). Reston, VA: National Council of Teachers of Mathematics. Lester, F. K. Jr., Masingila, J. O., Mau; S. T., Lambdin, D. V., Pereiados Santos, V. M., & Raymond, A. M. (1994). Learning how to teach via problem solving. In D. B. Aichel, & A. F. Coxford (Eds.) Professional development for teachers of mathematics (pp. 152–166). Reston, VA: NCTM. Litwiller, B., & Bright, G. (Eds.). (2002). Making sense of fractions, ratios and proportions. 2002 NCTM Yearbook. Reston, VA: National Council of Teachers of mathematics. Lobato, J., Ellis, A.B., Charles, R.I., & Zbiek, R. M. (2010). Developing Essential Understanding of Ratios, Proportions, and Proportional Reasoning for Teaching Mathematics: Grades 6-8. Reston, VA: NCTM. Loucks-Horsley, S., Stiles, K. E., Mundry, S., Love, N., & Hewson, P. W. (2010). Designing professional development for teachers of science and mathematics education (Third ed., pp.157– 278). Thousand Oaks, CA: Corwin, A SAGE Company. Ma, L. (1999). Knowing and teaching elementary mathematics: Teachers' understanding of fundamental mathematics in China and the United States. Mahwah, NJ: Lawrence Erlbaum Associates. Macías, A.H. (2002). Alternative assessment: Responses to commonly asked questions. In J.C. Richards, & W. A. Renandya (Eds.). Methodology in language teaching: An anthology of current practice (pp. 339- 343). Cambridge: Cambridge University Press. Misailidou, C., & Williams, J. (2003). Diagnostic of children's proportional reasoning. The Journal of Mathematical Behavior, 22(3), 335–368. Modestou, M., & Gagatsis, A. (2007). Students' improper proportional reasoning: A result of the epistemological obstacle of “linearity”. Educational Psychology, 27(1), 75–92. National Research Council, Mathematical Sciences Education Board. (1989). Everybody counts: A report to the nation on the future of mathematics education. Washington, D.C.: National Academy Press. National Council of Teachers of Mathematics (1989). Curriculum and evaluation standards for school mathematics. Reston, VA: Author. National Council of Teachers of Mathematics (1991). Professional standards of teaching mathematics. Reston, VA: Author. National Council of Teachers of Mathematics (1995). Assessment standards for mathematics. Reston, VA: Author. National Council of Teachers of Mathematics. (2000). Principles and standards for school mathematics. Reston, VA: Author. Newton, K. J. (2010). The sweetest chocolate milk. Mathematics Teaching in the Middle School, 16(3), 148–153. Noelting, G. (1980a). The development of proportional reasoning and the ratio concept: Part 1: Differentiation of stages. Educational Studies in Mathematics, 11, 217–253. Noelting, G. (1980b). The development of proportional reasoning and the ratio concept: Part 2: Problem structure at successive stages: Problem-solving strategies and the mechanism of adaptive restructuring. Educational Studies in Mathematics, 11, 331–363. Nunes, T., Schliemann, A.D., & Carraher, D.W. (1993). Street mathematics and school mathematics (pp. 77–126). Cambridge University Press. Panoutsos, C., Karantzis, I., & Markopoulos, C. (2009). 6th grade students' strategies in ratio problems. In M., Tzekaki, M. Kaldrimidou, & H. Sakonidis (Eds.) Proceedings of the 33rd Conference of the International Group for the Psychology of Mathematics Education (Vol. 4, pp. 289– 296).Thessaloniki, Greece: PME.
273
CHAPTER 19 Peled, I., & Hershkovitz, S. (2004). Evolving research of mathematics teacher educators: The case of non-standard issues in solving standard problems. Journal of Mathematics Teacher Education, 7, 299–327. Post, T., Behr, M., & Lesh, R. (1988). Proportionality and the development of pre-algebra understandings. In A. Coxford & A. Shulte (Eds.) The Idea of Algebra K-12: Yearbook National Council of Teachers of Mathematics (pp. 78–90). Reston, VA: NCTM. Potari, D., Sakonidis, H., Chatzigoula, R., & Manaridis, A. (2010). Teachers’ and researchers’ collaboration in analysing mathematics teaching: A context for professional reflection and development. Journal of Mathematics Teacher Education, 13(6), 473–485. Quintero, A. H. (1987). Helping children understand ratios. Arithmetic Teacher, 34(9), 17–21. Resnick, L. B. (1983). Mathematics and science learning: A new concept. Science, 220, 477–478 Rust, C. (2007). Towards a scholarship of assessment. Assessment and Evaluation in Higher Education, 32(2). 229–237. Sainsbury, E. J., & Walker R. A. (2007). Assessment as a vehicle for learning: Extending collaboration into testing. Assessment and Evaluation in Higher Education, 33(2). 103–117. Sherin, M. G. (2002). When teaching becomes learning. Cognition and Instruction, 20(2), 119–150. Shulman, L. S. (1986). Those who understand: Knowledge growth in teaching. Educational Researcher, 15, 4–14. Shulman, L. S. (1987). Knowledge and teaching: Foundations of the new reform. Harvard Educational Review, 57, 1–22. Sowder, J., Armstrong, B., Lamon, S., Simon, M., Sowder, L., & Thompson, A. (1998). Educating teachers to teach multiplicative structures in the middle grades. Journal of Mathematics Teacher Education, 1, 127–155. Steinthorsdottir, O. B. (2006). Proportional reasoning: Variable influencing the problems difficulty level and one's use of problem solving strategies. In J. Novotna, H. Moraova, M. Kratka, & N. Stehlikova (Eds.) Proceedings 30th Conference of the International Group for the Psychology of Mathematics Education (Vol. 5, 169–176). Prague: PME. Stemn, B. S. (2008). Building middle school students’ understanding of proportional reasoning through mathematical investigation. Education 3–13: International Journal of Primary, Elementary and Early Years Education, 36(4), 383–392. Stern, E., & Lewinson-Gilboa, A. (Eds.). (1993). The New Encyclopedia of Archaeological Excavations in the Holy Land (Four Volumes). (pp. 214–235). New York: Simon and Schuster. Thompson, C. S., & Bush, W. S. (2003). Improving middle school teachers' reasoning about proportional reasoning. Mathematics Teaching in the Middle School, 8(8), 398–403. Thompson, P. W. (1994). The development of the concept of speed and its relationship to concepts of rate. In G. Harel & J. Confrey (Eds.) The development of multiplicative reasoning in the learning of mathematics (pp.179–234). Albany: State University of New York Press. Thompson, P. W., & Thompson, A.G. (1994). Talking about rates conceptually, part I: A teacher's struggle. Journal for Research in Mathematics Education, 25(3), 279–303. Tirosh, D., & Graeber, O. A. (1990). Evoking cognitive conflict to explore pre-service teachers’ thinking. Journal for Research in Mathematics Education, 21(2), 98–108. Tirosh, D., & Tsamir, P. (2004). What can mathematics education gain from the conceptual change approach? And what can the conceptual change approach gain from its application to mathematics education? Learning and Instruction, 14, 535–540. Tomorrow 98. (1994). Report of the Superior Committee on Science, Mathematics and Technology Education in Israel. State of Israel, Ministry of Education, Culture and sport. English Edition: May 1994. Tourniaire, F., & Pulos, S. (1985). Proportional reasoning: a review of the literature. Educational Studies in Mathematics, 16, 181–204. Towers, J. (2010). Learning to teach mathematics through inquiry: A focus on the relationship between describing and enacting inquiry-oriented teaching. Journal of Mathematics Teacher Education, 13(3), 243–263. 274
BIBLIOGRAPHY Tracy, D., & Hague, M. (1997). Toys 'r' math. Mathematics Teaching in the Middle School, 2(3), 140–145. Van Dooren, W., De Bock, D., Evers, M., & Verschaffel, L. (2009). Students' overuse of proportionality on missing-value problems: How numbers may change solutions. Journal for Research in Mathematics Education, 40(2), 187–211. Van Dooren, W., De Bock, D., Hessels, A., Janssens, D., & Verschaffel, L. (2005). Not everything is proportional: Effects of age and problem type on properties of overgeneralization. Cognition and Instruction, 23(1), 57–86. Vergnaud, G. (1994). Multiplicative conceptual field: What and why? In G. Harel, & J. Confrey (Eds.) The development of multiplicative reasoning in the learning of mathematics (pp.41–59). Albany: State University of New York Press. Verschaffel, L., De Corte, E., & Lasure, S. (1994). Realistic considerations in mathematical modeling of school arithmetic word problems. Learning and Instruction, 4, 273–294. Walker, E. N. (Summer 2007). Rethinking professional development for elementary mathematics teachers. Teacher Education Quarterly, 34(3), 113–134. Warfield, V. H. (1992). Didacticque through the back door. MER Journal, 7. 4–5. Widiatmoko, O. (2005a). Authentic assessment in EFL. Jakarta: Pusat Pengembangan Penataran Guru Bahasa. Widiatmoko, O. (2005b). Overview of portfolio as an alternative assessment in EFL. Jakarta: Pusat Pengembangan Penataran Guru Bahasa. Wiessglass, J. (1994) Changing mathematics teaching means changing ourselves: Implications for professional development. In D. B. Aichele & A. F. Coxford (Eds.) Professional development for teachers of mathematics (pp. 67–78). Reston VA: Author. Zambo, R., & Zambo, D. (Winter 2008). The impact of professional development in mathematics on teachers' individual and collective efficacy: The stigma of underperforming. Teacher Education Quarterly, 35(1), 159–168. Zaslavsky, O., & Leikin, R. (2004). Professional development of mathematics teacher educators: Growth through practice. Journal of Mathematics Teacher Education, 7, 5–32.
275