Frank Mueller-Langer; Marc Scheufen; Patrick Waelbroeck: Does Online Access Promote Research in Developing Countries?
Munich Discussion Paper No. 2017-4 Department of Economics University of Munich Volkswirtschaftliche Fakultät Ludwig-Maximilians-Universität München
Online at http://epub.ub.uni-muenchen.de/31973/
Does Online Access Promote Research in Developing Countries? Empirical Evidence from Article-Level Data
Frank Mueller-Langer, Max Planck Institute for Innovation and Competition, Munich Marc Scheufen, Ruhr University Bochum Patrick Waelbroeck, Télécom ParisTech
Abstract Universities in developing countries have rarely been able to subscribe to academic journals in the past. The “Online Access to Research in the Environment” initiative (OARE) provides institutions in developing countries with free online access to more than 5,700 environmental science journals. Here we analyze the effect of OARE on scientific output in five developing countries. We apply difference-in-difference estimation using panel data for 18,955 articles from 798 research institutions. We find that online access via OARE increases publication output by at least 43% while lower-ranked institutions located in remote areas benefit less. Results are robust when we apply instrumental variables to account for information diffusion and Bayesian estimation to control for self-selection.
Keywords: Online Access, Academic Publishing, Information Diffusion Processes, Instrumental Variables, Bayesian Estimation JEL codes: O33 (Technological Change: Choices and Consequences, Diffusion Processes), L17 (Open Source Products and Markets)
2
1.
Introduction
While global online access has laid the groundwork for involving all nation-states in science, universities in developing countries have rarely been able to subscribe to academic journals in the past (Annan, 2004). For instance, most libraries in Sub-Saharan African countries had no access to any scientific journal for years (Suber and Arunachalam, 2005). The “Research4Life” program under the auspices of the World Health Organization (WHO) seeks to provide free or reduced-fee online access for researchers of registered institutions in the fields of environmental science, health, agriculture and innovation. Focusing on environmental science and five countries in Sub-Saharan Africa (Kenya, Nigeria) and South America (Bolivia, Ecuador, Peru), we investigate the impact of the OARE initiative, which was launched by the United Nations Environment Programme (UNEP) and Yale University in October 2006. In cooperation with 461 OARE partners, the initiative today provides access to more than 5,700 peer-reviewed academic journals in the field of environmental science in more than 100 eligible countries. With respect to eligibility, the initiative distinguishes between so-called Band 1 and Band 2 countries. Registered research institutions in Band 1 countries (gross national income (GNI) per capita below $1,600) receive free online access to all journals that are available under the OARE initiative whereas institutions in Band 2 countries (GNI per capita below $5,000) receive access for a reduced fee of $1,000 per year. Using bibliometric article-level data from Web of Science (WoS) and OARE registration data from January 2000 to June 2012, we analyze the impact of OARE on the publication output of research institutions. In particular, we use a difference-in-difference estimation method that compares differences in publication output between institutions that registered with the OARE initiative and those that did not before and after joining OARE. Applying this method to OARE adoption raises two issues. First, information about the existence or prior experience with the Research4Life program is required to enable institutions to register with the OARE initiative. Our analysis of the information diffusion process suggests that only around 13% of
3 all eligible institutions had registered with the OARE initiative more than 5 years after its launch. We use the underlying information diffusion process as the basis for an instrumental variables approach to account for potential endogeneity of our treatment variable (OARE membership). Second, we apply a Bayesian estimation method that explicitly models the correlation between unobserved variables, controlling for possible self-selection of institutions into the OARE initiative. We find that OARE membership increases the overall quantity that is produced by a research institution by at least +43%. However, lower-ranked institutions farther away from their country’s largest domestic city benefit less from OARE membership. These results are robust when we use instrumental variables and Bayesian estimation methods. The remainder of the paper is organized as follows: Section 2 relates our work to the literature on the economics of science and innovation. In Section 3, we provide an overview of the data and of the diffusion patterns of the Research4Life initiatives. Section 4 describes the methodology and the variables under study. In Section 5, we present the results of our empirical analysis and discuss robustness checks. Section 6 concludes.
2.
Related literature
The principles of access to scientific research have recently attracted widespread interest from economics scholars (Furman and Stern, 2011; McCabe and Snyder, 2015; Sorensen, 2004) and policy-makers (European Commission, 2012). In particular, open access (OA) has been subjected to a broad discussion on whether it is a promising new business model in the digital economy (Suber, 2012; Scheufen, 2015). Two arguments mainly drive this debate. First, with the advent of the internet and the development of technologies to digitize information goods, scientific journal publishers have found new means to price discriminate (“big deals”), which has led to a sharp increase in journal subscription prices (Bergstrom and Bergstrom, 2004; Ramello, 2010) and hence higher costs of access to research. In contrast, OA provides free
4 and unrestricted access to academic works (McCabe and Snyder, 2005 & 2014). Second, the copyright system that is behind these pricing schemes is built on the idea that commercial exclusivity granted by copyright generates the main incentive for the creator of a copyright work. Researchers, in contrast, are primarily motivated by reputation rather than by financial gains. Especially for journal articles, authors typically do not receive any royalties, since the copyright is generally transferred to the publisher. Some authors have even argued that an abolishment of copyright and hence a forced OA regime would foster scholarly esteem (Shavell, 2010).1 The literature investigating the OA model can broadly be structured along three lines of research: studies investigating the effects of alternative publishing models (Shavell, 2010; Jean and Rochet, 2010); studies analyzing the impact of different publishing models on readership and citations (McCabe and Snyder, 2014 & 2015); and studies directed towards a scientist’s attitude and behavior regarding OA publishing (Hanauske et al., 2007; Eger et al., 2015). Our paper seeks to contribute to the first line of research. In particular, we study the effects of a change in the ability of researchers in developing countries to access academic works. We analyze the impact of this change before and after these researchers’ institutions joined the OARE initiative, and we compare the results to those for which the access mode remained unchanged over time. Our research discusses the impact of free or reduced-fee online access on scientific production in developing countries, for which we find little prior literature. However, the need for such research is emphasized by Annan (2004). Ross (2008) analyzes both citation and publication patterns for the Research4Life initiatives in health (HINARI) and agricultural science (AGORA), providing descriptive statistics for different regions of the world. In contrast to Ross (2008), our approach allows us to examine causal 1
Shavell (2010) argues that (a) readership is higher under open access, (b) a higher readership increases scholarly esteem, (c) research institutions would bear the costs of a shift towards the “author pays” model and (d) there are several reasons why legal action is necessary to facilitate a change towards an universal OA regime. Several researchers have critically assessed the assumptions made in Shavell (2010). See Mueller-Langer and Scheufen (2013) for a review.
5 effects and interaction effects of Research4Life by applying instrumental variables and Bayesian estimation techniques in addition to simple OLS estimation. In particular, we use article characteristics and institutional fixed effects such as rank, city population and the distance to the largest domestic city to further investigate OARE and interaction effects. We also provide evidence on the information diffusion process of Research4Life initiatives in free and reduced-fee access countries. Evans and Reimer (2009a) emphasize the need to further assess the role of open access and particularly the success of the Research4Life programs in developing countries. Evans and Reimer (2009b, p. 5) show that “lower-middle-income countries tend to much more frequently cite freely available journals, but the poorest countries do not.” Thus, scientists in the poorest countries seem to have virtually no access to online content. Evans and Reimer (2009a) suggest that poor infrastructure and slow internet access may explain this difference in citation rates. McCabe and Snyder (2015) criticize their paper, arguing that Evans and Reimer (2009a) do not control for citation trends. Our approach complements the two papers, as we analyze both input and output trends of access to academic works for researchers in the developing world.2 We contribute to this strand of literature by investigating the role of free and reduced-fee online access in developing countries on the scientific production function. Our paper also contributes to the literature in the broader field of economics of science and innovation investigating the role of science and scientific research in the advancement of technologies and hence in economic growth (Dasgupta and David, 1994; Dosi, 1988; Merton, 1973; Murray et al., 2009).3 In particular, we provide evidence of significant negative interaction effects between the OARE treatment and the rank of an institution (better institutions benefit more) as well as the distance of an institution to the largest domestic city (institutions closer to the main city benefit more). The intuition behind these interaction 2
Similarly to McCabe and Snyder (2015), we find evidence for a significant interaction effect in the sense that lower-ranked institutions farther away from the largest domestic city benefit less from the OARE treatment. 3 See also Stephan (1996) for an overview of the economics of science literature.
6 effects can be related to the concept of absorptive capacity. Cohen and Levinthal (1989, 1990) suggest that scientific knowledge is a premise for both the production of new knowledge and the adoption of external knowledge. Following the authors, absorptive capacity can be built either directly (i.e. by using specific measures to create knowledge) or indirectly (i.e. as an external or internal knowledge spillover). In this regard, Lane et al. (2002), Veugelers (1997) and Mahnke et al. (2005) emphasize the role of mutual learning and learning from networks and cooperation. We find that the OARE initiative has a smaller effect on the performance of researchers at lower-ranked institutions in cities farther away from the largest domestic city. There are two main arguments to support this result. First, online access to research requires a decent level of ICT infrastructure, which can be assumed to be less developed in cities farther away from the largest domestic city.4 Second, the absorptive capacity needed and the awareness of the technological means to foster the academic performance of researchers at a given research institution may be greater at the best institutions.5 The paper relates to the literature on the diffusion of new technology (Geroski, 2000; Griliches, 1957; Hall, 2004; Mansfield, 1961 & 1963). Following Hall and Khan (2003), the diffusion of new technology is the aggregate result of individual decisions of potential adopters who weigh the uncertain expected benefits of adoption against its present costs in an environment characterized by limited information. Notably, for Band 1 countries the direct monetary costs of OARE adoption are rather low. Without any information problems, technology diffusion theory would therefore suggest that a substantial share of universities in Band 1 countries should adopt OARE, as the expected returns of adoption are unlikely to be lower than its expected costs. Our paper shall contribute to this strand of works by estimating the expected returns of OARE adoption in terms of scientific output. The paper also relates to 4
In this regard our dataset allows us to analyze treatment and control group institutions within a given city. That is, we study institutions for which the local conditions such as ICT infrastructure are most likely the same. 5 The Ranking Web of Universities allows us to take account of the web visibility and web presence of institutions. We use this variable as a proxy for the technical expertise and equipment institutions need in order to set up online access to journals.
7 the literature on the spread and intensity of adoption of a new technology (Stoneman and Battisti, 2010). For instance, our results of the first-stage equation for the instrumental variables and Bayesian estimations suggest that knowledge spillovers from other Research4Life member institutions in the same city may drive the spread of adoption of OARE (Appendix 1).6 Finally, Stoneman and Battisti (2010) note that panel data on the adoption of new technology including its launch and characteristics of its adopters is extremely rare. We contribute to this strand of research by analyzing a unique panel dataset on the adoption of OARE in five countries that includes registration dates as well as the characteristics of adopting institutions and of cities where potential adopters are located. The spread (or breadth) of adoption is measured by the cumulative number of institutions that joined OARE over time. In addition, the intensity or depth of OARE adoption is measured by the research output of universities that joined OARE as compared to the research output of institutions that did not join OARE.
3.
Data and proceedings
3.1. Data Our dataset is built from three main sources. First, we collected bibliometric article-level data from WoS for the five countries under study.7 Second, we gathered institutional data on Research4Life membership with information on the institutions and their registration with OARE. Third, we extracted the rank of the institutions from the Ranking Web of Universities. Regarding the first data source, we collected a panel dataset containing metadata for 35,056 research articles. The period under study starts in January 2000 (quarter 1) and ends in June 2012 (quarter 50). We obtain article metadata from WoS. The WoS data contain the 6
See also Section 5.1. “Treatment effect”. We focus our analysis on five countries for the following reasons. First, we choose the most productive countries in terms of the total number of research articles from January 2000 to June 2012 for both geographical regions (Sub-Saharan Africa and South America). Second, we look at countries that exceed a threshold of at least 20 OARE institutions. 7
8 institutions of the authors, the title of the paper, journal information (publication date, number of pages, volume number, issue number) and the number of citations. Overall, we have 798 institutions publishing articles over a period of at least two quarters.8 We use article-level data for assigning different characteristics to each single article, accounting for the field of research, institutional affiliations of the authors, cooperation with authors from outside the developing world and other controls such as number of references, pages etc. Since the OARE initiative offers free or reduced-fee online access to research in environmental science, we create a dummy variable indicating whether an article falls under an OARE research area. We define an article as falling under an OARE research area if its “Research Area” provided by WoS also appears frequently in the titles of OARE journals. In particular, we proceed as follows. First, for all articles under study, we extract all terms from the WoS “Research Area” variable. Second, we order these research area terms by frequency, i.e., we count how many articles in the data fall under a given single-word term (henceforth, WoS research area terms). For instance, in the case of articles of authors affiliated with Nigerian universities, the term “environmental” appears 2,179 times, whereas the term “architecture” appears once. Now we extract the 200 most frequent terms that appear in the complete list of titles of OARE journals (henceforth, top 200 title terms). Matching these two lists (WoS research area terms and top 200 title terms), we obtain the top 50 OARE research areas. The top 50 OARE research areas are given by the 50 most frequent WoS research area terms that are also included in the top 200 title terms. Henceforth, we consider all articles that fall under one of the top 50 OARE research areas. For the five countries under study, 29,117 articles out of a total of 35,056 articles fall under these research areas, i.e., we drop 5,939 articles. We restrict our analysis to articles with single local authors, i.e. articles for which one author comes from one of the countries under study. Even though our datasets allow us to also 8
Appendix 2 provides a histogram of the number of quarters during which an institution is attributed at least one
9 include papers with more than one local author, there are at least three reasons to focus on articles written by a single local author. First, there is no consensus within and across disciplines on how to account for multiple authorships. In particular, taking each author of a paper fully into account would overestimate the output produced. Creating a weight for multiple-authored papers by dividing each publication by the number of authors, however, would also necessarily involve assumptions on the habits of co-authorship. In some disciplines (or publishing cultures), the order of authors has clear implications. Sometimes the first author or the last author is perceived as the “main author” of a research article. Other disciplines choose the order of authors alphabetically or by status. All of this makes it hard to operationalize multiple-authored papers from one country. Second, there is no reason to believe that restricting our analysis to single local authors would create any bias with respect to the OARE treatment. More specifically, it is reasonable to assume that institutions publishing articles with one local author do not benefit from OARE in a systematically different way than institutions publishing articles with multiple local authors. We therefore argue that the impact of having a single author or multiple co-authors from the local country in an article is independent of the impact of OARE. Third, to the best of our knowledge, McCabe and Snyder (2015) is the only reference that explicitly deals with the issue of single versus multiple authors with respect to online access. We follow the argument brought forward therein and restrict our analysis to papers with single authors (from the local country) only. This restriction does not limit the analysis to single-authored articles, as our dataset includes papers co-authored with researchers from the EU or the USA. For the five countries under study, we obtain a sample of 18,955 articles. To construct the panel data, we aggregate article level information by institution and by quarter for each country under study. We collapse the data by institution and quarter. For each country, we then merge rank and city information – including population and distance data –
publication.
10 from separate datasets. Subsequently, we merge all individual country data into one dataset.9 We distinguish country-specific information by generating a unique country ID for all countries. In a final step, we drop institutions that published during only one quarter. In total, we obtain 6,602 institution-quarter pairs, which constitute our unit of observation. In assigning institutions to authors of articles from the countries under study, we use Stata string-matching functions, searching for snippets of institution names and abbreviations. We unambiguously identify 459 research institutions that are part of the Ranking Web of World Universities and/or OARE member institutions, forming the core universities for the stringmatching process.10 For each country under study, we find a large number of institutions that are neither included in the Ranking Web of Universities list nor in the list of OARE institutions. For these institutions, we generate unique institution IDs as follows. First, we order the institutions in a given country alphabetically. Second, we identify all versions of a given institution in the raw data. For instance, a given institution can have multiple versions because of abbreviations, use of different languages, or typos. Thereby, we also use the city where an institution is located to identify different versions of a given institution, assigning identical institution IDs in such cases. Moreover, we assign institution IDs to track the relative position of an institution in the university ranking list. For a given country, a lower institution ID reflects a better rank. The rank variable, in addition, reflects the absolute worldwide position of the institution in the Ranking Web of World Universities. This ranking provides information on the performance of 22,123 research institutions worldwide on the basis of the web presence as well as the impact of institutions. The former aspect is particularly noteworthy, as web presence provides a proxy for the technical expertise needed to set up online access to journals. 9
We took the mean for the continuous variables, the max for the binary variables and the sum for the publication variable in performing the collapse command. 10 In total, 163 institutions in Nigeria, 96 in Peru, 82 in Kenya, 62 in Ecuador and 56 in Bolivia.
11 Finally, we assign city IDs to construct distance and population variables. To give an example, we identify 74 cities in Nigeria with a population of more than 100,000 inhabitants (pop variable) using Wikipedia.org. In addition, we identify 64 cities from our Nigeria sample with fewer than 100,000 inhabitants. We assign city IDs 1 to 138 to the Nigerian cities where the articles under study were written, where a lower number denotes a larger population. As a further control, the variable distance was created by using Google maps and by computing the distance in km from the city in which an institution is located to the largest domestic city, as suggested by the first itinerary option by car.
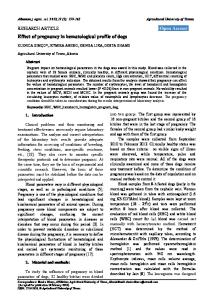
3.2. Adoption patterns of Research4Life initiatives While our analysis focuses on the OARE initiative we also gathered information on the diffusion of two other Research4Life Initiatives,11 i.e. HINARI and AGORA, to obtain instruments for the OARE treatment effect (see Section 4.1, “Methodology”, for an overview of the two sets of instruments that we use in our analysis).12 HINARI was launched in January 2002 (quarter 9), AGORA in October 2003 (quarter 16) and OARE in October 2006 (quarter 28). Figure 1 illustrates the rate of adoption of the three initiatives over time (quarters) in Band 1 countries (a) and Band 2 countries (b). The rate of adoption is measured by the cumulative number of institutions that joined the respective initiative in a given quarter divided by the total number of institutions (HINARI: 783, AGORA: 840, OARE: 798). It is worth noting that, depending on the initiative, only 12% to 14% of all eligible research institutions in Band 1 countries had joined Research4Life in the last quarter under study (June 11
Note that the Research for Innovation Initiative (ARDI) was introduced much later than the other three Research4Life Initiatives (in July 2009). It is excluded from the analysis as the post-introduction period for ARDI is less than three years given our sample period of January 2000 to June 2012. Besides, the institution registration data with dates of entry was not available at the time of study. 12 The results of the tests for underidentification and weak identification as well as the Hansen J statistics reported in Tables 2 and 3 provide evidence for the validity of our instruments.
12 2012).13 There are no registration fees for Band 1 institutions to join any of these initiatives. However, there may be general operating costs, e.g. administrative costs, or investment cycles. Institutions might also lack the technical know-how to set up online access to journals. We address this aspect by taking into account a proxy for the web performance of institutions. Arguably, better-ranked institutions in terms of web performance are ceteris paribus more likely to have the technical expertise (and possibly also the financial means) to set up online access to journals. However, while the factors mentioned above might hinder the OARE adoption process, the relatively low spread of adoption may also be due to informational problems. Without any informational problems, we would expect a substantial share of Band 1 institutions to adopt HINARI shortly after quarter 9, AGORA shortly after quarter 16 and OARE shortly after quarter 28. In addition, Figure 1 (b) provides evidence of an information-related problem for AGORA in Band 2 countries. More specifically, it took 12 quarters for the first institution to join AGORA. Notably, the adoption of AGORA in Band 2 countries starts with the launch of the OARE initiative. –Figure 1 here– Figure 2 displays adoption patterns of institutions in Band 1 and Band 2 countries that joined at least one initiative. The horizontal axis depicts a subset of all adoption patterns. The vertical axis shows the frequency of a given adoption pattern. We analyze subsequent and simultaneous adoption patterns in Figure 2. Subsequent adoption (patterns (1) to (6)) refers to a situation in which an institution joined the initiatives during different quarters. For instance, HAO (pattern (1)) refers to the successive adoption of HINARI, AGORA and OARE. Simultaneous adoption (patterns (7) to (10)) refers to a situation in which an institution joined two or three initiatives during the same quarter. For instance, institutions listed as H+A+O 13
Note that the total number of eligible institutions refers to institutions that have observable research output in the period under study. We exclude non-research institutions from our analysis, i.e., we drop institutions that
13 adopted all three initiatives during the same quarter. We find that around 14% of all institutions in Band 1 countries that joined at least one initiative adopted HINARI first, AGORA second and OARE last (adoption pattern (1)). Figure 2 provides further evidence of the existence of information-related problems. We argue that if there were no information problems, we would expect to see that a substantial share of institutions in Band 1 countries exhibited the HAO diffusion pattern (1). In any case, we would not expect to see that the majority of institutions in Band 1 countries did not join HINARI first (in total, 58% of all cases). –Figure 2 here– Overall, the structure of diffusion of the different initiatives and the adoption patterns we highlight suggest that information problems are present.
4.
Methodology and variables
4.1. Methodology We use a difference-in-difference approach and three different estimation methods in our analysis. First, we estimate the treatment effect using OLS regression analysis. Second, we apply an instrumental variable approach to account for potential endogeneity issues related to the information diffusion process. Third, we model the treatment effect as an endogenous binary variable in a Bayesian Markov-Chain-Monte-Carlo (MCMC) simulation framework to account for potential self-selection into the OARE initiative.
4.1.1. Difference-in-difference using OLS regression In order to analyze the treatment effect of the OARE initiative, we use a difference-indifference method for comparing the change in research output for institutions in the treatment group (i.e. registered institutions) with the change in research output for institutions
publish during less than two quarters.
14 in the control group (i.e. unregistered institutions).14 The dependent variable, ys,, is the log of the number of published articles by (single) researchers from institution s in quarter (but with potential co-authors outside country k). We use the specification outlined in equation (1): (1)
ys, = 0 + i 1i insti t 2t qt 3 treateds, 4 xs, s, with i = 1, ..., I, t = 1, ...T
where insti are institution fixed effects (city population, distance to the largest domestic city and worldwide rank), I is the total number of fixed effects, T = 50, qt are quarterly dummies, treateds, 1 if institution s joined OARE in quarter (and 0 otherwise); s, are unobservable effects assumed independent across s and . Note that we have an unbalanced panel in the sense that many institutions do not publish in all quarters.15 xs, are control variables. Variable treateds,OAREs ∙ after s,accounts for the fact that institutions registered with the OARE initiatives at different points in time. In other words, treated is 1 if an institution is an OARE institution and if the article is published in a quarter after the institution registered with OARE. To analyze the effect of rank and distance on the treatment effect, we add an interaction term treateds,t,j = treateds,t ∙ instj. The specification yields equation (2): (2)
ys, = 0 + i 1i insti t 2t qt 3 treateds, 4treateds,t,j 5 xs, s, with i = 1, ..., I, t = 1, ...T.
4.1.2. Difference-in-difference using instrumental variables A potential endogeneity problem arises if the unobservable variable is correlated with the treated effect. There are two problems that we may worry about: (1) unobserved endogenous benefits (not controlled for by other independent variables, e.g., rank) which could result in 14
The results reported in Appendix 3 show that both treatment and control group follow similar trends before the treatment is introduced. 15 Serial correlation is not an issue in the main equation for the following reason. We have an incomplete panel with missing observations. Most institutions do not publish during two consecutive quarters and this breaks serial correlation. Also note that taking the log of the number of publications is not a problem, since we use an
15 self-selection into OARE; (2) unobserved endogenous information problems resulting from the fact that only well-informed institutions can join the OARE initiative. To account for an unobserved endogenous benefit, which could result in self-selection into the OARE initiative, we use treated_HINARI and treated_AGORA as a first set of instruments. These variables are equal to 1 for all quarters after the institution joined HINARI (respectively AGORA) and 0 otherwise. They are the equivalent of treated for the HINARI and AGORA initiatives. To control for the endogenous information problem, we use information on the prevalence of OARE registration by local institutions as the basis for a second set of instrumental variables: the average number and the total number of institutions that joined OARE in a given city. Clearly, our goal is to find instruments that are associated with changes in status of online access to OARE journals but do not lead to changes in scientific output of a given institution. Arguably, a given institution is ceteris paribus more likely to join OARE if more institutions in the same city have already joined OARE.16 The underlying idea is that institutions located in cities where other institutions have already joined OARE are more likely to have information about the existence of OARE due to knowledge spillovers. In addition, we do not have any reason to believe that OARE registration of other institutions should have any impact on the scientific output of the institution under study.17 Hence, we argue that our instruments based on the OARE registration of other institutions in a given city do not have a direct effect on scientific output of the institution under study. However, both sets of instrumental variables account for the institutions’ different levels of awareness about the existence of Research4Life before they join the OARE program.
unbalanced panel where we do not observe any zeros. In section 5.3, we look at the balanced panel by adding zeros for non-observations, making use of the log of the number of publications plus one as dependent variable. 16 The results of the first-stage equation for our IV approach reported in Appendix 1 suggest that our instruments are correlated with OARE registration. 17 A similar argument can be made for our first set of instruments. Institutions that are aware of HINARI or AGORA are ceteris paribus more likely to join OARE. In addition, note that we restrict our analysis to articles published in the top 50 OARE research areas (see Section 3.1). It is in this respect that online access to medical
16 4.1.3. Difference-in-difference using Bayesian estimation We estimate the treatment effect using Bayesian estimation techniques based on a data augmentation MCMC algorithm described in Appendix 4. There are two equations. The first equation determines the outcome of the binary treatment effect within a latent variable framework. The second equation is identical to equation (1). We assume that the unobserved variables of both equations follow a bivariate normal distribution with correlation coefficient
. The MCMC algorithm simulates the latent variable of the first equation to generate the endogenous binary treatment effect. The Bayesian approach explicitly deals with the correlation between the unobserved variables of the two equations. If there are any unobserved variables that determine whether an institution self-selects into the OARE program, the Bayesian method accounts for its potential endogeneity on the estimation of the treatment effect.
4.2. Definition of variables Table 1 provides an overview of the variables under study and summary statistics at the institution-quarter level.18 The variables can be grouped in six categories: dependent variable, countries, main variable of interest, article characteristics, institutional characteristics and city characteristics. –Table 1 here– 4.2.1. Dependent variable The number of publications of institution s in quarter τ, ys,, is our dependent variable. In the regression, we take the log. The histogram of the number of publications at the article level is shown in Appendix 6. On average, the research institutions under study published at least one article in 8.3 quarters.
journals (HINARI) or agricultural science journals (AGORA) is not likely to have a substantial impact on research output of a given institution in environmental science.
17 4.2.2. Independent variables Countries: We study 798 institutions from five countries of which two are located in SubSaharan Africa (Kenya and Nigeria) and three in South America (Bolivia, Ecuador, Peru). At the institution-quarter level, 61.1% of our observations are from Sub-Saharan Africa. Main variable of interest: treated is our main variable of interest. We construct this treatment variable by interacting two dummy variables. First, OARE indicates whether papers are written by authors affiliated with OARE institutions. We generate the OARE dummy by using the institution IDs of all institutions that are part of WHO’s list of OARE institutions. OARE (not reported in the table) takes on the value 1 if the respective institution of an article under study is an OARE institution and the value 0 otherwise. Second, the after dummy (not reported in Table 1) accounts for the registration date (in quarters) of a certain OARE institution. Its value is 1 if the article under study was written by an author affiliated with an OARE institution after the institution joined the OARE program.19 Article characteristics: Mean_USA (mean_EU) indicates the average number of co-authors from the US (EU). Finally, mean_oare_references indicates the average number of references from OARE journals. That is, we consider references from OARE journals as an input variable. Mean_pages indicates the average number of pages. The average number of references is indicated by mean_references. Institutional characteristics: Five rank variables indicate the ranking position of an institution in the Ranking Web of Universities (2014). Rank1 indicates the ranking position of the best institutions (≤5,000) whereas Rank4 indicates the ranking position of the worst institutions (15,000
Appendix 5 provides summary statistics by country band.
18 City characteristics: Distance measures the distance in 100 km of a given city to the largest domestic city.20 City population dummies indicate the number of inhabitants of the city where an institution is located: Pop0 indicates cities with less than 100,000 inhabitants whereas pop4 indicates cities with more than 5,000,000 inhabitants.
5. Empirical analysis 5.1. Treatment effect We estimate the treatment effect by using eight different specifications in Table 2.21 Specifications (1) to (5) use a simple OLS regression, whereas we apply instrumental variables in (6) and (7) and the Bayesian MCMC method in column (8).22 Column (1) reports the OLS regression coefficients for the basic model, including the treatment variable as well as country and quarter dummy variables. We add article characteristics in (2), institutional rank information in (3), city population in (4) and distance to the largest domestic city in (5). Column (5) is our preferred specification and serves as the basis for the instrumental variables used in (6) and (7).23 We use the two different sets of instruments described in Section 4.1.2. to deal with the potential endogeneity of the treatment variable. First, we use treated_AGORA and treated_HINARI as instrumental variables in (6). Second, in addition to treated_AGORA and treated_HINARI, we use the average number and the total number of institutions that joined OARE in a given city in (7).24 The last column of Table 2 reports the coefficients 19
For non-OARE members after is set to 1 for all quarters after quarter 28 (launch of OARE). We do not have distance information for 510 institution-quarter pairs, as the respective cities do not appear in Google maps. For these cities, we proxy the distance to the largest domestic city by taking the average distance in the respective country. 21 We do not have institution fixed effects but we do have fixed effects that relate to rank, population and distance, as these variables are time-invariant. 22 The Stata module ivreg2 we used to produce the columns with the IV results produced slightly different results on different computers. However, the difference is only noticeable at the second decimal place and does not affect the tests we performed in the paper. This is not an issue for the OLS and MCMC columns. 23 Residuals of specification (5) are represented in Appendix 7. 24 In Appendix 1 we report estimated coefficients of the first-stage equation. 20
19 estimated using the Bayesian MCMC algorithm.25 We use the same set of variables as in column (7), including the four instruments, to explain the binary treatment effect.26 –Table 2 here– In general, we find a positive and robust OARE treatment effect that is statistically significant at the 1% level across specifications.27 Looking at our preferred specification (5), joining OARE increases publication output by +43% and by +87% using the MCMC method.28 Notably, the MCMC coefficient for treated (0.631) is similar in magnitude to what we find in the base OLS specification (0.747). The IV method seems to be an upper bound on the treatment effect. We also ran the regressions separately for Band 1 and Band 2 countries (Appendix 8) and for institutions with publications in fewer than and more than 25 quarters (Appendix 9). The OARE treatment effect is positive and statistically significant for these subgroups, while it is higher for institutions in Band 2 countries and for institutions publishing in more than 25 quarters. Moving from column (1) to column (2), we consider the effects of article characteristics on publication output. We obtain two main results. First, cooperation with researchers from the US or EU have a positive and statistically significant effect on the publication output of institutions in developing countries. Interestingly, this effect appears to be much smaller than the treatment effect. Second, the average number of citations from OARE journals has a positive and statistically significant impact on publication output for specifications (4) to (8). This suggests that the Research4life initiative has an impact on both the input and the output of the scientific production function. 25
The MCMC algorithm was “warmed up” with 1,000 iterations and the next 10,000 iterations were used to compute the coefficients reported in Table 2. 26 For each institution, there are as many observations in the self-selection equation as there are quarters in which the institution published at least one article. This gives more weight to institutions that publish frequently. Keeping observations formatted in this way is necessary in order to estimate the correlation coefficient. Note also that we did not include quarter dummies in the first equation so as to avoid multi-collinearity issues since parameters of this equation are estimated by using cross-section variation across observations. 27 All country dummy variables are negative, as the reference country Nigeria has the largest publication output. 28 We obtain this result by calculating the exponential of the treated coefficient minus 1.
20 R-squared marginally increases from 0.141 to 0.163 and the treatment effect remains almost the same when we include article characteristics in (2). In contrast, R-squared increases by a factor of two (from 0.163 to 0.314) and the treatment effect decreases from 0.735 to 0.366 when we add institutional rank information in (3). To explain this decrease, it is important to note that the Ranking Web of Universities that we use to create the rank variable is mainly based on the assessment of the web presence of institutions, e.g., it uses link analysis for quality evaluation. It is in this respect that an institution’s web performance provides a proxy for its technical expertise to set up online access to journals. We also find that lower-ranked institutions are less productive in terms of publication output, since the coefficients associated with lower ranks (5000
29
The additional test statistics provided for the IV regression results (specification (6) and (7)) reveal measures of the validity of our instruments. First, both the underidentification test and the weak identification test suggest that the instruments are not weak and that the excluded instruments are relevant. In particular, we can reject the null hypothesis at the 0.1% level (p-value = 0.000), meaning that the model is identified. Second, Hansen’s J statistic can only be rejected at the 10% level, giving us the confidence that our set of instruments is appropriate.
21 5.2. Interaction effects We examine whether the OARE treatment effect is homogeneous across different types of institutions by looking at six different specifications in Table 3. In specifications (1), (2) and (3), we study the interaction between treated and the continuous rank variable.30 In specifications (4), (5) and (6), we examine the interaction between treated and the continuous distance variable. Specifications (1) and (4) use a simple OLS regression whereas in specifications (2) and (5) we use IV regressions applying all four instruments discussed in section 4.1.2 and used in specification (7) of Table 2. Coefficients estimated by the Bayesian method are given in columns (3) and (6). –Table 3 here– We find evidence of significant interaction effects. In particular, our results suggest that lower-ranked institutions (negative coefficient associated with the treated_rank variable) and institutions farther away from the largest domestic city (negative coefficient of treated_distance) benefit less from OARE. The results are all significant at least at the 5% level across specifications (2) to (6). The respective OLS coefficient for the treated_rank interaction in specification (1) is also negative and similar in magnitude to the coefficients for treated_rank in specifications (2) and (3).31
30
Instead of establishing interaction for treated separately with the five rank category dummy variables we have it interact with the continuous rank variable. In the case of missing rank information, we proxy rank by taking the average rank per country. 31 Again, the additional test statistics provided for the IV regressions reveal that the set of instruments applied is relatively strong and valid. Most importantly, both the LM statistic (overidentification test) and the Wald F statistic (weak identification test) suggest that our instruments are strong and relevant. For Hansen’s J statistic our observations are two-fold. Whereas Hansen’s J statistic for specification (5) reveals doubt about the appropriateness of the instruments, given a p-value of 0.031, the statistic is far from the rejection of its null for specification (2), with a p-value of 0.3169, giving us the confidence that our set of instruments is appropriate.
22 5.3. Robustness For each institution, we aggregated publications by quarter from January 2000 to June 2012.32 Since some institutions do not publish every quarter, our original dataset is an unbalanced panel with quarterly data. However, the fact that an institution did not publish during a quarter also reveals information. Another way to analyze this dataset is to aggregate publications by year and add zero publications in years where we do not observe any publication for an institution. In that case, we end up with a balanced panel with yearly data. We use a balanced panel based on yearly instead of quarterly data to check the robustness of our results. We prefer to create a yearly balanced panel instead of a quarterly balanced panel, since using quarterly data would drastically increase the number of zeros and missing values for timevariant variables at the article level. Using a quarterly unbalanced panel has the following advantages and disadvantages compared to a yearly balanced panel. First, using quarterly instead of yearly data provides us with more precise information about the registration date, as we can, for instance, distinguish whether an institution registered with OARE in the first or last quarter of a given year. Second, in the unbalanced panel we give more weight to more productive institutions, whereas the balanced panel allows us to give equal weight to all institutions at the cost of inflating the number of institution-year pairs with zero publications. Third, the unbalanced panel data offers additional control variables at the article level, whereas in the balanced panel dataset we would have to substitute missing values with, for instance, the mean of the variables under study for many observations. Lastly, variables such as rank, population and distance, which do not change over time, offer prospects to capture fixed effects in the unbalanced panel, while they will already be taken into account by the fixed effects in the balanced panel. 32
Note that our dataset is retrieved from WoS and is hence restricted to articles published in the closed catalog of WoS-listed journals. That is, there may be publications from institutions we do not observe as they are outside the world of WoS. Nevertheless, as WoS restricts access to their journal list to journals with impact (measured by means of different quality indicators) we lose publications that are necessarily of lesser quality.
23 Table 4 reports the results of the OLS (Column (1)), IV (Column (2)) and Bayesian (Column (3)) regressions using a balanced panel with yearly data.33 –Table 4 here– We estimate equation (1) using fixed effects regressions. Therefore, we cannot include city population, rank, distance and country IDs as explanatory variables, as these are timeinvariant. However, institution-level characteristics that do not change over time are controlled by institution binary variables. This contrasts with our approach of using an unbalanced panel with quarterly data, where we include time-invariant variables such as city population, rank, distance to the largest domestic city and country IDs. These variables are important to include in the analysis, as we have shown in Sections 5.1 and 5.2. The results reported in Table 4 confirm the positive treatment effect that we obtain from our previous analysis using quarterly data (unbalanced panel). More specifically, the OLS coefficient for treated (0.430) is similar in magnitude to what we find in our preferred specification (5) in Table 2 (0.362).
6. Conclusion We have analyzed the effect of free and reduced-fee online access to the environmental science literature via OARE on scientific productivity in Bolivia, Ecuador, Kenya, Nigeria and Peru. We find that OARE membership increases publication output by at least 43% and that the number of references to articles published in OARE journals also has a positive impact on publication output. A robustness check analyzing a balanced panel with yearly data yields qualitatively the same results. Thus our analysis provides empirical support for the hypothesis that free online access to journals promotes research in developing countries. 33
We included fixed effects in the OLS and IV regression results. Including fixed effects with the Bayesian method was too computer-intensive and thus fixed effects were not included in this approach.
24 Nevertheless, we find that there is still room for improvement on two grounds. First, we found that lower-ranked institutions located in remote areas benefit less from OARE. Second, we highlighted diffusion patterns of the different Research4life initiatives that suggest that many institutions are not aware of the programs or lack operational information to implement free online access. The fact that only about 13% of all eligible institutions joined Research4Life after a period of up to 10 years reveals the unused potential of these initiatives. Policies aimed at increasing awareness of free online access initiatives in low-ranked institutions in remote areas should therefore be encouraged.
Acknowledgements We are grateful to Kimberly Parker and the World Health Organization for providing us with data on registration dates of the institutions that joined the OARE, HINARI and AGORA initiatives. We thank Dietmar Harhoff, Stan Liebowitz, Fabio Montobbio, Laura Rosendahl Huber, Michael Weber and the participants of the 2016 MPI-IC research seminar, the 2016 Workshop on “The Organization, Economics and Policy of Scientific Research”, the 2015 MPI-IC guest lecture series and the 2015 SERCI Conference for comments. Research assistance was provided by Sebastian Osterrieth, Laura Sundsgaard and Christoph Winter.
25
References Annan, K., 2004. Science for All Nations. Science, 303, 925. Bergstrom, T., Bergstrom, C. T., 2004. The Costs and Benefits of Library Site Licenses to Academic Journals. Proceedings of the National Academy of Sciences, 101(3), 897-902. Cohen, W. M., Levinthal, D. A., 1989. Innovation and Learning: The Two Faces of R&D. Economic Journal, 99, 569-596. Cohen, W. M., Levinthal, D. A., 1990. Absorptive Capacity: A New Perspective on Learning and Innovation. Administrative Science Quarterly, 35(1), 128-152. Dasgupta, P., David, P. A., 1994. Toward a New Economics of Science. Research Policy, 23(5), 487-521. Dosi, G., 1988. Sources, Procedures, and Microeconomic Effects of Innovation. Journal of Economic Literature, 26(3), 1120-1171. Eger, T., Scheufen, M., Meierrieks, D., 2015. The Determinants of Open Access Publishing: Survey Evidence from Germany. European Journal of Law and Economics, 39(3), 475503. European Commission, 2012. Towards Better Access to Scientific Information: Boosting the Benefits of Public Investments in Research. Brussels: European Commission. Evans, J. A, Reimer, J., 2009a, Open Access and Global Participation in Science. Science, 323, 1025. Evans, J. A., Reimer, J., 2009b, Open Access and Global Participation in Science, supporting online material. Science, 323. Furman, J. L., Stern, S., 2011. Climbing Atop the Shoulders of Giants: The Impact of Institutions on Cumulative Research. American Economic Review, 101(5), 1933-1963. Geroski, P. A., 2000. Models of Technology Diffusion. Research Policy, 29(4-5), 603-625. Griliches, Z., 1957. ‘Hybrid Corn’: An Exploration in the Economics of Technological Change. Econometrica, 25(4), 501-522. Hall, B., 2004. Innovation and Diffusion, NBER, Cambridge, MA NBER Working Paper No.10212. Hall, B., Khan, B., 2003. Adoption of New Technology, NBER, Cambridge, MA NBER Working Paper No. 9730.
26 Hanauske, M., Bernius, S., Dugall, B., 2007. QuantumGame Theory and Open Access Publishing, Physica A., 382, 650-664. Jeon, D. S., Rochet, J. C., 2010. The Pricing of Academic Journal: A Two-Sided Market Perspective. American Economic Journal: Microeconomics, 2, 222-255. Lane, P. J., Koka, B., Pathak, S., 2002. A Thematic Analysis and Critical Assessment of Absorptive Capacity Research. Academy of Management Proceedings, M1. Mahnke, V., Pedersen, T., Venzim, M., 2005. The Impact of Knowledge Management on MNC Subsidiary Performance: The Role of Absorptive Capacity. Management International Review, 45(2), 101-119. Mansfield, E., 1961. Technical Change and the Rate of Imitation. Econometrica, 29(4), 741766. Mansfield, E., 1963. Intrafirm Rates of Diffusion of an Innovation. Review of Economics and Statistics, 45(4), 348-359. Merton, R. K., 1973. The Sociology of Science: Theoretical and Empirical Investigations, Storer, N.W. (editor), University of Chicago Press: Chicago, IL. McCabe, M. J., Snyder, C. M., 2005. Open Access and Academic Journal Quality. American Economic Review Papers and Proceedings, 95(2), 453-458. McCabe, M. J., Snyder, C. M, 2014. Identifying the Effect of Open Access on Citations Using a Panel of Science Journals. Economic Inquiry, 52(4), 1284-1300. McCabe, M. J., Snyder, C. M., 2015. Does Online Availability Increase Citations? Theory and Evidence from a Panel of Economics and Business Journals. Review of Economics and Statistics, 97(1), 144-165. Mueller-Langer, F., Scheufen, M., 2013. Academic Publishing and Open Access. In Towse, R. and Handke, C. (editors), Handbook of the Digital Creative Economy, pp. 365-377, Edward Elgar. Murray, F. E., Aghion, P., Dewatripont, M., Kolev, J., Stern, S., 2009. Of Mice and Academics: Examining the Effect of Openness on Innovation. NBER Working Paper No. 14819. Ramello, G. B., 2010. Copyright & Endogenous Market Structure: A Glimpse from the Journal-Publishing Market. Review of Economic Research on Copyright Issues, 7(1), 729.
27 Ross, S. V., 2008. The Scholarly Use of Journals Offered through the Health Internetwork Access to Research Initiative (HINARI) and Access to Global Online Research in Agriculture (AGORA) Programs as Suggested by the Journal-Citing Patterns of Scholars in the Least-Developed Nations, Ph.D. thesis, Florida State University. Scheufen, M., 2015. Copyright versus Open Access: On the Organisation and International Political Economy of Access to Scientific Knowledge, Springer International Publishing. Shavell, S., 2010. Should Copyright for Academic Works be Abolished? Journal of Legal Analysis, 2(1), 301-358. Sorenson, O., Fleming, L., 2004. Science and the Diffusion of Knowledge. Research Policy, 33(10), 1615-1634. Stephan, P.E., 1996. The Economics of Science. Journal of Economic Literature, 34(3), 11991235. Stoneman, P., Battisti, G., 2010. The Diffusion of New Technology, Handbook of the Economics of Innovation, Volume 2, 733-760. Suber, P., Arunachalam, S., 2005. Open Access to Science in the Developing World, http://dash.harvard.edu/bitstream/handle/1/4725025/suber_worldinfocity.htm?sequence =1 Suber, P., 2012. Open Access. Cambridge: MIT Press, http://bit.ly/oa-book. Veugelers, R., 1997. Internal R&D Expenditures and External Technology Sourcing. Research Policy, 26(3), 303-315.
28 FIGURE 1 | ADOPTION PATTERNS OF RESEARCH4LIFE INITIATIVES
.15
(a) Band 1 Countries Agriculture
0
.05
.1
Health Environment
10
20
30
40
50
40
50
Quarter
.15
(b) Band 2 Countries Agriculture
0
.05
.1
Health Environment
10
20
30
Quarter
Adoption patterns of HINARI (Health, launch: quarter 9), AGORA (Agriculture, quarter 16) and OARE (Environment, quarter 28) by band in (a) and (b). Band 1 countries: Kenya and Nigeria. Band 2 countries: Bolivia, Ecuador and Peru.
29
.25
FIGURE 2 | ADOPTION PATTERNS BY BAND
Band 2 countries
0
.05
.1
.15
.2
Band 1 countries
(1) HAO
(2) HOA
(3) AHO
(4) AOH
(5) OAH
(6) (7) (8) OHA H+A+O H+O
(9) A+O
(10) A+H
(11) Other
Subsequent and simultaneous adoption patterns of Research4Life. The horizontal axis depicts a subset of all adoption patterns. The vertical axis shows the frequency of a given adoption pattern. We consider both subsequent adoption (patterns (1) to (6)) and simultaneous adoption (patterns (7) to (10)). HAO refers to the successive adoption of HINARI, AGORA and OARE. H+A+O refers to the case where institutions adopted all three initiatives in the same quarter.
30 TABLE 1 | SUMMARY STATISTICS VARIABLES
mean
sd
min
max
N
Dependent variable # publications
2.690
3.695
1
55
6,602
Countries Kenya Nigeria Bolivia Ecuador Peru
0.280 0.331 0.093 0.089 0.206
0.449 0.471 0.290 0.286 0.404
0 0 0 0 0
1 1 1 1 1
6,602 6,602 6,602 6,602 6,602
Main variables of interest treated (OARE) treated_AGORA treated_HINARI
0.133 0.175 0.203
0.340 0.380 0.402
0 0 0
1 1 1
6,602 6,602 6,602
Article characteristics # co-authors USA # co-authors EUR # OARE references # pages # references
0.833 0.945 7.802 9.184 31.782
2.770 2.462 9.064 4.956 18.277
0 0 0 1 0
37.25 54.33 135 73 247
6,602 6,602 6,602 6,602 6,602
Institutional characteristics Rank1: rank≤5,000 Rank2: 5,000
0.185 0.061 0.073 0.029 0.653
0.388 0.239 0.259 0.168 0.476
0 0 0 0 0
1 1 1 1 1
6,602 6,602 6,602 6,602 6,602
City characteristics Distance in 100 km Pop0: pop≤100, in 1,000 Pop1: 100
5,000, in 1,000
3.021 0.241 0.141 0.118 0.357 0.143
3.330 0.428 0.348 0.323 0.479 0.351
0 0 0 0 0 0
19.13 1 1 1 1 1
6,602 6,602 6,602 6,602 6,602 6,602
Data is aggregated at the institution-quarter level. The institution-quarter pairs constitute the unit of observation.
31 TABLE 2 | OARE TREATMENT EFFECT OLS
IV
Bayesian
(1) Base
(2) + Article info
(3) +Rank
(4) +Population
(5) +Distance
(6) IV 1
(7) IV 2
(8) MCMC
0.747*** (0.112)
0.735*** (0.109) 0.025*** (0.009) 0.026** (0.012) 0.003 (0.002)
0.366*** (0.050) 0.019*** (0.006) 0.019* (0.011) 0.003 (0.002) -0.786*** (0.131) -1.016*** (0.143) -1.205*** (0.153) -0.834*** (0.109)
0.361*** (0.049) 0.018*** (0.006) 0.020* (0.011) 0.004* (0.002) -0.722*** (0.132) -0.998*** (0.145) -1.194*** (0.153) -0.839*** (0.117)
0.550*** (0.110)
0.550*** (0.106)
1.417*** (0.140)
1.410*** (0.149)
0.362*** (0.049) 0.019*** (0.006) 0.021* (0.011) 0.004* (0.002) -0.704*** (0.130) -0.992*** (0.143) -1.179*** (0.152) -0.834*** (0.116) -0.009 (0.011) 1.439*** (0.158)
1.156*** (0.236) 0.021*** (0.007) 0.016 (0.011) 0.005** (0.002) -0.699*** (0.129) -0.936*** (0.147) -1.166*** (0.156) -0.516*** (0.149) -0.010 (0.011) 1.006*** (0.196)
1.085*** (0.222) 0.021*** (0.007) 0.017 (0.011) 0.005** (0.002) -0.699*** (0.129) -0.941*** (0.147) -1.167*** (0.155) -0.544*** (0.147) -0.010 (0.011) 1.045*** (0.193)
0.631*** (0.047) 0.020*** (0.004) 0.018*** (0.005) 0.004*** (0.001) -0.704*** (0.041) -0.979*** (0.039) -1.189*** (0.054) -0.727*** (0.029) -0.009*** (0.004) 1.307*** (0.067)
Quarter dummies Country dummies City population dummies
YES YES NO
YES YES NO
YES YES NO
YES YES YES
YES YES YES
YES YES YES
YES YES YES
YES YES YES
Observations R-squared
6,602 0.141
6,602 0.163
6,602 0.314
6,602 0.320
6,602 0.321
6,602 0.255
6,602 0.266
6,602
VARIABLES
treated # co-authors USA # co-authors EUR # OARE references 5,000
Correlation between -0.332*** unobserved variables (ρ) (0.040) Underidentification test 169.865 180.969 (LM statistic) Chi-sq(.) 2 4 p-value 0.000 0.000 Weak identification test 127.972 89.613 (Wald F statistic) Hansen J statistic 2.992 6.970 Chi-sq(.) 1 3 p-value 0.084 0.073 Results on the impact of OARE membership (treated) on publication output of research institutions in five developing countries (Bolivia, Ecuador, Kenya, Nigeria, Peru) from OLS, instrumental variables and Bayesian MCMC estimation methods. The institution-quarter pairs constitute the unit of observation. The dependent variable is the log of the number of publications of an institution in a given quarter. Period under study: 1st quarter 2000 to 2nd quarter 2012. We obtain the findings on the OARE treatment effect mentioned in the text by calculating the exponential of the treated coefficient minus 1. Reference country is Nigeria. Reference quarter is 36. Reference rank is rank≤5,000. Robust standard errors clustered at the institutional level (OLS and IV) and standard errors of the marginal posterior distributions (Bayesian) reported in parentheses. Not reported: # pages, # references. *p < 0.1, **p < 0.05, ***p < 0.01.
32 TABLE 3 | INTERACTION EFFECTS OF OARE TREATMENT Interaction with Rank VARIABLES treated # co-authors USA # co-authors EUR # OARE references Rank, in 1,000 Distance, in 100 km treated interacted with rank, in 1,000 treated interacted with distance, in 100 km Constant
(1) OLS
(2) IV
0.787*** 2.405*** (0.105) (0.356) 0.0245*** 0.028*** (0.009) (0.008) 0.021** 0.006 (0.010) (0.010) 0.004* 0.004* (0.002) (0.002) -0.108*** -0.035* (0.019) (0.019) -0.005 -0.005 (0.011) (0.011) -0.017 -0.173*** (0.014) (0.039)
(3) Bayesian 1.067*** (0.050) 0.025*** (0.004) 0.017*** (0.005) 0.003*** (0.001) -0.108*** (0.004) -0.006* (0.004) -0.013*** (0.005)
Interaction with Distance (4) OLS
(5) IV
(6) Bayesian
0.847*** 1.935*** 1.143*** (0.127) (0.267) (0.052) 0.025*** 0.028*** 0.026*** (0.008) (0.007) (0.004) 0.021** 0.015* 0.018*** (0.010) (0.008) (0.005) 0.004* 0.005** 0.003*** (0.002) (0.002) (0.001) -0.114*** -0.102*** -0.112*** (0.017) (0.014) (0.003) 0.002 0.024* 0.001 (0.011) (0.013) (0.004)
-0.046** -0.192*** -0.044*** (0.019) (0.038) (0.007) 1.629*** 1.244*** 1.526*** (0.206) (0.197) (0.069)
1.613*** (0.217)
0.774*** (0.246)
1.518*** (0.073)
Quarter dummies Country dummies City population dummies
YES YES YES
YES YES YES
YES YES YES
YES YES YES
YES YES YES
YES YES YES
Observations R-squared
6,602 0.305
6,602 0.174
6,602
6,602 0.308
6,602 0.224
6,602
Correlation between unobserved variables (ρ) Underidentification test (LM statistic) Chi-sq(.) p-value
-0.476*** (0.036)
-0.469*** (0.053)
168.817
158.650
4 0.000
4 0.000
Weak identification test 66.564 72.828 (Wald F statistic) Hansen J statistic 3.530 8.876 Chi-sq(.) 3 3 p-value 0.317 0.031 Results on the impact of OARE membership (treated) on publication output of research institutions, including the results of its interactions with the continuous rank and distance variables, in five developing countries (Bolivia, Ecuador, Kenya, Nigeria, Peru) from OLS, instrumental variables and Bayesian MCMC estimation methods. The institution-quarter pairs constitute the unit of observation. The dependent variable is the log of the number of publications of an institution in a given quarter. Period under study: 1st quarter 2000 to 2nd quarter 2012. Reference country is Nigeria. Reference quarter is 36. Robust standard errors clustered at the institutional level (OLS and IV) and standard errors of the marginal posterior distributions (Bayesian) reported in parentheses. Not reported: # pages, # references. *p < 0.1, **p < 0.05, ***p < 0.01.
33 TABLE 4 | OARE TREATMENT EFFECT: BALANCED PANEL WITH YEARLY DATA
VARIABLES treated Constant Article characteristics Year dummies Institution FE Observations R-squared
(1) OLS
(2) IV
(3) Bayesian
0.430*** (0.069) 0.355*** (0.031) YES
1.018*** (0.063) 0.365*** (0.034) YES
1.450*** (0.047) 0.435*** (0.041) YES
YES YES 5,597 0.132
YES YES 5,597
YES NO 5,597 -0.754*** (0.024)
Results on the impact of OARE treatment (treated) on the output of research institutions in five developing countries (Bolivia, Ecuador, Kenya, Nigeria, Peru). OLS, IV and Bayesian estimations using a balanced panel with yearly data. Robust standard errors clustered at the institutional level (OLS and IV) and standard errors of the marginal posterior distributions (Bayesian) reported in parentheses. *** p<0.01, ** p<0.05, * p<0.1.
34
APPENDIX 1 | FIRST-STAGE EQUATION FOR IV AND BAYESIAN ESTIMATIONS
VARIABLES
IV
Bayesian
(7) in Table 2 IV 2
(8) in Table 2 MCMC
-0.004* (0.002) 0.004 (0.003) -0.001 (0.001) 0.025 (0.056) -0.021 (0.047) 0.036 (0.084) -0.122*** (0.031) -0.002 (0.003) 0.298*** (0.050) 0.192*** (0.044) 0.111*** (0.027) -0.014* (0.007) 0.156*** (0.044) YES YES YES
-0.055** (0.017) 0.067*** (0.020) 0.014*** (0.004) 0.170* (0.010) 0.112 (0.010) 0.442*** (0.128) -1.852*** (0.203) -0.021* (0.012) 1.373*** (0.071) 0.749*** (0.072) 0.374*** (0.010) 0.022 (0.058) -2.000*** (0.125) NO YES YES
First-stage equation; dependent variable is treated # co-authors USA # co-authors EUR # OARE references 5,000
Results of the first-stage equation for IV and Bayesian estimations (Table 2). The institution-quarter pairs constitute the unit of observation. The dependent variable is OARE membership (treated). Period under study: 1st quarter 2000 to 2nd quarter 2012. Reference country is Nigeria. Reference quarter is 36. Not reported: # pages, # references. *** p<0.01, ** p<0.05, * p<0.1.
35
0
.05
Density
.1
.15
APPENDIX 2 | HISTOGRAM OF THE NUMBER OF QUARTERS IN WHICH INSTITUTIONS PUBLISHED AT LEAST ONE ARTICLE
0
10
20 30 Number of quarters
40
50
Histogram of the number of quarters during which an institution is attributed at least one publication. The modes of the distributions are 2 and 50 quarters: there are approximately as many institutions that only published during 2 quarters as those that published during all quarters.
36 APPENDIX 3 | PRE- AND POST-TRENDS FOR OARE AND NON-OARE INSTITUTIONS
VARIABLES
Quarter OARE membership OARE∙Quarter Constant
Observations R-squared
(1) Pre trends q ≤ 28
(2) Post trends q>28
0.0151 (0.0154) 0.993 (0.690) -0.0424 (0.0463) 0.181 (0.230)
0.0233 (0.0289) 2.510 (3.599) -0.0745 (0.0895) -0.190 (1.166)
28 0.107
22 0.096
Regression results of the estimation of the equation with the log of the number of publications as the dependent variable and a constant, a time trend, an OARE membership dummy and the interaction between the time trend and OARE membership as independent variables. The interaction term should pick up any difference in trends between OARE and non-OARE institutions before and after quarter 28. There are no statistical differences between the trends of OARE and non-OARE institutions during the two sub-periods. This suggests that both treatment and control group follow similar trends before the treatment is introduced. Standard errors in parentheses. *** p<0.01, ** p<0.05, * p<0.1.
37 APPENDIX 4 | BAYESIAN METHODOLOGY Equation (A1) determines the outcome of the endogenous binary variable: 𝑦1,𝑖 = {
1, if 𝑤1,𝑖 > 0 0, if 𝑤1,𝑖 ≤ 0
(A1)
where w1,i x1,i 1 1,i, 1 is of dimension k1 and x1,i is a set of k1 control variables. Equation (A2) explains the observed variable w2,i as a function of individual characteristics and the endogenous binary variable z1,i 1 if w1,i 0 and z1,i 0 if w1,i ≤ 0, w2,i z1,i z2,i 2 2,i = x2,i 2 2,i
(A2)
where is the structural parameter associated with the binary endogenous variable z1, z2,i is a set of k2 explanatory variables not necessary identical to x1,i and 2 is a vector of parameters of dimension k2, x2,i (z1,i, z2,i) and 2 (1, 2). We assume that i (1,i, 2,i) is normally distributed with mean (0, 0) and covariance for 1 i 1, …, n: ∑ = [ 𝜌𝜎
𝜌𝜎 ]. Parameter represents the correlation between the unobservable 𝜎²
variables. Parameter 2 is the variance of 2,i. Since the probit equation (A1) is not identified, we chose to normalize the variance of the endogenous binary variable to 1. This is a standard restriction in probit models. Let (1, 2), w1 (w1,1, …, w1,n), w2 (w2,1, …, w2,n2) and define w = (w1, w2). We define 1, 2, and in a similar fashion. The covariance of the unobservable variables is simply = E = In where In denotes the identity matrix of dimension nn. Thus 1 is readily obtained. We similarly define 𝑋=[
𝑥11 0
0 ] 𝑥2
2𝑛 × (𝑘1 + 𝑘2 )
The (partially) latent model can be written in matrix format:
38 w X
(A3)
Hence conditional on w and , the estimates of are simply obtained by a generalized leastsquares (GLS) regression of (A).34 Moreover, the matrices X-1X and X1w required for the GLS estimates of the parameters of the model are easily computed. The Metropolis-Gibbs sampling algorithm proceeds in 4 steps. The first step is a standard data augmentation step. We use a uniform prior for , and a non-informative prior for , p(, ,
) 1/.35 To simplify notations we have dropped the dependence of on and the dependence of on and when there is no ambiguity.
Step 1. w1 | , , w2, y, X In the first step, we only need to draw w1 since w2 is observed. We know that conditionally on
, , y, X, (w1,i, w2,i) has a joint normal distribution with mean (x1,i1, x2,i2) and covariance . Thus, w1,i | w2,i, , , , y, X TN(1|2, 1|2; B1,i) where TN(a, b; c) denotes the normal distribution with mean a, variance b truncated in subspace c and B1,i {z R: z 0} if y1,i 0 while B1,i {z R: z 0} if y1,i 1. The conditional moments 1|2 and 1|2 are given by the standard formulas of the conditional distribution from a bivariate normal distribution.
Step 2. z1 | , , w, y, X This step of the MCMC algorithm sets z1,i = 1 if w1,i > 0 and z1,i = 0 if w1,i ≤ 0. 34
Since each stage generally includes different sets of explanatory variables, we cannot estimate the seemingly unrelated regressions model with ordinary least-squares regression applied to each latent equation separately. 35 The choice of the prior distribution does not matter much when there is a large number of observations. Moreover, using the uniform prior distribution provides a direct means of comparison with the maximum likelihood procedures.
39
Step 3. | , w, y, X As discussed in the presentation of the (partially) latent model, the conditional distribution of is readily seen to be:
| , y, w, X N((X-1X)1 X1w, (X-1X)1).
Step 4. | , w, y, X The conditional posterior distribution of is not standard, | , y, w, X ||-n/2 exp1/2) / , but can be simulated using a Metropolis step. We use a normal jumping distribution N((, ),
I22).36
We set the elements of in the Metropolis-Hastings algorithm to obtain an acceptance rate between 0.1 and 0.25. Draws that resulted in values of the correlation coefficients below -1 or above 1, as well as draws not resulting in a positive covariance matrix, were rejected. Note also that we used a log transformation of the various probabilities in order to avoid numerical underflows. 36
40 APPENDIX 5 | SUMMARY STATISTICS BY COUNTRY BAND A. Summary statistics at the institution-quarter level for Band 1 countries VARIABLES
mean
sd
min
max
N
Dependent variable # publications
3.187
4.317
1
55
4,037
Countries Kenya Nigeria
0.459 0.541
0.498 0.498
0 0
1 1
4,037 4,037
Main variables of interest treated (OARE) treated_AGORA treated_HINARI
0.145 0.230 0.197
0.352 0.421 0.398
0 0 0
1 1 1
4,037 4,037 4,037
Article characteristics # co-authors USA # co-authors EUR # OARE references # pages # references
0.464 0.617 6.558 8.720 29.32
1.237 1.289 7.579 4.410 16.67
0 0 0 1 0
36 39 58 66 247
4,037 4,037 4,037 4,037 4,037
Institutional characteristics Rank1: rank<=5,000 Rank2: 5,000
0.132 0.062 0.109 0.0463 0.651
0.338 0.241 0.312 0.210 0.477
0 0 0 0 0
1 1 1 1 1
4,037 4,037 4,037 4,037 4,037
City characteristics Distance, in 100 km Pop0: pop<=100, in 1,000 Pop1: 1005,000, in 1,000
2.931 0.295 0.166 0.0798 0.459 0.0002
2.982 0.456 0.372 0.271 0.498 0.016
0 0 0 0 0 0
15.94 1 1 1 1 1
4,037 4,037 4,037 4,037 4,037 4,037
Registered research institutions receive free OARE membership in Band 1 countries (GNI per capita below $1,600).
41 B. Summary statistics at the institution-quarter level for Band 2 countries VARIABLES
mean
sd
min
max
N
Dependent variable # publications
1.907
2.194
1
22
2,565
Countries Bolivia Ecuador Peru
0.239 0.232 0.529
0.427 0.422 0.499
0 0 0
1 1 1
2,565 2,565 2,565
Main variables of interest treated (OARE) treated_AGORA treated_HINARI
0.114 0.0897 0.213
0.318 0.286 0.409
0 0 0
1 1 1
2,565 2,565 2,565
Article characteristics # co-authors USA # co-authors EUR # OARE references # pages # references
1.414 1.462 9.759 9.915 35.66
4.099 3.543 10.72 5.634 19.95
0 0 0 1 0
37.25 54.33 135 73 213
2,565 2,565 2,565 2,565 2,565
Institutional characteristics Rank1: rank<=5,000 Rank2: 5,000
0.269 0.0589 0.014 0.0016 0.656
0.444 0.235 0.119 0.0395 0.475
0 0 0 0 0
1 1 1 1 1
2,565 2,565 2,565 2,565 2,565
City characteristics Distance, in 100 km Pop0: pop<=100, in 1,000 Pop1: 1005,000, in 1,000
3.162 0.156 0.101 0.178 0.196 0.369
3.811 0.363 0.301 0.383 0.397 0.483
0 0 0 0 0 0
19.13 1 1 1 1 1
2,565 2,565 2,565 2,565 2,565 2,565
Registered research institutions receive reduced-fee OARE membership ($1,000 per year) in Band 2 countries (GNI per capita below $5,000).
42
0
2
Density
4
6
APPENDIX 6 | HISTOGRAM OF THE LOG NUMBER OF PUBLICATIONS
0
1
2 log(publications)
3
4
Histogram of the log number of publications at the article level. The log number of publications is the dependent variable in the regressions.
43
.6 .4 .2 0
Density
.8
1
APPENDIX 7 | RESIDUALS OF SPECIFICATION (5) FROM TABLE 2
-4
-2
0 u
2
4
Residuals of Specification (5) from Table 2. We observe a single peaked distribution with slight asymmetry. OLS and IV estimation methods are robust to any distribution of the residuals.
44 APPENDIX 8 | TREATMENT EFFECT BY COUNTRY BAND
VARIABLES
(1) OLS
treated
0.295*** (0.064) # co-authors USA -0.026** (0.013) # co-authors EUR 0.026** (0.013) # OARE references 0.007* (0.004) 5,000
Band 1 Countries (2) (3) IV 1 IV 2
(1) OLS
Band 2 Countries (2) (3) IV 1 IV 2
0.967*** (0.305) -0.026** (0.013) 0.031** (0.013) 0.008** (0.004) -0.825*** (0.207) -1.123*** (0.200) -1.342*** (0.202) -0.822*** (0.262) -0.010 (0.018) 1.232*** (0.301)
0.810*** (0.288) -0.026** (0.013) 0.030** (0.013) 0.008* (0.004) -0.837*** (0.207) -1.143*** (0.199) -1.354*** (0.200) -0.897*** (0.258) -0.009 (0.018) 1.323*** (0.297)
0.383*** (0.083) 0.031*** (0.007) 0.016 (0.013) 0.003 (0.002) -0.625*** (0.096) -0.606*** (0.096) -1.064*** (0.261) -0.589*** (0.103) 0.007 (0.008) 0.708*** (0.123)
0.908*** (0.201) 0.034*** (0.007) 0.010 (0.013) 0.003* (0.002) -0.657*** (0.102) -0.608*** (0.110) -1.056*** (0.407) -0.415*** (0.105) 0.006 (0.008) 0.387*** (0.140)
0.885*** (0.193) 0.034*** (0.007) 0.010 (0.013) 0.003* (0.002) -0.656*** (0.101) -0.608*** (0.109) -1.056*** (0.399) -0.423*** (0.105) 0.006 (0.008) 0.397*** (0.138)
Quarter dummies Country dummies City population dummies
YES YES YES
YES YES YES
YES YES YES
YES YES YES
YES YES YES
YES YES YES
Observations R-squared
4,037 0.288
4,037 0.247
4,037 0.264
2,565 0.409
2,565 0.368
2,565 0.371
Results on the impact of OARE membership (treated) on the output of research institutions in Band 1 countries (Kenya, Nigeria) and Band 2 countries (Bolivia, Ecuador, Peru) from OLS and instrumental variables estimation methods. The institution-quarter pairs constitute the unit of observation. The dependent variable is the log of the number of publications of an institution in a given quarter. Period under study: 1st quarter 2000 to 2nd quarter 2012. Reference countries are Nigeria (Band 1) and Peru (Band 2). Reference quarter is 36. Reference rank is rank ≤ 5,000. Robust standard errors clustered at the institutional level in parentheses. Not reported: # pages, # references. *** p<0.01, ** p<0.05, * p<0.1.
45 APPENDIX 9 | TREATMENT EFFECT BY THE NUMBER OF QUARTERS WITH PUBLICATIONS
VARIABLES treated
Institutions with publications in ≤ 25 quarters (1) (2) (3) OLS IV 1 IV 2
Institutions with publications in > 25 quarters (4) (5) (6) OLS IV 1 IV 2
0.111* (0.064) -0.001 (0.003) 0.002 (0.003) 0.001 (0.001) -0.212*** (0.076) -0.141 (0.095) -0.101 (0.112) -0.204*** (0.064) -0.004 (0.003) 0.372*** (0.092)
0.704*** (0.194) -0.002 (0.004) 0.001 (0.003) 0.002** (0.001) -0.284*** (0.086) -0.185* (0.101) -0.153 (0.110) -0.021 (0.072) -0.004 (0.003) 0.150* (0.084)
0.566*** (0.167) -0.002 (0.003) 0.001 (0.003) 0.002** (0.001) -0.268*** (0.083) -0.175* (0.097) -0.141 (0.106) -0.063 (0.062) -0.004 (0.003) 0.201** (0.079)
0.220*** (0.067) 0.010 (0.010) 0.0365*** (0.012) -0.002 (0.007) -0.992*** (0.188) -1.203*** (0.183) -1.170*** (0.180) -0.628*** (0.156) -0.005 (0.02) 1.850*** (0.233)
0.945*** (0.319) 0.015 (0.010) 0.032*** (0.011) -0.001 (0.007) -0.943*** (0.181) -1.111*** (0.191) -1.181*** (0.173) -0.322 (0.213) -0.008 (0.023) 1.350*** (0.340)
0.861*** (0.313) 0.014 (0.010) 0.0324*** (0.011) -0.002 (0.007) -0.949*** (0.180) -1.122*** (0.189) -1.180*** (0.173) -0.357* (0.210) -0.008 (0.023) 1.408*** (0.337)
Quarter dummies Country dummies City population dummies
YES YES YES
YES YES YES
YES YES YES
YES YES YES
YES YES YES
YES YES YES
Observations R-squared
3,896 0.068
3,896 -0.060
3,896 -0.007
2,706 0.340
2,706 0.286
2,706 0.298
# co-authors USA # co-authors EUR # OARE references 5,000
Results on the impact of OARE membership (treated) on the output of research institutions in five developing countries (Bolivia, Ecuador, Kenya, Nigeria, Peru) by the number of quarters with publications (≤ 25 quarters, > 25 quarters) from OLS and instrumental variables estimation methods. The institution-quarter pairs constitute the unit of observation. The dependent variable is the log of the number of publications of an institution in a given quarter. Period under study: 1 st quarter 2000 to 2nd quarter 2012. Reference country is Nigeria. Reference quarter is 36. Reference rank is rank ≤ 5,000. Robust standard errors clustered at the institutional level in parentheses. Not reported: # pages, # references. *** p<0.01, ** p<0.05, * p<0.1.