Does Money Really Matter? Estimating Impacts of Family Income on Young Children’s Achievement with Data from Random-Assignment Experiments Pamela Morris MDRC Greg J. Duncan Northwestern University Christopher Rodrigues MDRC October 17, 2006 Acknowledgments This paper was completed as part of the Next Generation project, which examines the effects of welfare, antipoverty, and employment policies on children and families. This paper was funded by the Next Generation Project funders: the David and Lucile Packard Foundation, William T. Grant Foundation, the John D. and Catherine T. MacArthur Foundation, and the Annie E. Casey Foundation. We thank the original sponsors of the studies for permitting re-analyses of the data; Beth Clark-Kauffman, Heather Hill, and Ginette Azcona for analytical and research assistance; Joshua Angrist, Raquel Bernal, Dan Black, David Card, Robert Moffitt, Chris Taber, an anonymous referee and MDRC’s Income Support Studies Committee members for thoughtful comments on earlier drafts. Please direct all correspondence regarding this submission to Pamela Morris, MDRC, 16 East 34th Street, New York, New York 10016; e-mail:
[email protected].
1
Does Money Really Matter? Estimating Impacts of Family Income on Young Children’s Achievement with Data from Random-Assignment Experiments Abstract Studies using nonexperimental data have generated little consensus on whether parental income promotes children’s achievement. We revisit this issue by using random-assignment-induced variation in family income in four welfare and anti-poverty programs to identify income effects. Our results suggest that family income has a policy-relevant positive impact on the eventual school achievement of preschool children. EconLit classifications: I320, I380, J240
2
Does Money Really Matter? Estimating Impacts of Family Income on Young Children’s Achievement with Data from Random-Assignment Experiments I. Introduction Despite countless studies estimating the association between family income and child development, there is no consensus on how, and even whether, a policy-induced increase in family income would be spent in ways that would boost the achievement of children (Duncan & Brooks-Gunn, 1997; Haveman & Wolfe, 1995; Mayer, 1997). The estimation problem is a familiar one: virtually all studies of income effects are based on nonexperimental data and susceptible to biases from such unmeasured parental characteristics as genetic endowments or parental mental health. We revisit this issue using data from four welfare-to-work experiments. All four assigned welfare-recipient single parents at random to control groups or to various welfare and employment policy treatments. All policy treatments had components designed to increase employment and reduce welfare. Some but not all were designed to increase total family incomes. None of these policy packages had components designed to affect outcomes for children directly (e.g., direct child care services to children), nor did any target parents or parenting (e.g., through therapy or parenting services). Children’s school achievement was measured in surveys and achievement tests administered two to five years after the point of random assignment. We use the exogenous variation in family income by random assignment to identify the effects of income on the achievement of young children, all of whom were between the ages of two and five at the time of their families’ random assignment and were between the ages of four and ten when their achievement was assessed.
3
Our paper is organized as follows: Section II reviews the literature. Section III describes our analytic approach, while Section IV describes the data and measures used in our analysis. Section V details our results; and a summary and discussion follow in Section VI. II. Background An extensive literature examining the relation between family economic resources and child outcomes has developed in economics, developmental psychology and sociology. In economics, a household production model posits that child outcomes are the product of the amount and quality of parental time inputs, the amount and quality of other caretakers’ time, and market goods spent on behalf of children (Becker, 1965; Desai, Chase-Landsdale, & Michael, 1989). Income matters in this model because it enables parents to purchase inputs that matter for the production of child outcomes. A regression relating income to child outcomes amounts to a reduced-form version of this model. While a number of studies have attempted to estimate the effects of income on children’s development, few rely on experimental or quasi-experimental variation in income. Some compelling quasi-experimental data demonstrating that child ability is affected by family socioeconomic status come from an adoption study that compared the pre- vs. post-adoption IQs of children adopted into low-, middle- and high-SES families (Duyme, Dumaret, AnnickCamille, & Tomkiewicz, 1999). All of the adopted children had low IQs (in the 60-86 range) prior to adoption and were adopted between ages 4 and 6. IQ prior to adoption was independent of placement-family SES. However, post-adoption IQ growth was strikingly different by SES (defined by father’s occupation), with the gains associated with adoption into high- and middleSES families much larger than the IQ gains for children adopted into low-SES families. But the
4
study was unable to distinguish whether income or some correlated aspect of the family or community environments of higher SES families was responsible for the differential IQ gains. In four income-maintenance experiments in the 1960s and 1970s, families were randomly assigned to treatment groups that received income supplements or to a control group that received no special income supplements (Institute for Research on Poverty, 1976; Kershaw & Fair, 1976; U.S. Department of Health and Human Services, 1983; Salkind & Haskins, 1982). However, child outcomes were not measured very well in the evaluation studies. School performance and attendance were affected positively in some sites for elementary-school-age children, but not for high-school-age adolescents. In the two sites reporting high school completion and advanced education, these outcomes were higher for the experimental group. Numerous nonexperimental studies show that family income has positive associations with outcomes for children, although more so for cognitive outcomes than for child behavior and health (Haveman & Wolfe, 1995; Duncan & Brooks-Gunn, 1997; Duncan, Brooks-Gunn, Yeung, & Smith, 1998; Klerman, 1991; Korenman & Miller, 1997). Moreover, the effects of income appear to differ across the childhood age span. Duncan et al. (1998) find that family economic conditions experienced before the age of 5 are more strongly associated with children’s failure to complete schooling in adolescence than economic conditions from age 6 to 15. Such results are consistent with theoretical predictions about the developmental malleability of preschool children (Shonkoff & Phillips, 2000) and about the susceptibility of the early childhood period to family influences, as compared with schools, neighborhoods, and peer influences (Bronfenbrenner & Morris, 1998; McCall, 1981). Research suggests that family economic conditions matter because they enhance the material and social resources available to children (Becker, 1981; Bergstrom, 1997; Coleman,
5
1988) and may improve family psychological processes (e.g., parental emotional well-being and parenting; Chase-Lansdale & Pittman, 2002; McLoyd, 1990, 1997, 1998; McLoyd, Jayartne, Ceballo, & Borquez, 1994). However, most of these process studies fail to establish convincingly that their estimated effects are due to income rather than preexisting differences between families (Bradley & Corwyn, 2002; Duncan & Brooks-Gunn, 1997; Duncan, BrooksGunn, Yeung, & Smith, 1998; Mayer, 1997; McLoyd, 1998). Other studies yield a mixed verdict on whether family income influences healthy child development. Mayer (1997) tests for omitted-variable bias and finds large reductions in the estimated impact of parental income, leading her to conclude that much of the estimated effect of income in the literature is spurious. Blau (1999) estimates a number of models relating income and other aspects of parental family background to children’s ability and achievement test scores as well as behavior problems. He finds small and insignificant effects of current income and larger (although still modest) effects of long-run income, although he does not investigate whether income effects differ by child age. Shea (2000) estimates the impact of parents’ income on their children’s labor market outcomes by using parental income variation induced by factors that may reflect luck (i.e. union, industry and job loss experience). His estimates suggest negligible income effects, although, as he points out, some of his instruments may be correlated with unobserved ability. Dahl and Lochner (2005) also adopt an instrumental-variable approach, but take advantage of the increased generosity of its Earned Income Tax Credit (EITC) program during the 1990s. Using data from the National Longitudinal Survey of Youth – Child Sample, they find consistently significant income effects, with their preferred estimates suggesting that a $3,000 increase in family income boosts reading achievement by about one-tenth of a standard deviation and math achievement by about half that amount. In contrast to Duncan et al. (1998),
6
Dahl and Lochner (2005) find quite similar effects of income in middle childhood and during the preschool years. 1 Prior work using data from seven large-scale random-assignment welfare and antipoverty studies conducted during the 1990s provides the foundation for the analyses we present here. For children who were preschool and elementary-school age at random assignment, programs that were designed to increase both employment and, through generous earnings supplements, family income led consistently to improved achievement and, in some cases, to improved social behavior as well (Morris, Huston, Duncan, Crosby, & Bos, 2001). Programs that required employment but did not offer earnings supplements had few and inconsistent effects on children’s development (McGroder et al., 2000; Morris et al., 2001). A more recent examination of an expanded set of data from these experiments finds that children undergoing the developmental transition into elementary school appear to benefit the most to the changes in families brought about by these policies (Morris, Duncan, & ClarkKauffman, in press). But this research focuses on program impacts and does not attempt to secure estimates of the effect on child achievement of family income. Our current paper is focused precisely on that task. III. Analytic Approach As detailed below, we use data from four studies that evaluated eight welfare and antipoverty programs: Connecticut’s Jobs First; the New Brunswick and British Columbia sites of the Canadian Self-Sufficiency Project (SSP); the Los Angeles Jobs First GAIN and the Atlanta, GA, Grand Rapids, MI, and Riverside, CA sites of the National Evaluation of Welfare to
1
The Dahl and Lochner model presumes concurrent effects of income on child achievement and the earliest measurement of child achievement is age five, so their data do not cover much of the preschool period. Their attempt to estimate a model with lagged income effects is inconclusive.
7
Work Strategies (NEWWS). Collectively, these studies provide us with more than 8,000 observations of children age 2 to 5 at the time of random assignment. We seek to use these data to estimate a reduced-form model of the impact of family income on child achievement: (1) Yi = α1 Incomei + X′i βY + ξ1i where Yi is achievement of the ith child, Incomei is child i’s family income, and X′i is a vector of control variables. Our interest is in using random assignment to instrument for Incomei. Each study can be used to generate its own estimate of α1, with random assignment driving identification of the income effect. We also pool data across studies to generate a more precise estimate of income effects. This requires that studies have comparable measures, a point to which we return below. Pooling data from the eight program sites, our achievement equation has the form: (2) Yi = α1 Incomei + X′i βY + S′i γY + ξ2i and our income equation has the form: (3) Incomei = X′i βI + T′i γ11 + S′i γ12 + ξ3i In (2) and (3), S′i is a vector of seven of the eight site dummies and T′i is a vector of eight site-specific treatment dummies. The inclusion of site dummies in both (2) and in (3) insures that within-site differences between treatment and control groups drive the identification of the IV model. Exclusion restrictions require that any instrument we select must not affect Yi through any other means than Incomei (Angrist, Imbens, & Rubin, 1996). Because our welfare intervention studies sought to increase maternal employment, which could have an independent effect on parental time allocation and children’s achievement, the exclusion restriction may not
8
be met. An additional concern with regard to the exclusion restriction is that reducing welfare receipt was also a separate target of these programs. Prior research would suggest that welfare receipt may itself have an independent effect on children as distinct from other sources of income because of the stigma associated with welfare receipt (Levine and Zimmerman, 2005). 2 Accordingly, we also estimate a more complete model that includes hours of employment and welfare receipt as additional endogenous variables to address the exclusion restriction requirements. It is important to note that since employment and welfare receipt are choice variables, the resulting estimation of income effects loses its reduced-form interpretation. 3 IV. Measures We begin with a short description of the program under study in each of these evaluations. In each case, welfare recipients were randomly assigned to the program described below, or to a control group to receive welfare as usual (the Aid to Families with Dependant Children (AFDC) system for the U.S. studies, and Income Assistance (IA) for SSP). Connecticut’s Jobs First Program. Single-parent welfare recipients were randomly assigned to participate in Connecticut’s Jobs First program or to receive welfare through the AFDC system (Bloom et al., 2002). The program combines three key elements of many welfare reforms: time limits, earnings supplements and work requirements. Jobs First limits families to 21 cumulative months of cash assistance unless they receive an extension or exemption. It includes an unusually generous welfare benefit reduction scheme that allowed families to retain their full welfare grant as long as they earn less than the federal poverty level. At the same time,
2
Welfare programs have also targeted child care and parenting. All of the studies used in this paper were designed to affect maternal employment and welfare receipt and, in the case of some programs, family income, but none of them provided child services or parenting assistance.
3
An alternative structural model would include wage rate and non-labor income. Our data lack high-quality measures of both of these variables.
9
it requires recipients to work or to participate in employment services designed to help them find jobs quickly. Data on children were collected three years after parents were enrolled in the study. SSP. In SSP, single parent welfare recipients in the provinces of British Columbia and New Brunswick who had been in Canada’s welfare program for at least one year were randomly assigned to the SSP program or to receive cash assistance through Canada’s Income Assistance Program (Michalopoulos et al., 2002; Morris & Michalopoulos, 2000; 2003). SSP took a pure make-work-pay approach, offering a generous earnings supplement for full-time work (at least 30 hours per week) for up to three years. The earnings supplement was a monthly cash payment available to single-parent welfare recipients who chose to leave welfare for full-time work within a year of being offered the supplement. The amount of the supplement was calculated as half the difference between a recipient’s earnings and an earnings benchmark set such that a parent with a full-time minimum-wage job would roughly double her income if she received the supplement. A substudy of the main SSP evaluation was intended to estimate the added effects of providing employment services in addition to the financial incentive on outcomes for children. That study randomly assigned welfare recipients to the SSP-Plus program or to the control group, to receive Income Assistance as usual, for a subset of families in New Brunswick (Quets, Robins, Pan, Michalopoulos, & Card, 1999) 4 . Data on children were collected at 36 and 54 months after parents were enrolled in either the main SSP study or the SSP-Plus substudy. LA GAIN. Like Connecticut’s program, single parent welfare recipients were randomly assigned to the LA GAIN program or to be subject to the benefits of the AFDC system 4
In fact, the SSP Plus study was originally designed as a three-group design. For the purposes of this pooled analysis, we treat those assigned to the SSP-Plus program as in that program group, and those assigned to the SSP standard program as in that program group, and any in the control group in either the SSP Plus or the standard SSP study as control group members. We do not include contrasts to the two different program streams in these analyses.
10
(Freedman et al., 2000). LA GAIN is a strict work-first program, imparting a clear work-first message, and requiring that parents’ participate in employment-related activities as a condition of receiving their welfare benefits. Sanctions were used to enforce participation. Data on children were collected two years after parents were enrolled in the program. NEWWS. Operating in three sites (Atlanta, Georgia; Grand Rapids, Michigan; and Riverside, California), NEWWS randomly assigned single parents to the NEWWS labor force attachment (LFA, a jobs-first program) or to the AFDC system (NEWWS, Hamilton et al., 2001; McGroder et al., 2000). The primary objective of this program was to reduce single parents’ welfare use and increase their employment. The programs required welfare recipients to participate in employment-related activities as a condition of receiving welfare. Families who failed to meet the participation requirements could receive sanctions. Data on children were collected at two years after parents were enrolled in the program. Our pooled data consist of 8,073 child observations taken from 5,694 children living in 5,141 single-parent families. Children range in age from 2-5 at the point of random assignment. In all studies, families entered at the time of their application or re-determination application for welfare. The distribution of the sample across studies is presented in the sample size row of Table 1. Since our data contain multiple observations for some children (due to multiple sources of achievement reports and/or longitudinal data) and multiple siblings for some families, we adjust standard errors for lack of independence using Huber-White methods. School achievement. Children’s cognitive performance or school achievement is measured using a parent or teacher report or test scores. The SSP, Connecticut, and LA-GAIN studies included parent reports of children’s achievement on a 5-point rating of how well the
11
child was doing in school (n=4,280; in the Connecticut and LA-GAIN studies these are based on a single item measure; in SSP, these are based on an average of children’s reported functioning in three academic subjects). Teacher reports of achievement (collected only in a small sample of families in Connecticut, n=244) were based on items from the Academic Subscale of the Social Skills Rating System (Gresham & Elliot, 1990). On this 10-item measure, the teacher compares the child’s performance with that of other students in the same classroom on reading skill, math skill, intellectual functioning, motivation, oral communication, classroom behavior, and parental encouragement (internal consistency alpha = .94). Test scores include the Peabody Picture Vocabulary Test for children ages 4-7 at the 36 month follow-up in SSP (n=1,039), a math skills test containing a subset of items from the Canadian Achievement Tests, Second Edition (CAT/2) for children ages 8 and up at the 36 month follow-up in SSP (n=573), and the Bracken Basic Concepts Scale for children in NEWWS (n=1,937), all well validated and reliable tests of children’s cognitive performance. To provide comparability in outcomes across studies, we have standardized these achievement outcomes by subtracting study-specific means and dividing by study-specific control-group standard deviations. Relying on diverse methods of assessing children’s achievement has a long history in psychological research. In the standard psychometric model (Nunnally & Bernstein, 1994), each of the observed indicators of child achievement is assumed to contain common construct-related variance, indicator-specific variance and measurement error variance. Combining samples with diverse measures is appropriate if each measure is considered an indicator of a common latent construct – achievement in our case – and if each measure’s residual variance has classical measurement error properties. Combining cases with different achievement measures provides more efficient estimates of our key parameters. We test the assumption that our measures
12
represent a single construct by estimating a series of models to test whether experimental impacts on children’s achievement varied by the source of the report and we find that they do not. 5 Family income. Our key endogenous variable is family income. For all sample members in the three U.S. studies, administrative records provided data on monthly cash assistance and Food Stamp benefits, any cash supplement payments provided by the earnings supplement programs, as well as quarterly earnings in jobs covered by the Unemployment Insurance (UI) system. For the Canadian SSP samples, administrative records provided information on receipt of Income Assistance (IA) and receipt of SSP supplement payments, while the parent survey collected data on earnings from employment. For each quarter following random assignment, we computed an average quarterly parent income based on the sum of earnings, AFDC/TANF/IA and supplement payments, and Food Stamp payments. Note that this income measure omits selfemployment and informal earnings (except in SSP), other public transfers, private transfers, and earnings from family members other than the sample member. All income amounts have been inflation-adjusted for 2001 prices using the CPI. In the case of the SSP, Canadian dollars are converted to American dollars before being adjusted for inflation. From this information, average annual income (in $1000s) and log average annual income were computed over the time between random assignment and the assessment of child achievement. Employment hours. For all studies, employment information was collected via the parent surveys. For each job parents had between random assignment and the survey, parents were asked to report the month and year in which they started and ended each job. Additionally, parents were asked to report for each job the number of hours worked per week when they left 5
To do this, we interacted source of report with the experimental dummy. Our models find no significant differences in the experimental impacts depending on whether the parent report, test score, or teacher report measure is used (F (2, 5140) = .48, p = .62). We find similar results when these source of report by experimental interactions are conducted for each of the individual studies. This gives us empirical justification for treating the multiple measures as a composite index. 13
the job (or currently if still working). Respondents were asked to report all jobs, including self employment and any other employment that may have taken place informally or out of state. Average hours employed per quarter over the follow-up was computed using the employment information on all jobs listed in the parent survey. Welfare receipt. Monthly or quarterly welfare receipt from public assistance records was collected for all years of the follow-up period for each study. Average welfare receipt per quarter was computed for all years of the follow-up using these data. Sample members were coded as having received welfare in a quarter if their welfare payments for that quarter were greater than zero. Our welfare variable is the average welfare receipt rate across all quarters of the follow-up period. Other control variables. Covariates included in the first and second stage models include baseline parental and family characteristics (no baseline data were collected on children’s outcomes in these studies). Administrative data and baseline surveys taken just prior to random assignment provided comparable pre-random-assignment measures of child age; length of receipt of cash assistance prior to baseline; average earnings in the year prior to baseline and its square: measures of whether the parent was employed in the year prior to baseline; whether the parent has a high school degree or GED; age of the child; whether the parent was a teenager at the time of the child’s birth; the marital status of the parent; the number of children in the family; the age of the youngest child in the family; and the race/ethnicity of the parent. We also include controls for length of follow-up and type of achievement assessment, as well as dummy variables representing site/study controls.
14
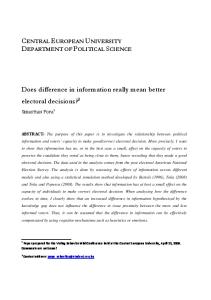
V. Results Baseline differences in baseline parent and family characteristics between treatment and control groups are presented in Table 1. Of the 120 experimental/control group contrasts shown in Table 1, eleven were statistically significant at the .05 level and none are consistently significant across studies. Individual study estimates. OLS estimates of the study-specific impacts of experimental group assignment on the adult income and child achievement outcomes are presented in Table 2. Pre-random assignment child, parental, and family characteristics are included as control variables in these regressions. Program impacts on family income are concentrated in the three programs with generous earnings supplement policies, an important result since program variation in income impacts is vital for our efforts to distinguish the achievement effects of income from the effects of employment and welfare income. Income increases for these three programs – SSP, SSP-Plus, and Connecticut Jobs First – ranged from $810 to $2200 annually. By comparison, estimated program impacts on family income for the work-first programs were small and statistically insignificant. For these latter studies, increases in earned income were largely offset by reductions in welfare payments. Program impacts on achievement were positive or neutral and statistically significant for only three of the eight programs, two of which supplemented earnings and one of which did not. The fourth and fifth columns of the table show site-specific IV estimates of the effects of annual income on child achievement when income is taken to be the only endogenous variable
15
(i.e., welfare and employment hours are not included in these models). 6 These coefficients amount to the ratio of program impacts on child achievement to the program impacts on annual income. All coefficients are positive in sign although many of these coefficients are estimated very imprecisely, particularly for programs with insignificant impacts on income. Figure 1 presents each site/study’s impact on child achievement plotted against its impact on parental income. A positive slope is evident—programs with the largest positive impacts on income tend to have larger positive impacts on child achievement. Our pooled estimates of income effects using income as the only endogenous variable rely on this program variability. Pooled IV estimates. Table 3 shows the first-stage coefficients on the experimental group dummy variables in regressions in which average annual income, average quarterly welfare receipt, and average hours employed per quarter are dependent variables. Estimated impacts on income and log income are virtually identical to those presented in Table 2, as might be expected since the two sets of estimating equations differ only in that the study-by-study estimates allow for study-specific coefficients on control variables, while the pooled model constrains control coefficients to be identical across studies. Consistent with the goals of these program models, effects on welfare receipt are generally negative. The sizes of these negative effects are generally larger for the programs with the largest positive impacts on employment. 7 Significant employment effects are found in almost all sites (the exceptions being LA-Gain and NEWWSAtlanta). However, the magnitudes of these effects vary across sites from a small and
6
These and all other IV estimates in this paper are based on STATA’s ivreg procedure, with a cluster adjustment to account for the fact that in some cases there are multiple achievement reports per child and multiple children per family.
7
An exception is the Connecticut Jobs-First program, which increased welfare receipt as it increased employment. This is in keeping with the Jobs-First program model—prior to the time limits, families were allowed to keep their full welfare benefits as they went to work. 16
statistically insignificant decline in LA-GAIN to a 79 hour per quarter increase in NEWWWSGrand Rapids. Table 4 presents the second stage IV estimates from models estimating the effects of annual income and log income first without and then with the inclusion of instrumented employment and welfare in the model. We also present estimates from comparable OLS models. OLS models show no statistically significant effects of income on child achievement. Coefficient estimates are small, with an additional $1,000 of family income associated with less than one percent of a standard deviation increase in child achievement. 8 IV estimates are considerably larger and statistically significant– a .06 standard unit change in child achievement associated with every $1,000 increase in annual income. The size of this coefficient changes little when employment and welfare receipt are considered to be endogenous variables in the system. A log unit increase in family income is estimated to increase achievement by .54 to .61 of a standard deviation, depending on whether the employment and welfare predictions are included. Robustness tests. We conducted a series of tests to establish that our results were robust. First, we worried that our results might be sensitive to the distinction between parent- and test score-based measures of child achievement (there were too few programs that included data on teacher report to conduct our full analysis using only this outcome measure of child achievement). Four of the studies included parent reports and only three gathered test scores. The first row of Table 5 shows that IV estimates of income effects in the single-endogenousvariable models depend very little on the source of the achievement report. Adding welfare and 8
It is difficult to interpret the OLS coefficients. The sample is much less representative of the population of lowincome children than a corresponding sample from a national longitudinal survey such as the NLSY or the Early Childhood Longitudinal Study – Kindergarten cohort (ECLS-K). We estimated correlations between family income and reading achievement tests scores for kindergarteners in the ECLS-K and, as might be expect, found that they fell substantially as the sample became more homogeneous. The overall sample correlation was .33. Correlations were .13 for children in families with incomes below $30,000 and .14 for families that received any income from cash welfare programs.
17
employment as endogenous variables drops coefficient estimates considerably (.65 to .56) but at the same time increases standard errors several fold. There appears to be insufficient information to disentangle employment, welfare receipt and income effects when either parentreported or test score data are considered separately. Second, we estimated models in which marriage was a fourth endogenous variable. Although research on welfare and employment policies generally finds few program impacts on parents’ marital behavior (Gennetian & Knox, 2003), parents’ marital status is a possible way in which these programs might have had a direct impact on child achievement. IV models that include marriage as a fourth endogenous variable yield the same conclusions as those presented in Table 4, with an IV coefficient for income of .06 (se = .04, p < .10) on children’s achievement. Finally, we examined the sensitivity of the estimates to a reduced set of instruments that enable us to test a just-identified model. We grouped our programs into three categories: generous earnings supplement programs with no time limits or mandates; the single time limited welfare program (which also included generous earnings supplements); and mandatory workfirst programs. We use the experimental-control contrast in each of these categories as instruments in our first stage equations. Our single-variable income IV model produces almost identical results to those shown in Table 4, with significant and positive effects of income (with a coefficient of .06). Results in the model including employment and welfare receipt along with income are much weaker, with a coefficient of .01 (se = .04; p = .71) for the income effects on achievement. VI. Conclusion We find noteworthy effects of family income on school achievement of young children in most of our instrumental-variable models. This effect of income for young children is consistent
18
with some of the nonexperimental research as well as developmental theories suggesting that children’s development is malleable and susceptible to family influences during the preschool period. Our IV estimates suggest that a $1,000 increase in annual income sustained for between two and five years boosts child achievement by 6 percent of a standard deviation and that a log unit increase in annual income increases child achievement by about half a standard deviation. Translated into an IQ-type scale, 6% of a standard deviation amounts to about one point, half a standard deviation amounts to 8 points. Translated into one of the achievement tests we use -- the Bracken Test of School Readiness -- these effect sizes translate into almost one and six additional correct answers to a 61-question test regarding colors, letters, numbers/counting, comparisons and shapes. The earnings supplement programs in our study boosted family income for younger children by between $800 and nearly $2,200 per year, which corresponds to achievement effect sizes ranging from 5 to 12 percent of a standard deviation, which is the magnitude we have observed in the experimental studies (10-15 percent of a standard deviation change due to assignment to the earnings supplement programs; Morris, Huston, Duncan, Crosby, & Bos, 2001). How to put our effect sizes into a policy perspective? Experimental studies of early preschool intervention programs offering very high levels of quality provide one point of reference. Treatment effect sizes on IQ were 1.0 standard deviations at 3 years and .75 at age 5 for the Abecedarian Project, and .60 for the Perry Preschool Project. But at $40,000 and $15,000, respectively, these large effect sizes came at great cost (by comparison, the SSP program cost only about $600 per program group member a year, in part because the supplement payments were offset by welfare savings and increased tax revenues). For $7,500, the Tennessee class size
19
experiment showed that smaller K-3 class sizes increased achievement by about .2 of a standard deviation (Krueger & Whitmore, 2001). By comparing income supplementation and early-education policy effect sizes, we do not mean to imply that the two kinds of programs serve the same purpose. Child development is the explicit target of educational interventions, but only one of many possible goals for income redistribution policies. Ensuring school readiness for all children probably requires that some receive preschool education intervention programs, independent of whatever income redistribution program might be present. Several caveats apply to our study. First, our data are drawn from children growing up in single-parent low-income families, precluding our ability to generalize to other family types and socioeconomic levels. Second, in pooling our data across sites, we assume similarity in the ways in which income affects children across our studies and sites. Relatedly, the Canadian experiments provide considerable power in estimating our income effects—these programs increase income most substantially and also have the largest positive effects on children’s achievement. Fortunately, the patterns of site-specific effects for income-enhancing programs make the case for a pooled analysis, across program models and sites. Finally, by using earnings supplement programs to generate our effects of income on child achievement, our findings are likely most germane to income-boosting policies that link increases in income to increases in employment. While we control for employment hours in all of these models, there may be emotional benefits to increases in earned but not other sources of income. To the extent that these psychological benefits are part of our income effects, our results are most relevant to income increases arising from earnings supplements as opposed to policies providing cash grants not tied to work (like child allowances).
20
That said, we end by emphasizing the size of our elasticity estimates. In terms of our sample’s $10,000 average income, our income elasticity estimates are about .60. This elasticity estimate is well outside the .04 to .20 range of income elasticity estimates cited in the Haveman and Wolfe (1995) literature review, but roughly in line with the instrumental-variables-based estimates of Dahl and Lochner (2005). But, with the exception of Dahl and Lochner (2005), none of their reviewed studies distinguished children by age and few allowed for income elasticities to differ between low and higher-income families. Estimating income effects for young children, and basing them on exogenous sources of income variability, produces impact estimates that appear highly relevant for policy.
21
REFERENCES Angrist, Joshua D.; Imbens, Guido. W. and Rubin, Donald. B. “Identification of causal effects using Instrumental Variables.” Journal of the American Statistical Association, 1996, 91, pp. 444-455. Becker, Gary. “A Theory of the Allocation of Time.” The Economic Journal, 1965, 75, pp. 493-517. Becker, Gary S. “A Treatise on the Family.” Cambridge, MA: Harvard University Press, January 1981. Bergstrom, Theodore. “A survey of theories of the family. In handbook of family and household economics.” Ann Arbor, MI: University of Michigan, 1997. Blau, David. M. “The effect of income on child achievement.” The Review of Economics and Statistics, 1999, 81 (2), pp. 261-276. Blau, David. M. and Grossberg, Adam. J. “Maternal labor supply and children’s cognitive development.” The Review of Economics and Statistics, 1992, 74 (3), pp. 474-481. Bloom, Dan; Scrivener, Susan; Michalopoulos, Charles; Morris, Pamela; Hendra, Richard; Adams-Ciardullo, Diana and Walter, Johanna. “Jobs First: Final report on Connecticut’s welfare reform initiative.” New York: MDRC, 2002. Bradley, Robert H. and Corwyn, Robert. “Socioeconomic status and child development.” Annual Review of Psychology, 2002, 53, pp. 371-399. Bronfenbrenner, Urie and Morris, Pamela. “The ecology of developmental processes,” in Richard M. Lerner, ed., Theoretical Models of Human Development. Vol. 1 of the
22
Handbook of Child Psychology, 5th ed., Editor-in-chief: William Damon. New York: Wiley, 1998, pp. 993-1028. Chase-Lansdale, Lindsay and Pittman, Laura. “Welfare reform and parenting: Reasonable expectations.” Future of Children, 12, 2002, pp. 1867-186. Coleman, James S. “Social capital in the creation of human capital.” American Journal of Sociology, 1988, 94, pp. S95-S120. Cooper, Harris and Hedges, Larry. The Handbook of Research Synthesis. New York: Russell Sage Foundation, 1994. Dahl, Gordon and Lochner, Lance. “The impact of family income on child achievement.” Cambridge, MA, NBER working paper number 11279, 2005. Desai, Sonalde; Chase-Landsdale, Lindsay and Michael, Robert T. “Mother of market? Effects of maternal employment on the intellectual ability of 4-year old children.” Demography, 1989, 26, pp. 545-561. Duncan, Greg and Brooks-Gunn, Jeanne. “Consequences of growing up poor,” eds., New York: Russell Sage, 1997. Duncan, Greg; Brooks-Gunn, Jeanne; Yeung, Wei-Jun J. and Smith, Judith. “How much does childhood poverty affect the life chances of children?” American Sociological Review, 1998, 63, pp. 406-423. Duyme, Michel; Dumaret, Annick-Camille and Tomkiewicz, Stanislaw. “How can we boost IQs of "dull children"? A late adoption study.” Proceedings of the National Academy of Sciences, 1999, 96, pp. 8790-8794.
23
Freedman, Stephen; Knab, Jean; Gennetian, Lisa and Navarro, David. “The Los Angeles Jobs-First GAIN Evaluation: Final report on a work first program in a major urban center.” New York: MDRC, 2000. Gennetian, Lisa and Knox, Virginia. “Staying Single: The Effects of Welfare Reform Policies on Marriage and Cohabitation.” New York: MDRC, 2003. Gresham, Frank and Elliott, Stephen. “Social skills rating system.” Circle Pines, MN: American Guidance Service, 1990. Hamilton, Gayle; Freedman, Stephen; Gennetian, Lisa; Michalopoulos, Charles; Walter, Johanna; Adams-Ciardullo, Diana; Gassman-Pines, Anna; McGroder, Sharon; Zaslow, Martha; Brooks-Gunn, Jeanne and Ahluwalia, Shawn. “How effective are different welfare-to-work approaches? Five-year adult and child impacts for eleven programs.” Washington, DC: U.S. Department of Health and Human Services, Office of the Assistant Secretary for Planning and Evaluation and Administration for Children and Families, and U.S. Department of Education, 2001. Harvey, Elizabeth. “Short-term and long-term effects of early parental employment on children of the National Longitudinal Survey of Youth.” Developmental Psychology, 1999, 35(2), pp. 445–459. Haveman, Robert and Wolfe, Barbara. “The determinants of children’s attainments: A review of methods and findings.” Journal of Economic Literature, 1995, 23, pp. 1829-1878. Institute for Research on Poverty. “The rural income maintenance experiment.” Madison WI: University of Wisconsin, 1976.
24
James-Burdumy, Susanne. “The effect of maternal labor force participation on child development.” Journal of Labor Economics, 2005, 23 (1), pp.177-211. Kershaw, David and Fair, Jerilyn. “The New Jersey Income Maintenance Experiment.” New York: Academic Press, 1976. Klerman, Lorraine. “The Health of Poor Children: Problems and Programs,” in Aletha Huston, ed., Children and poverty. Cambridge, Eng., and New York: Cambridge University Press, 1991. Korenman, Sanders; Miller, Jane E. and Watts, Harold. “Effects of long-term poverty on physical health of children in the National Longitudinal Survey of Youth,” in Greg J. Duncan & Jeanne Brooks-Gunn, eds., Consequences of growing up poor. New York: Russell Sage Foundation, 1997, pp. 70–99. Krueger, Alan and Whitmore, Diane. “The Effect of Attending a Small Class in the Early Grades on College-Test Taking and Middle School Test Results: Evidence from Project STAR.” Economic Journal, 2001, 11, pp.1-28. Levine, Philip and Zimmerman, David. “Children's welfare exposure and subsequent development.” Journal of Public Economics, 2005, 89, pp. 31-56. Mayer, Susan. “What money can’t buy: The effect of parental income on children’s outcomes.” Cambridge, MA: Harvard University Press, 1997. McCall, Robert B. “Nature-nurture and the two realms of development: A proposed integration with respect to mental development.” Child Development, 1981, 52, pp.1-12. McGroder, Sharon M.; Zaslow, Martha J.; Moore, Kristin A. and LeMenestrel, Suzanne M. “National evaluation of welfare-to-work strategies impacts on young children and
25
their families two years after enrollment: Findings from the child outcomes study.” Washington, CD: United States Department of Health and Human Services Office of the Assistant Secretary for Planning and Evaluation Administration for Children and Families, 2000. McLoyd, Vonnie C. “The impact of economic hardship on black families and children: psychological distress, parenting and socioemotional development.” Child Development, 1990, 61, pp. 311-346. McLoyd, Vonnie C. “The impact of poverty and low socioeconomic status on the socioemotional functioning of African American children and adolescents: Mediating affects,” in Ronald D. Taylor & Margaret C. Wang, eds., Social and emotional adjustment and family relations in ethnic minority families. Mahwah, NJ: Lawrence Erlbaum, 1997, pp. 7-34. McLoyd, Vonnie C. “Children in poverty, development, public policy, and practice,” in Irving. E. Siegel & K. Anne. Renninger, eds., Handbook of child psychology, 4th ed., New York: Wiley, 1998. McLoyd, Vonnie C.; Jayartne, Toby E.; Ceballo, Rosario and Borquez, Julio. “Unemployment and work interruption among African-American single mothers, effects on parenting and adolescent socioemotional functioning.” Child Development, 1994, 65, pp. 562– 589. Michalopoulos, Charles; Tattrie, Doug; Miller, Cynthia; Robins, Phil K.; Morris, Pamela; Gyarmati, David; Redcross, Cindy; Foley, Kelly and Ford, Rueben. “Making work pay: Final report on the Self Sufficiency Project for long-term welfare recipients.” Ottawa: SRDC, 2002.
26
Morris, Pamela; Huston, Aletha C.; Duncan, Greg J.; Crosby, Danielle A. and Bos, Johannes. M. “How welfare and work policies affect children: A synthesis of research.” New York: MDRC, 2001. Morris, Pamela and Michalopoulos, Charles. “The Self Sufficiency Project at 36 Months: Effects on Children of a Program that Increased Employment and Income.” Ottawa: SRDC, 2000. Morris, Pamela and Michalopoulos, Charles. “Findings from the Self Sufficiency Project: Effects on children and adolescents of a program that increased employment and income.” Applied Developmental Psychology, 2003, 24, pp. 201-239. Morris, Pamela; Duncan, Greg J. and Clark-Kauffman, Ellen. “Child well-being in an era of welfare reform: The sensitivity of transitions in development to policy change.” Developmental Psychology, in press. Nunnally, Jim C. and Bernstein, Ira H. Psychometric theory (3rd Ed.). New York: McGraw-Hill, 1994. Quets, Gail; Robins, Philip; Pan, Elsie; Michalopoulos, Charles and Card, David. “Does SSP Plus increase employment? The effect of adding services to the Self Sufficiency Project’s Financial Incentives.” Ottawa: SRDC, 1999. Ruhm, Christopher. “Maternal employment and adolescent development.” NBER Working Paper No. 10691, 2004. Salkind, Neil. J. and Haskins, Ron. “Negative income tax: The impact on children from low-income families.” Journal of Family Issues, 1982, 3, pp. 165-180.
27
Shea, John. “Does parents' money matter?” Journal of Public Economics, 2000, 77 (2), 155-184. Shonkoff, Jack P. and Phillips, Deborah. A. “From neurons to neighborhoods: The science of early childhood development,” eds., Washington, DC: National Academy Press, 2000. U.S. Department of Health and Human Services, Office of Income Security Policy “Overview of the Seattle-Denver Income Maintenance Experiment Final Report.” Washington, D.C.: U.S. Government Printing Office, 1983. Waldfogel, Jane; Han, Wen-Jui and Brooks-Gunn, Jeanne. “The effects of early maternal employment on child cognitive development.” Demography, 2002, 39 (2), pp. 369392.
28
Captions Table 1: Baseline Characteristics by Experimental Group Status and by Study and Site Table 2: Individual Study Impacts on Employment, Welfare Receipt, Income, and Child Achievement
Table 3: 1st Stage Instrumental Variable Model Results
Table 4: OLS and Second-Stage IV Estimates of the Effects of Endogenous Variables on Child Achievement Table 5: Results of the Effects of Income on Child Achievement by Outcome Measure
Figure 1: Individual Study Impacts on Income and Child Achievement
29
Table 1: Baseline Characteristics by Experimental Group Status and by Study and Site CT Job First Control Exp Child Characteristics Age (yrs) Parent Characteristics (%) Under age 18 at time of child's birth Race Black White Latino Other Marital status Never married Separated/divorced Married Parent Education, Employment, and Income High school graduate (%) Employment in year prior to random assignment Employed (%) Earnings ($) AFDC receipt prior to random assignmenta
4.04
4.00
12.20 13.18
LA-GAIN Control Exp 5.35
SSP British Columbia Control Exp
5.32
3.80
3.91 *
7.32 11.49
6.19
5.10
SSP Plus New Brunswick Control Exp
SSP New Brunswick Control Exp
NEWWS Atlanta Control Exp
3.96
3.99
3.83
3.92
4.30
4.41 **
12.82
13.08
10.66
12.55
6.02
3.17 **
NEWWS Grand Rapids Control Exp 4.26
NEWWS Riverside Control Exp
4.28
4.11
4.12
15.09 12.68
6.10
4.66
43.70 40.45 32.41 36.10 23.75 22.53 0.13 0.92 ***
39.02 40.23 17.07 10.34 37.80 44.83 6.10 4.60
3.09 1.09 ** 65.09 66.55 3.00 3.01 28.92 29.54
2.56 88.46 0.00 9.40
1.27 91.14 0.00 7.59
0.74 86.27 0.25 13.11
1.56 89.69 0.29 8.75 *
95.85 95.50 3.32 2.91 0.41 1.06 0.41 0.53
38.68 40.85 53.30 49.77 5.66 6.57 2.36 2.82
18.30 16.06 47.06 49.22 32.24 33.16 2.40 1.55
73.23 71.15 25.72 27.14 0.52 1.05
51.22 59.77 41.46 37.93 7.32 2.30 *
52.13 50.05 44.78 47.58 1.16 1.82
69.23 27.78 2.56
70.04 28.69 0.84
67.16 29.78 2.33
70.14 27.14 0.19 ***
69.50 75.93 ** 29.46 23.28 ** 1.04 0.79
56.60 59.15 41.04 37.56 2.36 3.29
44.01 41.45 54.25 56.99 1.74 1.55
63.25 58.50
39.02 52.87 *
42.84 49.86 *
55.56
59.07
48.65
50.78
64.52 60.32
58.96 62.91
48.80 59.07 **
50.66 44.66 * 2,954 2,576
35.37 42.53 1,767 2,378
21.57 25.80 995 1,011
31.62 871
30.38 690
28.92 1,144
30.64 987
38.59 34.39 1,498 1,139
61.32 51.64 ** 2,679 2,144
31.15 27.98 1,846 2,010
2.67
2.63
2.68
2.70
2.71
2.76 *
2.85
2.88
2.86
2.88
2.73
2.78
2.73
2.76
2.66
2.66
Family Composition Youngest child age (yrs) Number of children
3.23 2.37
3.16 2.40
4.29 2.62
4.28 2.32
2.59 1.97
2.81 ** 1.92
2.93 1.76
2.89 1.76
2.59 1.91
2.84 ** 1.79 *
3.79 2.24
3.80 2.31
2.95 2.11
3.01 2.11
3.54 2.15
3.50 2.27
Sample size (n=8,073)
762
759
82
87
234
237
816
482
378
212
213
459
193
1,034 1,097
1,028
NOTES: Exp = Experimental group. Two-tailed t-tests were applied to differences between the experimental and control group covariates. Study/site controls were used in the model. *p < .10 **p < .05 ***p < .01. a AFDC receipt coded 1(no receipt); 2(one month to two years); 3(more than two years).
30
Table 2: Individual Study Impacts on Income and Child Achievement Dependent Variables
Earning Supplement Programs Self Sufficiency Project British Columbia (n=2,131) New Brunswick (n=1,844) SSP Plus-New Brunswick (n=471) Connecticut's Jobs First (n=1,521) Work First Programs NEWWS LFA program Atlanta (n=860) Grand Rapids (n=425) Riverside (n=652) Los Angeles Jobs-First GAIN (n=169)
IV Model Results
Average Annual Log Average Annual Income Child Achievement Income (in $1,000s)
Effects of Income on Child Achievement
1.609 1.916 2.244 0.813
(0.327) (0.274) (0.455) (0.362)
0.212 -0.038 0.098 -1.047
(0.255) (0.405) (0.438) (0.884)
*** *** *** **
0.146 0.192 0.243 0.074
(0.031) (0.035) (0.071) (0.041)
0.041 -0.060 -0.008 -0.112
(0.028) (0.060) (0.072) (0.096)
*** *** *** *
0.112 0.125 0.061 0.032
(0.050) ** (0.054) ** (0.113) (0.054)
0.070 0.065 0.027 0.040
0.209 0.012 -0.001 0.000
(0.067) *** (0.076) (0.089) (0.157)
0.989 -0.312 -0.010 0.000
(0.034) ** (0.030) ** (0.052) (0.069)
(1.212) (3.925) (0.910) (0.150)
Effects of Log Income on Child Achievement
0.768 0.648 0.252 0.436
5.091 -0.196 0.116 -0.003
(0.375) ** (0.306) ** (0.491) (0.779)
(3.664) (1.278) (10.380) (1.405)
NOTES: Standard errors in parentheses. Means and standard deviations of each variable are as follows: average hours employed per quarter ( = 145.3, sd = 167.3); average quarters receiving any welfare ( = .747, sd = .321); average annual income ( = 11.0, sd = 5.2); log average annual income ( = 9.19, sd = .583); child achievement ( = .030, sd = .993). Economic variables are measured over study follow-up, child achievement is measured at time of follow-up. Separate regression equations are conducted for each study impact. The regressions also include the following covariates measured at baseline: child's age, earnings in the prior year, earnings in the prior year squared, amount of time mother was on welfare, employed in prior year, mother had no high school degree or equivalent, mother's marital status, number of children in the family, age of youngest child, mother's race/ethnicity, and whether parents' age was less than 18 at the time of child's birth; also included were the following additional covariates: elapsed time between study entry and follow-up, type of achievement report (e.g. parent or test/teacher, when applicable). *p < .10 **p < .05 ***p < .01 (two-tailed).
31
Table 3: 1st Stage Instrumental Variables Model Results Dependent Variables Average Annual Income (in $1,000s)
Log Average Annual Income
Average Quarters Receiving Any Welfare
Earning Supplement Programs Self Sufficiency Project British Columbia New Brunswick SSP Plus-New Brunswick Connecticut's Jobs First
1.59 2.01 2.44 0.78
(0.19) (0.20) (0.32) (0.23)
0.14 0.20 0.27 0.07
(0.02) (0.02) (0.04) (0.03)
-0.05 -0.14 -0.16 0.03
(0.01) (0.01) (0.02) (0.02)
Work First Programs NEWWS LFA program Atlanta Grand Rapids Riverside Los Angeles Jobs-First GAIN
0.17 0.10 0.29 -0.86
(0.31) (0.43) (0.38) (0.69)
0.03 -0.06 0.01 -0.11
(0.04) (0.05) (0.05) (0.08)
-0.02 -0.09 -0.06 0.00
(0.02) (0.03) *** (0.03) ** (0.05)
F (instruments) Model R-squared Model F Sample size
26.10 0.269 95.61 *** 8,073
*** *** *** ***
17.15 0.148 45.04 *** 8,073
*** *** *** **
23.32 0.171 53.53 *** 8,073
*** *** *** **
Average Hours Employed per Quarter
40.85 56.87 74.04 22.59
(6.35) (6.42) (10.53) (7.51)
*** *** *** ***
7.91 (10.05) 78.71 (14.19) *** 68.73 (12.55) *** -1.25 (22.52) 26.35 0.239 81.63 *** 8,073
NOTES: Standard errors in parentheses. Economic variables are measured over study follow-up. The regressions also include the following covariates measured at baseline: child's age, earnings in the prior year, earnings in the prior year squared, amount of time mother was on welfare, employed in prior year, mother had no high school degree or equivalent, mother's marital status, number of children in the family, age of youngest child, mother's race/ethnicity, and whether parents' age was less than 18 at the time of child's birth; also included were the following additional covariates: study site flags (e.g. NEWWS-Atlanta, NEWWS- Riverside, LA-GAIN, etc...), elapsed time between study entry and follow-up. *p < .10 **p < .05***p < .01 (two-tailed).
32
Table 4: OLS and Second-stage IV Estimates of the Effects of Endogenous Variables on Child Achievement Average Annual Income (1,000s) OLS IV Model 1 Income
Log Average Annual Income OLS IV
.004 (.003)
.060 *** (.019)
.000 (.024)
.611 *** (.201)
.000 (.003)
.062 * (.035)
-.015 (.028)
.539 * (.316)
Average Hours Employed per Quarter (in 100 hours)
.019 * (.011)
-.029 (.113)
.022 * (.011)
.014 (.109)
Average Quarters Receiving Any Welfare
-.092 * (.050)
-.128 (.638)
-.077 (.054)
-.065 (.670)
8,073
8,073
8,073
8,073
Model 2 Income
Sample size
NOTES: Standard errors in parentheses. Economic variables are measured over study follow-up. The regressions also include the following covariates measured at baseline: child's age, earnings in the prior year, earnings in the prior year squared, amount of time mother was on welfare, employed in prior year, mother had no high school degree or equivalent, mother's marital status, number of children in the family, age of youngest child, mother's race/ethnicity, and whether parents' age was less than 18 at the time of child's birth; also included were the following additional covariates: study site flags (e.g. NEWWS- Atlanta, NEWWS- Riverside, LA-GAIN, etc...), elapsed time between study entry and followup, type of achievement report (e.g. parent or test/teacher, when applicable). *p < .10. **p < .05. ***p < .01 (two-tailed).
33
Table 5: IV Results of the Effects of Income on Child Achievement by Outcome Measure a
Parent Report Average Log Annual Average Income Annual (1,000s) Income Model 1 Income only Model 2 Income controlling for employment & welfare Sample size
b
Test Score Average Log Annual Average Income Annual (1,000s) Income
.065 *** (0.025)
.652 ** (0.263)
.048 ** (0.023)
.499 ** (0.231)
.056 (0.171)
.153 (1.449)
.009 (0.057)
.140 (0.478)
4,280
4,280
3,549
3,549
NOTES: Standard errors in parentheses. The regressions include covariates measured at baseline as in analyses presented in Table 4. a Analyses include: Connecticut, LA-GAIN, SSP, and SSP Plus programs. b Analyses include: NEWWS , SSP, and SSP Plus programs. *p < .10 **p < .05 ***p < .01 (two-tailed).
34
Figure 1: Individual Study Impacts on Income and Child Achievement
.25
Impact on Child Achievement
.20 .15 .10 .05 .00 -1.5
-.5
-.05
.5
1.5
2.5
-.10 -.15 Impact on Annual Income (in $1,000s)
35