CBRE RESEARCH
Taxes, incentives, power costs and facility construction costs drive cost-effective site selection in U.S. markets
Site Selection Strategies for
Enterprise Data Centers
DECEMBER 2015
Executive Summary for 70.8% of the total project cost on average. Power costs and state and local net taxes (after incentives) account for 21.9%, and combined land acquisition and labor costs account for the remaining 7.3% of the total.
Enterprise data centers require significant capital investment to build, own and operate. Smart money will target markets with affordable power and land costs, low net taxes after incentives are applied, plentiful labor and inexpensive construction costs.
g
While low-cost markets are highly sought after for data center real estate, non-monetary considerations such as proximity to a company’s headquarters or other data centers, fiber density and environmental risk-factors can sway the ultimate decision.
g
A typical 5 megawatt (MW) enterprise project in the U.S. costs $270.1 million over a 10-year period. Potential savings of up to $140.9 million are available to site-selection savvy users.
g
The low cost markets for enterprise data centers are: Atlanta, GA; Charlotte, NC; Cheyenne, WY; Colorado Springs, CO; Des Moines, IA; Omaha, NE; Portland, OR; Quincy, WA; Salt Lake City, UT; and Tulsa, OK.
g
The optimal data center portfolio mix for mission critical users evolves over the life of a company or as technology advances. Enterprise data centers remain a component of mediumto-large web and media company’s data center portfolios — despite the increasing adoption of third-party colocation solutions (retail, wholesale and cloud-based).
g
IT hardware and facility construction costs are the most significant capital outlays in an enterprise data center project — accounting
g
Figure 1:
Lowest-Cost Markets by Key Cost Category
CONSTRUCTION
POWER
(1=lowest)
NET TAXES*
LAND
Tulsa, OK
Quincy, WA
1
Omaha, NE
Kansas City, MO
Charlotte, NC
Des Moines, IA
2
Portland, OR
Buffalo, NY
San Antonio, TX
Tulsa, OK
3
Cincinnati, OH
Tulsa, OK
Jacksonville, FL
Chicago, IL
4
Atlanta, GA
Omaha, NE
Dallas, TX
Colorado Springs, CO
5
Des Moines, IA
Kansas City, KS
Source: CBRE Data Center Solutions, CBRE Research, Q3 2015.
2
RANK #
*After available state and local taxes are applied.
Site Selection Strategies for Enterprise Data Centers | CBRE Research
Figure 2:
U.S. Enterprise Markets by Cost Segment Quincy
Portland Minneapolis Buffalo Cheyenne Omaha
Salt Lake City
Silicon Valley
Philadelphia
Chicago
Colorado Springs
Southern California
Northern New Jersey
Des Moines
Denver
Las Vegas
Boston
Kansas City
Kansas City
Tulsa
Cincinnati
Nashville
Phoenix
Northern Virginia
Charlotte
[ geographic region ]
[ average cost ]
West
$271.5 million
Central
$270.2 million
East
$268.7 million
Atlanta Dallas
[ regional cost segments ]
San Antonio
Jacksonville Houston
Low Moderate High
Source: CBRE Data Center Solutions, CBRE Research, Q3 2015.
Figure 3:
Distribution of Total Project Cost with IT Hardware 2.5% 4.9% 8.7% 36.0%
land staffing
13.2%
taxes power construction/facility IT hardware
34.8%
Source: CBRE Data Center Solutions, CBRE Research, Q3 2015.
© 2015 CBRE, Inc.
3
The Enterprise Data Center Solution The ever-increasing need for data exchange, storage and security is broadening demand for data centers in the U.S., but one solution does not fit all in the world of data center real estate. Optimal data center solutions are driven by the capacity and purpose of the mission critical requirement and tend to shift over the life of a company or along with technological advancements between retail and wholesale colocation, carrier hotels and enterprise facilities. For firms that have robust storage and application needs and desire a high level of control over their facility and data, enterprise data centers are a typical real estate solution. While web-based companies represent a majority of present-day enterprise builders, users of these facilities span
“
many industries and are not limited to technology and social media companies. Financial services, healthcare, insurance, government and telecom entities also use enterprise data centers; however, non-tech companies are increasingly migrating to third-party data centers. Technology and web-based companies are also using colocation data centers as an additional layer to their existing enterprise solutions, bolstering colocation demand. Momentum is generally building in the third-party colocation space given the significant initial capital investment to build an enterprise facility, an often lengthy build schedule and typical uncertainty in a company’s future IT platform needs. Access to capital and accounting/valuation preferences may also affect whether a company chooses colocation
For both enterprise and colocation data centers, capital and operating costs vary considerably by market.
“
4
Site Selection Strategies for Enterprise Data Centers | CBRE Research
or enterprise solutions. Further, modified enterprise solutions follow the build-to-suit model: the user partners with a builder to fund and construct the project, and then leases the site for a term of at least 10 years, typically. This allows the user to have a greater level of control in key decisions like location, design and schedule, without taking on the significant upfront capital expenses. Despite the trend toward colocation, enterprise solutions remain a key element in the data center industry. Non-monetary factors such as proximity to a headquarters location, fiber density and environmental and other risk factors can drive enterprise site selection decisions—although they are difficult to quantify and measure in relation to monetary costs. Enterprise facilities tend to have
critical loads of at least 5 MW, but critical loads for large users can exceed 50 MW.1 By comparison, wholesale and retail users of colocation data centers tend to have critical loads of less than 5 MW. For both enterprise and colocation data centers, capital and operating costs vary considerably by market. This study reveals how enterprise cost factors rank across 30 key U.S. markets. For insights into low-, moderate- and high-cost colocation markets—whose results differ materially from the enterprise banding results—refer to CBRE’s recent “Leasing a Data Center: U.S. Market Cost Comparison.”
1
Data center real estate is primarily measured in megawatts (MW) rather than sq. ft., reflecting the relative importance of power usage over physical space. Raised floor sq. ft. and building sq. ft. are secondary measurement benchmarks.
© 2015 CBRE, Inc.
5
Study Methodology This study modeled the cost of constructing, commissioning, and operating a 5 MW data center for 10 years across 30 U.S. markets. The markets are divided evenly into three cost bands (low, moderate and high). The 30 markets are either established or emerging markets for enterprise data center facilities, and the high-quality facility is considered a Tier III data center with N+1 redundancy.2 Key assumptions include 2% annual inflation, 80% annual operating capacity and a full critical load deployment at the onset of the operating period with no scheduled ramp-up. The initial IT hardware and two refresh costs are factored into the analysis, but are held constant across the markets. Service fees for facility and non-IT equipment maintenance are excluded from the analysis, as are software costs.
Cost factors that vary by market include: Land cost for an adequately-sized “shovelready” site with utilities;
g
Facility and construction costs for a highquality, redundant Tier III facility;
g
Sales, real estate and personal property taxes and available tax incentives;
g
Staffing costs for critical environment management and engineers to provide roundthe-clock coverage (security staff not included);
g
Power to operate and cool the facility; and
g
Optimal PUE (power usage effectiveness is a measure of a data center’s energy efficiency, which is affected by a market’s climate).
g
Glossary of Data Center Terms Carrier Hotels Single buildings with multiple fiber providers that generally support retail colocation providers. Wholesale Colocation Building shell and infrastructure to the power distribution unit providing space, power & cooling; generally in demised suites above 250 kilowatt (kW). Retail Colocation Building shell and infrastructure in shared environment, space generally divided by racks or cages; may include IT hardware as well as a menu of services. Enterprise Centers Hardened data center that houses “mission critical” operations of individual companies.
2
The Uptime Institute describes a Tier III facility as a concurrently maintainable facility with N+1 availability that allows for planned maintenance of power and cooling systems without disruption of the critical environment. The full definition of a Tier III facility can be found in the Uptime Institute’s Data Center Site Infrastructure Tier Standard: Topology, published in 2014.
6
Site Selection Strategies for Enterprise Data Centers | CBRE Research
Figure 4:
Site Selection Factors
[ power ]
[ tax incentives ] Sales tax refunds, real estate tax abatements and personal property tax exemptions
Cost per kilowatt hour, carbon footprint, fuel mix and infrastructure [ construction costs ] Availability of construction labor
[ climate ]
Environmental risk (i.e., hurricanes, tornadoes, earthquakes) and free cooling [ labor ] Availability of qualified engineers
[ taxes ]
Sales taxes on construction and IT equipment, real estate taxes and personal property taxes
[ telecom ] Fiber providers and latency
[ real estate ]
Secure location, availability, land acquisition cost or colocation lease payments [ geography ]
Proximity to headquarters or airports, population and market size, labor force, water availability
© 2015 CBRE, Inc.
7
The Big Picture Across the 30 markets, the average cost to build and operate a 5 MW data center over a 10-year period is $270.1 million. IT hardware and construction costs are nearly equal and together account for a combined 70.8% of the total project cost. Power costs are the next largest contributor at 13.2%, followed by net taxes (8.7%), staffing costs (4.9%) and land acquisition (2.5%). More broadly, capital expenses average 73.3% of the total project cost, compared to 26.7% for operating expenses.3 The total IT hardware outlay, not including associated taxes but including initial hardware expenses and two subsequent refreshes, amounts to 36% of the total project cost—or $97.3 million over the 10-year period. Most of the IT hardware expenditure comprises compute and network equipment, which account for 71.3% of the $97.3 million; the rest is storage equipment (23.9%) and structured cabling (4.8%). IT hardware costs are assumed to be constant across markets before sales taxes are considered. Among the factors influenced by markets, the primary cost contributors are facility construction costs, power rates and utilization, net taxes after available incentives, land acquisition costs and staffing.
Figure 5:
Distribution of Total IT Hardware Expenditure
4.8%
23.9% 30.8%
structured cabling network compute storage
40.5%
Source: CBRE Data Center Solutions, CBRE Research, Q3 2015.
3
Capital expenses include land acquisition, facility construction and IT expenditures. Operating expenses include state and local taxes after incentives, power costs and staffing outlays. NOTE: Percentage totals may not equal 100% due to rounding.
8
Site Selection Strategies for Enterprise Data Centers | CBRE Research
Figure 6:
Figure 7:
Distribution of Total Project Cost with IT Hardware
Distribution of Total Project Cost without IT Hardware
2.5%
3.9%
4.9% 8.7%
7.6%
land
36.0%
13.5%
staffing
13.2%
taxes power
54.4%
construction/facility IT hardware
20.6%
34.8%
Source: CBRE Data Center Solutions, CBRE Research, Q3 2015.
$270.1 million
average project cost over 10 years © 2015 CBRE, Inc.
9
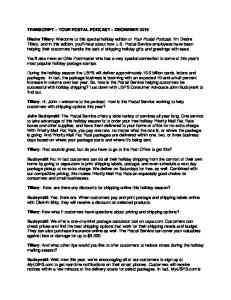
Figure 8:
Enterprise Cost Ranges by Factor average
low
high
LAND
$329,000
$6.7M
$33.7M
STAFFING
$12.7M
$13.2M
$14.6M
TAXES
$0.0
$23.4M
$95.6M
POWER
$15.7M
$35.6M
$71.9M
$80.0M
$94.3M
$116.3M
$227.5M
$270.1M
$370.0M
FACILITY
CONSTRUCTION
TOTAL
PROJECT COST
Source: CBRE Data Center Solutions, CBRE Research, Q3 2015. NOTE: Tax burdens reflect available state and local tax incentives.
Figure 9:
Cost Factor Variance In addition to a factor’s overall contribution to the total project cost, its statistical variance is an important consideration in how the markets settle into the three cost bands. Among the cost factors, land acquisition costs vary most widely across markets, followed by net taxes and power costs and then staffing and construction costs. Still, the comparatively small variance in facility construction costs, which represent a significant share of the total project cost, have the potential to push a market from the moderate-cost segment into the high-cost segment. The analysis also shows that otherwise-low-cost markets jump to the moderate category mostly due to power expenditures and, to a lesser degree, taxes and construction expenses. Otherwise-moderate-cost markets are most influenced by tax expenditures, and by construction and land expenses to lesser degrees.
2.0
1.5
1.0
0.5
0.0
LAND
TAXES
POWER
CONSTRUCTION
STAFFING
Source: CBRE Data Center Solutions, CBRE Research, Q3 2015.
10
Site Selection Strategies for Enterprise Data Centers | CBRE Research
A Closer Look at Key Cost Factors The cost elements that contribute heavily to an enterprise data center project cost and that vary a great deal among markets—net taxes, facility construction, power, land acquisition and staffing —are the key considerations in enterprise site selection decisions.
© 2015 CBRE, Inc.
11
Data centers are capital intensive and generate significant sales and property tax revenues for state and local jurisdictions. Increasingly, markets that seek to attract data centers are offering significant tax incentives to help reduce the total cost of operations for data centers. Only four of the 30 enterprise markets in this study do not offer tax incentives to enterprise data centers. These markets also rank in the high-cost segment.
Taxes and Incentives
12
Net tax costs include sales taxes on equipment and construction materials, real estate taxes, personal property taxes and available incentives. On average across the 30 markets, net taxes account for 8.7% of the total project cost (or $23.4 million) over the 10 years. The analysis also suggests that incentives reduce a data center’s total 10-year tax burden by about 52.2%. The addition of software costs, which are excluded in this analysis, would amplify the savings from some tax incentives. Tax incentives can have notable implications for a market’s cost competitiveness. In Des Moines, for example, tax incentives provide a total savings of $32.5 million over the 10-year period, reducing taxes’ share of the total cost from 16.0% to 4.3%. Tax incentives are the primary variable that shifts Des Moines from a moderate-cost market to a low-cost market. Meanwhile, Omaha is a special exception to the norm when it comes to taxes. The tax burden for enterprise data centers in Omaha is likely $0 over a 10-year period, given Nebraska’s aggressive incentives policies. On the other end of the spectrum is Chicago, with the highest tax burden among the 30 markets. Chicago’s light incentives offerings do not go far enough to lower the total tax burden for data centers, largely due to its high rates of sales tax (9.25%) and real estate tax (7.5%).
Site Selection Strategies for Enterprise Data Centers | CBRE Research
Figure 10:
Net Tax Burden* as a Share of Total Project Cost Omaha, NE 0.0% 2.7%
Portland, OR
3.4%
Cincinnati, OH
3.8%
Atlanta, GA
4.3%
Des Moines, IA
5.0%
Cheyenne, WY
5.4%
Las Vegas, NV
5.9%
Buffalo, NY Kansas City, MO
6.6%
Kansas City, KS
6.6%
Charlotte, NC
6.7%
Colorado Springs, CO
7.0%
Tulsa, OK
7.0%
Northern Virginia
7.2%
Salt Lake City, UT
7.3%
Quincy, WA
8.5%
Nashville, TN
8.5%
Southern California
8.5%
Denver, CO
8.7%
Average of 30 Markets
8.7%
Minneapolis, MN
9.0%
Jacksonville, FL
9.0%
Silicon Valley, CA
9.2%
Philadelphia, PA
9.3% 9.7%
Phoenix, AZ
10.5%
Boston, MA San Antonio, TX
12.8%
Northern New Jersey
12.9%
Dallas, TX
12.9%
Houston, TX
12.9% 25.9%
Chicago, IL 0%
5%
10%
15%
20%
25%
30%
Source: CBRE Data Center Solutions, CBRE Research, Q3 2015. *Net tax burden is state and local taxes due after available incentives are applied.
© 2015 CBRE, Inc.
13
Figure 11:
Tax Burdens and Incentives Savings by Market net taxes
Omaha, NE
tax savings from incentives
Portland, OR Cincinnati, OH Atlanta, GA Des Moines, IA Cheyenne, WY Las Vegas, NV Buffalo, NY Charlotte, NC Tulsa, OK Colorado Springs, CO Kansas City, MO Kansas City, KS Salt Lake City, UT Northern Virginia Quincy, WA Nashville, TN Jacksonville, FL Denver, CO Minneapolis, MN Phoenix, AZ Philadelphia, PA Southern California Silicon Valley, CA San Antonio, TX Boston, MA Dallas, TX Houston, TX Northern New Jersey Chicago, IL 0
20
40
60
80
100
120
Taxes ($, millions)
Source: CBRE Data Center Solutions, CBRE Research, Q3 2015.
14
Site Selection Strategies for Enterprise Data Centers | CBRE Research
“
Data centers are capital intensive and typically generate significant sales and property tax revenues for state and local jurisdictions.
“
© 2015 CBRE, Inc.
15
Power expenditures are a function of power rates, 80% constant utilization and market-specific PUE. Power costs average 13.2% of the total project cost over the life of the project, but vary from 6.5% in Quincy, WA, to 21.3% in Boston. In Quincy, electric power is supplied by two hydroelectric dams that produce renewable power at a highly competitive rate.
Power
16
Increasingly, data center clients are evaluating the power source along with the cost of power. Thus, the low cost of power and its renewable source make Quincy an attractive market for users who can tolerate the associated reliability challenges. Quincy, Des Moines and Tulsa enjoy the lowest power rates among our set of markets. The most expensive power rates are in Boston, Southern California and Silicon Valley.
Site Selection Strategies for Enterprise Data Centers | CBRE Research
A cy, W n i u Q 5% . 6
Figure 12:
Power Costs as a Share of Total Project Cost es, IA
, IL
go hica
oin Des M
C 1% 7.
%
8.9
rsey
w Je rn Ne
, CO prings S o d a Color %
e North 9.8% , NY Buffalo % 9
10.
OK Tulsa,
2%
10.
K
12.0%
Cheyenne, WY 13.2%
12.1%
Charlotte, NC
%
Minneapolis,
13.3%
Phoenix, AZ 14.0%
MN
nville, FL Nashville, TN Jackso 13.5%
13.4%
Kansas City, KS
San Antonio, TX
Las Vegas, NV 15.7%
Houston, TX
Philadelphia, PA
13.7%
13.7%
Silicon Valley, CA 14.9%
14.5%
14.3%
Cincinnati, OH
12.9%
12.7%
30 Markets Average of % 13.2
13.3%
A
Atlanta, G
ginia Northern Vir
12.6%
Dallas, TX
%
11.9
11.3
O ansas City, M
Omaha, NE
R nd, O
Portla
ity, UT lt Lake C
Sa
9
10.
Denver, CO 15.9%
17.0%
Southern
Californ 19.3% ia
Boston
,
21.3 MA %
Source: CBRE Data Center Solutions, CBRE Research, Q3 2015. © 2015 CBRE, Inc.
17
Tier III data center facilities are more expensive to build than Tier I and II facilities because of their higher redundancy levels.4 Enterprise users tend to build to a higher cost and quality standard in order to save on longer-term operating expenses with an optimal PUE. That said, many of the large builders of web and media facilities are building to a lower redundancy level, at costs far lower than those for the more robust facilities detailed in this study. Owners and operators typically strive for energy efficiency within a structurally secure facility that is reliable and concurrently maintainable.
Construction
Facility construction costs represent about 35% of the total project cost over the 10-year period, averaging $94.0 million and ranging from $77.5 million to $116.3 million. The construction cost component varies less than other factors such as land and net taxes. The most expensive markets in which to build a Tier III facility are generally large, more populous markets like Boston, Silicon Valley, Chicago, Philadelphia and Northern New Jersey. Facility construction was least expensive in Tulsa, Charlotte, San Antonio, Jacksonville and Dallas.
4
The Uptime Institute’s full definitions of data center tiers can be found in its Data Center Site Infrastructure Tier Standard: Topology, published in 2014.
18
Site Selection Strategies for Enterprise Data Centers | CBRE Research
Figure 13:
Facility Construction Costs as a Share of Total Project Cost Southern California Houston, TX San Antonio, TX Dallas, TX
29.4% 29.8% 29.8% 29.9%
Chicago, IL 31.2%
Las Vegas, NV Denver, CO Charlotte, NC Silicon Valley, CA Phoenix, AZ Boston, MA Colorado Springs, CO Cheyenne, WY
34.3% 34.4% 34.6% 34.7%
33.1% 33.2% 33.4% 33.7%
Nashville, TN Average of 30 Markets Kansas City, MO Kansas City, KS
34.8% 34.8% 34.9% 34.9%
Jacksonville, FL 35.7% Northern Virginia Buffalo, NY Cincinnati, OH Atlanta, GA
36.0% 36.0% 36.1% 36.9%
Salt Lake City, UT 37.3% Northern New Jersey 37.6%
Philadelphia, PA Quincy, WA Minneapolis, MN Des Moines, IA
38.1% 38.1% 38.2% 38.8%
Portland, OR 39.3% Omaha, NE 39.4% Source: CBRE Data Center Solutions, CBRE Research, Q3 2015. © 2015 CBRE, Inc.
Tulsa, OK 40.1% 19
Land
20
Land acquisition for greenfield development represents the smallest expense component in the analysis on average ($6.7 million, or 2.5% of the total project cost), but the cost of an adequately sized shovelready site varies most among all the cost factors. The $33.4 million price differential between the high- and low-cost markets suggests that prudent site selection efforts should not overlook the land acquisition component. The land cost was most expensive in the densely populated markets of Southern California, Silicon Valley and Chicago; land was least expensive in Kansas City, MO; Buffalo and Tulsa. Across the 30 markets the average price per sq. ft. was $7.65, but ranged from less than $1.00 per sq. ft. to $38.72 per sq. ft.
Site Selection Strategies for Enterprise Data Centers | CBRE Research
Figure 14:
Land Costs as a Share of Total Project Cost
Minneapolis, MN
1.1%
Northern Virginia 3.1%
Atlanta, GA
1.3%
San Antonio, TX 3.3%
Philadelphia, PA
1.4%
Northern New Jersey
1.4%
Jacksonville, FL
1.6%
Kansas City, MO
0.1%
Denver, CO
1.7%
Buffalo, NY
0.2%
Salt Lake City, UT
1.8%
Tulsa, OK
0.4%
Las Vegas, NV
1.8%
Kansas City, KS
0.4%
Portland, OR
1.8%
Omaha, NE
0.4%
Quincy, WA
0.4%
Cincinnati, OH
0.5%
Des Moines, IA
0.7%
Charlotte, NC
0.7%
Boston, MA
0.8%
Cheyenne, WY
0.9%
Nashville, TN 3.8%
Dallas, TX
4.0%
Houston, TX
4.4%
Chicago, IL 5.5% Colorado Springs, CO 2.1% Phoenix, AZ 2.2% Average of 30 Markets 2.5%
Silicon Valley, CA 9.6% Southern California 9.9%
Source: CBRE Data Center Solutions, CBRE Research, Q3 2015.
© 2015 CBRE, Inc.
21
Staffing
22
With a need for critical environment engineers that provide round-the-clock coverage, labor costs average $13.2 million over the 10 years in our study, but costs range by $1.9 million among our 30 locations, based on market-rate wages. Not including security staff, labor costs account for an average of 4.9% of the total project cost. Market-rate labor costs are the lowest in the Central region, highest in Northern New Jersey and Boston, and above-average in Philadelphia, Chicago, Houston, Dallas, Cheyenne, Quincy, Silicon Valley and Southern California. While labor costs rank relatively low among our factors, it is important to also consider the availability of engineering staff and construction labor—particularly in less-developed and low-cost markets where the available talent pool is limited. Labor availability for both building and staffing can present challenges for high-end, large-scale data centers.
Site Selection Strategies for Enterprise Data Centers | CBRE Research
Figure 15:
Labor Costs as a Share of Total Project Cost
7 4.
1%
4.3%
WY
%
3
WA
IL go,
Che y e n ne,
Qui
nc 5. y, 8
% .8
4.
Omah a, N E Tulsa, OK
5.6 %
CA alley, V n o a Silic liforni a C n ther Sou 1%
Des Moines, IA
5.5%
Boston, MA
4.5%
5.3%
tte, NC Charlo
Minneapol is, MN
4.6 %
n Atla 2% 5.
ega s, N Den V ver, CO
P
A a, P i h p del % hila
rthern N ew Je rsey Dallas , T y Cit , M s a O s n X a K Norther n Virg inia ansas City, KS K B u Z f A f alo, N nix, Y Phoe ston, TX u o H C i n N c T i n , n e ati, O vill H Nash 4.9% 5 . 0 Port % % 4.8 lan d, O Average of 30 Markets 5. R
, CO ings Spr do , UT City ora ke Col t La ta, GA Sal
San Anto nio, Las TX V
Jackson ville, FL No
Chi ca
Source: CBRE Data Center Solutions, CBRE Research, Q3 2015.
© 2015 CBRE, Inc.
23
Market Rankings Enterprise data center decision-makers face a cost differential of $140.9 million between the highestcost and lowest-cost markets, which represents 52.1% of the $270.1 million average project cost. Thorough due diligence in identifying markets that meet the user’s business requirements and provide lower net tax burdens after incentives, relatively affordable power rates, accommodative climates, and greenfield space to build in a less expensive manner has the potential to meaningfully preserve capital.
populations between 1.0 and 3.0 million, and nine of the 10 markets with populations smaller than 1.0 million are low-cost markets.
The study revealed a positive relationship between the size of a market’s population and its cost segment: the more populous markets tend to fall in the moderate- or high-cost segments. In fact, all of the moderate- and high-cost markets have populations greater than 1.0 million, and six of the 10 high-cost markets have populations exceeding 3.0 million.5 Eight of the 10 moderate-cost markets have
Several markets are within close range of an adjacent cost segment. There is a $4.6 million difference between the highest low-cost market and the lowest moderate-cost market, and a $776,000 difference between the highest moderate-cost market and the lowest high-cost market.
The regional average costs (West, Central and East) range by only $2.8 million, or about 1% of the total project. The West has the highest average cost, at $271.5 million, and the East has the lowest, at $268.7 million. Markets in the Central region average $270.2 million.
5
Population data are 2014 estimates from the U.S. Census Bureau at the metropolitan statistical level.
Figure 16:
U.S. Enterprise Markets by Cost Segment (alphabetical order) Low-Cost $227.5M – $248.3M
Moderate Cost $252.9M – $275.8M
High Cost $276.6M – $368.4M
Atlanta, GA
Buffalo, NY
Boston, MA
Charlotte, NC
Cincinnati, OH
Chicago, IL
Cheyenne, WY
Denver, CO
Dallas, TX
Colorado Springs, CO
Jacksonville, FL
Houston, TX
Des Moines, IA
Kansas City, KS
Minneapolis, MN
Omaha, NE
Kansas City, MO
Northern New Jersey
Portland, OR
Las Vegas, NV
Philadelphia, PA
Quincy, WA
Nashville, TN
San Antonio, TX
Salt Lake City, UT
Northern Virginia
Silicon Valley, CA
Tulsa, OK
Phoenix, AZ
Southern California
Source: CBRE Data Center Solutions, CBRE Research, Q3 2015.
24
Site Selection Strategies for Enterprise Data Centers | CBRE Research
Results: Colocation vs. Enterprise Third-party data center solutions are gaining momentum over enterprise solutions in the marketplace, with both web-based technology firms and non-technology firms electing to avoid the hefty upfront capital outlays necessary to construct facilities. Third-party solutions also provide flexibility and scalability in fulfilling uncertain and evolving future IT needs. Given the fluidity between colocation and enterprise solutions, decisionmakers are considering multiple scenarios as they determine their company’s optimal data center solution and portfolio. Our 2014 colocation analysis of a seven-year 1-MW requirement ranked 23 U.S. markets and uncovered a $12 million difference between the high- and low-cost markets and an average total project cost of $45.9 million. Like the enterprise study, the colocation results were driven by power costs and personal property or IT equipment taxes, but also by lease rates that accounted for nearly two-thirds of the total project costs (excluding IT equipment). The enterprise study does not factor in lease payments since the owner and user of these facilities are one and the same, but it adds taxes related to owning the facility, labor costs for building engineers, land acquisition fees and facility construction costs. In spite of the fundamental differences in methodology and the limitations in line-item comparisons, our review of the two studies suggests the following: Enterprise users contend with a larger range of total project cost; the high-to-low cost range represents 52.7% of the average enterprise total project cost, versus 26.1% for the colocation project.
g
High-cost colocation markets can be low-cost enterprise markets, and vice versa. For example,
g
© 2015 CBRE, Inc.
Omaha and Des Moines are high-cost colocation markets but low-cost enterprise markets. Dallas and Houston are low-cost colocation markets and high-cost enterprise markets. Several markets fell into the same cost category in both studies. Atlanta, Colorado Springs and Salt Lake City are low-cost markets for both types of data center. Denver and Las Vegas hold consistently moderate rankings, and Boston, Chicago and Philadelphia are high-cost markets in both studies.
g
The average cost of 1 MW is $6.6 million per year for a colocation user but $5.4 million for an enterprise user—underscoring the economies of scale available to larger enterprise users whose requirement is constant and unchanged over 10 years.
g
The West is the high-cost region under the enterprise scenario but the low-cost region under the colocation scenario. The East was the high-cost region in the colocation scenario and the low-cost region in the enterprise scenario. The Central region held in the middle position in both.
g
total project cost
$45.9M
$270.1M
$6.6M
$5.4M
colocation
colocation cost/year/MW
enterprise
enterprise cost/year/MW
25
For more information about this report or CBRE Research: Spencer G. Levy Americas Head of Research +1 617 912 5236
[email protected] Follow Spencer on Twitter: @SpencerGLevy Jessica Ostermick Director, Research and Analysis +1 720 528 6338
[email protected] Follow Jessica on Twitter: @jessostermick Jeff West Director, Data Center Research and Analysis +1 503 221 4806
[email protected]
For more information about CBRE Data Center Solutions: Pat Lynch Managing Director Data Center Solutions +1 303 628 1765
[email protected] Follow Pat on Twitter: @cbredatacenters Jeremy Meyers Business Development Analyst Data Center Solutions +1 303 628 1788
[email protected] John Lenio Senior Vice President/Economist Location Incentives +1 602 735 5514
[email protected] www.cbre.com/datacenter View our Enterprise Data Center video here