Comparing Underwater MAC Protocols in Real Sea Experiment Lina Pu∗ , Yu Luo∗ , Haining Mo∗ , Zheng Peng∗ , Jun-Hong Cui∗ , Zaihan Jiang† ∗ Computer
Science & Engineering Department, University of Connecticut, Storrs, CT 06029 Email: {lina.pu, yu.luo, haining.mo, zhengpeng, jcui}@engr.uconn.edu † Acoustic Division, US Naval Research Laboratory, Washingto, DC 20375
Abstract—Underwater acoustic networks (UANs) have drawn significant attention from both academia and industry in recent years. Even though many underwater MAC protocols have been proposed and studied based on simulations and theoretical analysis, few work has been conducted to test and evaluate these protocols in a multi-hop real sea experiment. Due to the harsh acoustic channel condition caused by complex multi-path environment, fast varying acoustic channel and heterogenous channel quality, current simulators can hardly tell us how the protocols work in the real world. Along this direction, we conduced real sea experiments at Atlantic Ocean with 9 nodes deployed forming a multi-hop string network. In this experiment, the performance of three representative MAC protocols, random access based UW-Aloha, handshaking based SASHA, and scheduling based pipelined transmission MAC (PTMAC) are compared and analyzed at both packet behavior and node behavior levels. The end-to-end performance of these three protocols are also tested and studied in terms of throughput, delay, and packet delivery ratio. From field experiment results, the high packet loss rate and significant channel asymmetry, temporal and spatial transmission range uncertainty and delayed data transmissions are discovered to have evidential effects on the MAC performance. We provide some inspirations to address these observed issues in MAC design for real multi-hop networks.
I. I NTRODUCTION In recent years, Underwater Acoustic Network (UAN) has emerged as a very active research area due to its widespread applications ranging from scientific exploration to coastline protection [1]–[4]. Due to the significant difference between UANs and Terrestrial Wireless Networks (TWNs) imposed by underwater communication channels and acoustic modems, most protocols and research conclusions dedicated to TWNs can not be directly applied to underwater networks. To date, significant efforts have been devoted to underwater MAC protocol design to overcome the adverse effects incurred by the harsh underwater environments. The authors in [5] studied Aloha based protocols in single hop underwater networks. An adaptive propagation delay tolerant collision avoidance protocol (APCAP) was designed in [6] to mitigate the long propagation delay problem in UANs. In order to deal with the long propagation delays, the authors in [7] and [8] designed scheduling based ST-MAC and CT-MAC for UANs which both gave a comprehensive performance study via simulations. The aforementioned works are mostly based on theoretical analysis and simulations. Although some well-known features of UANs including the long propagation delay and low data rate have been taken into account when designing these MAC protocols, the performance of the proposed methods and the
conclusions drawn in these works have not been verified by real world field tests. Currently, the UAN simulators have limited capability to simulate and verify MAC protocols since they cannot completely reflect the highly dynamic and harsh underwater acoustic channels. Beyond that, there could be some unknown facts to the simulators that can only be revealed in real world sea tests. Taking into consideration the limitations with simulators, there has been some work in the testbed design [9], [10] and studying underwater MAC protocols in real sea experiments [11], [12]. The work in [11] has uncovered the significant preamble length in acoustic modems and its adverse effect to MAC protocols with small control packets. In [12], the authors conducted sea tests to evaluate the performance of three MAC protocols including CSMA, T-Lohi and DACAP in terms of throughput efficiency and packet latency in static multi-hop and mobile single-hop networks. These works have exposed some important facts which can only be observed in the field tests. Also they have given researchers some ideas on the underwater MAC performance in the real world environments. The grand challenges facing in underwater MAC protocol design include but not limited to the long propagation delay, the limited bandwidth and the long preamble in acoustic modems. There is still much to explore regarding the real system features and their impact on MAC performance. Along this direction, we compared three representative protocols, namely random access based UW-Aloha [9], handshaking based SASHA (selective ARQ with slotted handshaking-based access) [13] and scheduling based PTMAC (pipelined transmission MAC) [14], in a real world sea experiment. The experiment was a multi-hop network test led by the Naval Research Lab. It was carried out in a strip area about 120 km off New Jersey shore, from September 6 to September 10, 2012. We deployed a maximum of 9 UAN nodes with Teledyne Benthos modems [15] 30 m below the sea surface, forming a 8-hop string network. The average distance between two adjacent modems is 1 km. In this experiment, we tested three representative protocols in the string network with packets delivered from one end to the other. Varied network scales and packet generation rates were tested to study the performance of protocols in different scenarios. According to the experiment results, we observed several phenomena that have direct influence on MAC protocols, including 1) high packet loss rate and significant channel
asymmetry, 2) spatial and temporal communication range uncertainty and 3) delayed data transmission caused by the busy terminal problem of acoustic modems. The impact of each phenomenon on the performing of different MAC protocols are studied in this paper. We also analyze how three representative protocols work in the real world with different experiment settings. A multi-scale comparison of protocol performance is conducted, from packet and node behavior to system performance on throughput, delay, deliver ratio and energy efficiency metrics. Based on the field observations and result analysis, we provide suggestions on future MAC design in real systems. The rest of paper is organized as follows. In Section II, we briefly introduce three representative underwater MAC protocols tested in our experiment. Section III presents the detail settings of sea test. We discuss the observed phenomena that are closely related to MAC protocols in Section IV and analyze field results in Section V. Following the experiment result analysis, we discuss the impact of observed features on general MAC protocols and provide some inspirations to new protocol design in Section VI. We conclude the paper in Section VII.
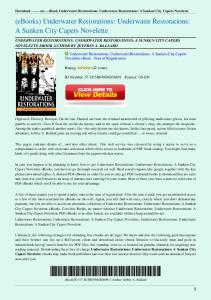
Figure 1.
Work flow of random access base UW-Aloha [9].
II. T ESTED MAC P ROTOCOLS Owing to different data transmission mechanisms, random access, handshaking based, and scheduling based protocols have distinctive performance on throughput, delay or energy efficiency. In this work, we test and evaluate UW-Aloha, SASHA and PTMAC MAC as representative protocols from these three categories. In the remaining of this section, we give a brief introduction to these three MAC protocols.
Figure 2.
Timing of handshaking based SASHA.
A. Random Access based UW-Aloha UW-Aloha [9] is a random access MAC protocol based on the classic Aloha. The new features of automatic repeatrequest (ARQ) and back-off schemes are employed to improve the performance of classic Aloha in UANs. Due to the long propagation delay in the underwater environment, collisions cannot be sensed immediately by listening to the channel as what can be done in TWNs. Therefore, UW-Aloha incorporates acknowledgment (ACK) to explicitly informs the sender whether the transmission is successful or not. Fig. 1 shows the work flow of UW-Aloha. A sender randomly transmits packets without reservation or negotiation with other senders. UW-Aloha works based on stop-and-wait scheme. No outgoing data packets are processed when the sender is waiting for acknowledgment. If the sender cannot receive an ACK in time, it means either the data or the ACK is lost due to collisions or link errors. The sender will back-off before retransmitting the data packet. The back-off mechanism is to slow down the packet transmission when collision occurs at high network traffic rates. Otherwise, the sender will start to prepare for new data transmission after an ACK reception. B. Handshaking based SASHA SASHA [13] is a hybrid approach of selective ARQ and slotted handshaking access, the timing of which is shown in
Fig 2. The data transmission in SASHA is competed with RTS (request to send) packet, containing the time to reserve for data transmission. The handshaking process completes after the source receives CTS (clear to send) packet from the destination and the data sending process follows afterwards. Any other node overhearing RTS or CTS will refrain from sending data for the reserved time. Similar to slotted-FAMA, SASHA always sends packets at the beginning of time slots to reduce the chance for collisions. The slot length equals to the sum of transmission duration (in seconds) of RTS/CTS, maximum propagation delay within one-hop transmission range and some guard time. The long preambles in acoustic modems significantly increase the overhead of handshaking process [11]. In order to mitigate this negative effect, SASHA employs packet train and selective ARQ for data transmissions. After each successful negotiation, the sender pushes multiple available packets in a train to reduce the average overhead and to improve the channel utilization. If any packet gets lost, the receiver will inform the sender with a negative acknowledgment (NACK), asking the sender to retransmit the lost packets. HDR packet in Fig 2 is to inform adjacent nodes of the following data packet retransmission. This procedure will continue until an ACK is received by the sender, which will release the channel.
Figure 3.
Timing of scheduling based PTMAC.
C. Scheduling based PTMAC PTMAC [14] is a scheduling based MAC protocol with time division frame structure. The new feature of pipelined MAC is the pipelined data transmission tailored for multi-hop string networks. Each node in the network is pre-assigned a time slot for data transmission. After one data transmission, the node keeps silent for the next two time slots and passes the sending opportunity to the succeeding node. The data gets delivered in a pipelined way along a multi-hop path. PTMAC has parallel transmission feature. Nodes with three hops distance in PTMAC are scheduled to transmit simultaneously. However, adjacent nodes and nodes two hops away have staggered time slots. Otherwise, sending-receiving or receiving-receiving collisions will happen if packet duration time is not less than the propagation delay, which is generally true in most underwater networks. III. F IELD E XPERIMENT In the Atlantic Ocean experiment, we tested three representative MAC protocols in a multi-hop string network. The test lasted for 5 days from September 6 to September 10, 2012, for modem deployment, recovery and protocol tests. We deployed a maximum of 9 UAN nodes equipped with Teledyne Benthos modems, forming a string topology in the target region. The coordinates of nine nodes are shown in Fig. 4. The strip area of this experiment was about 120 km off New Jersey shore with average water depth of 80 m. The acoustic modems were deployed about 30 meters below the sea surface. The weather was rated from moderate to rough during the experiment with wave heights between 1.25 and 2.5 m. The acoustic modems we used in the test are commercial Teledyne-Benthos ATM-885 series. The average distance between neighbor nodes is about 1 km, as shown in Fig. 4. Due to the harsh underwater channel conditions, we had to drag the modems around to achieve a reliable communication at each link. Even so, we still observed significant packet losses during the experiment, which will be discussed in Section IV in details. The horizonal distance between two end-nodes was about 7.3 km. In most of time, Benthos modems ran at lowest transmission power, since we wanted every modem to communicate only to its direct neighbors in order to form a 8 hop network. The power level and distance settings were verified to be appropriate considering the acoustic channel quality at that time, which is shown in Table II. However, transmission range of modems varied significantly due to the dynamic acoustic channel condition. So the multi-hop network was virtually formed by discarding packets that reached undestined nodes.
Figure 4.
Deployment of Atlantic sea test.
The acoustic modems operated at frequency band of 16−21 kHz. The maximum provided baud rate is 15, 360 bps. However, due to the bad link quality the modems communicated at 600 bps or even 300 bps. According to our previous experiment results [11], a 1.2 seconds preamble is embedded into all outgoing packets by this series of modems. The packet duration time becomes a sum of the preamble length and data part transmission delay. This means the packet length is no shorter than 1.2 seconds even for RTS/CTS/ACK packets with only a few bits at data section. Two end-nodes played as the source and the sink respectively. Each node in the network ran Aqua-Net framework1 independently with all three MAC protocols implemented. Same dummy protocols on upper layers were used for all sea trials to eliminate the impact from upper layer protocols. A Poisson traffic generator was implemented at the source node. The network traffic load was adjusted by controlling the data generation rate, which varied from 8 bps to 40 bps in our experiment. We did not try higher traffic rates because of the low network capacity. Superfluous packets would get no chance to be processed but queued by the source if we set a higher traffic rate. This is because long propagation delays and the low baud rate of acoustic modems in real sea experiment make it extremely slow to get one packet successfully delivered to the sink node. Three representative MAC protocols were tested with different network and traffic settings as listed in Table I. The tested results are discussed in Section V. IV. F IELD O BSERVATIONS Before embarking on a discussion of how MAC protocols perform in real world, it is crucial to first understand the real 1 Aqua-Net framework [9] is a layered architecture for real UAN systems compatible to various existing acoustic modems, including Teledyne Benthos Modems, WHOI Micro Modems and AquaSeNT OFDM Modems.
Table I T RAFFIC GENERATION RATES IN DIFFERENT SCENARIOS .
0.9 Forward Link Backward Link
0.8
5-Hop
8-Hop
0.7
Network
Network
UW-Aloha
0.6
−
−
8 bps
SASHA
12 bps
−
8 bps
8 bps
8 bps
24 bps, PTMAC
30 bps,
Loss Rate
4-Hop ProtocolPP P Network
PP P
0.5 0.4 0.3
40 bps
0.2 0.1 0
system features that can affect MAC protocol performance. Several channel and modem features that have close impact on underwater MAC protocols are visioned in our field experiments: (1) high packet loss rate and significant channel asymmetry, (2) spatial and temporal communication range uncertainty and (3) delayed data transmissions caused by the busy terminal problem of acoustic modems. In the rest of this section, we introduce three observations in details with experiment results. A. High Packet Loss Rate and Significant Channel Asymmetry Due to the geometric spreading in propagation and the severe absorption of acoustic signals in water, the high error rate in underwater communications is a well understood fact in the research community. However, our field results have revealed much severer packet error rates than we expected. We calculated the fraction of lost packets on different links and displayed the result in Fig. 5. In the test, 9 nodes were deployed in a line as illustrated in Fig. 4. We let 7 intermediate nodes take turns to send data and record the ratio of packets not received by the receivers 1 km away at both ends. As shown in Fig. 5, the link loss rate was not only high but also varied significantly among different links. Good links had less than 10% loss rate in our observation, compared with almost 80% packet loss with bad channels. Here Fig. 5 came from a random chosen test. Even though packet loss rates were not exactly the same among other tests, similar results were observed. In our experiments, we also observed significant channel asymmetry in terms of packet loss rate. By channel asymmetry, we mean varied packet loss rates when packets travel in different directions. Taking the network in Fig. 4 as an example, we call the links for southern directional communication as forward links and the reverse links as backward links. In Fig. 5, the forward and backward links for node N 7’s transmission got comparable communication quality in this experiment. However, the forward links suffered 2 − 5 times severer packet losses than the backward links when N 1 to N 4 were sending. On the other side, the forward links for N 5 and N 6 had better reliability than the reverse links. This channel asymmetry means that packets traveling in different directions can suffer from dramatically different packet loss rates, and therefore brings troubles to MAC protocols relying on explicit acknowledgment or two-way handshaking as both
1
Figure 5.
2
3 4 Node ID
5
6
7
Packet loss rates on different links.
mechanisms assume homogenous channel quality across the network. B. Communication Range Uncertainty Under a combined impact of the broadcast nature of acoustic signal and the unstable underwater channel quality, the network communication range demonstrates uncertainty both spatially and temporally. Communication range in this paper is not the farthest distance that the signal can reach, but the range within which receivers can communicate with the sender relatively reliably. It is closely related to the transmission power of acoustic signal, distance, underwater channel quality and local noise level at the receiving point. We are going to investigate both spatial and temporal uncertainty with regard to transmission range. In this paper, we define the transmission range of a node to be the distance (in hops) between itself and the farthest node it can reach with a data reception ratio no lower than 1/3. Although 1/3 seems to be a low reception ratio, given the high packet loss rate we observed, it is actually a relatively decent one. Another reason why we choose 1/3 as the threshold is that UW-Aloha allows a maximum of 3 retransmissions for a data packet. Therefore, 1/3 means a data packet can be received by a receiver in UW-Aloha within maximum retransmission attempts. Table II lists the successful reception ratios at nodes with different distances when N 1 to N 9 sent respectively. We classify the reception ratios into three categories. The black bold ones are the reception ratios no lower than 1/3 between two adjacent nodes, which means a node gets at least one hop communication range. The blue ones are the reception ratios no lower than 1/3 between two nodes which are two hops or further away. This indicates a node can receive data packets reliably from a node further away than two hops. In another word, the black ones represent a reasonable reliability while the blue ones stand for an over high reliability. The red ones are the reception ratios lower than 1/3 between two adjacent nodes, which means a low reliability. Based on this reception ratio table, we can derive the communication range of each individual node between N 1 and N 9.
Table II PACKET DELIVER RATIO ALONG THE PATH (Bold black - reliable one-hop communication, Bold blue - reliable multi-hop communication, Red - unreliable one-hop communication).
XX XX Sender ID XXX X N1 (%)
Successful Reception Ratio N2 (%)
N3 (%)
N4 (%)
N5 (%)
N6 (%)
N7 (%)
N8 (%)
N9 (%)
N1
−
40.6
22.3
6.9
1.7
0.0
0.0
0.0
0.0
N2
67.0
−
20.5
0.8
1.7
0.0
0.0
0.0
0.0
N3
60.2
92.9
−
56.1
25.5
0.0
0.0
13.3
6.1
N4
20.4
32.6
80.1
−
50.3
5.0
0.6
45.9
48.6
N5
6.0
16.5
14.7
66.2
−
28.1
7.2
66.2
44.3
N6
0.0
0.0
4.6
2.3
35.6
−
56.8
47.7
12.1
N7
0.0
0.0
0.0
0.0
6.0
67.2
−
85.1
16.4
N8
0.0
0.0
2.0
2.0
2.0
2.0
81.6
−
100.0
N9
0.0
0.0
8.3
22.9
16.7
14.6
22.9
100.0
−
Spatial communication range uncertainty emerges in two aspects. 1) The communication ranges of different nodes vary significantly. As shown in Table II, N 1 and N 2 are only able to communicate with each other with reception ratios higher than 1/3, which means the communication range for both of them is only one hop. However, N 5 is able to reach N 9 with 44.3% reception ratio, indicating that its communication range is a 4-hop distance. Even if all nodes operate at same power, frequency band and baud rate, the network has heterogenous communication reliability, which challenges the MAC design and protocol evaluation for UANs. 2) When one sender transmit, receivers at different locations have evidentially variant reliability. There exists a possibility that closer receivers have much worse communication than the nodes further away, which is observed when N 4 and N 5 transmitted. In MAC protocol design, collision handling and transmission scheduling tightly depend on the communication ranges. When the actual neighborhood does not match the designed model, its performance will be significantly reduced. The communication range not only varies spatially, but also shows dynamic nature in temporal dimension. Owing to the time varying feature of wind, current, marine mammal noise and man made activities, the link reliability feature changes with time. We divide the total 3 hours test into 30 equivalent time segments and record the communication range (in hops) for each time period. The communication range varied significantly on both forward and backward links in the experiment. Fig. 6 illustrates the dynamic communication range when N 5 (in Table II) sent packets. No packets could be reliably delivered to any nodes in several periods. On the contrary, in the rest of time N 5 had good communication reliability for transmissions in both directions. C. Delayed Data Transmission The purpose of medium access control is to handle the interference in a shared medium by scheduling transmissions of multiple devices. Zero or negligible delay between the actual data transmission time on acoustic modems and scheduled sending time by the MAC protocol is expected to guarantee
the functionality of MAC protocols. However, in our field experiments, we discovered considerable delays between the scheduled transmission time and the actual modem sending time. The major reason for extra delays might be the busy terminal problem of acoustic modems [11], [16]. In current acoustic modem design, the actions of packet transmission and reception cannot be interrupted once they get started. This implies that the modem has to receive the whole packet forcibly without dropping out halfway, even if it is overhearing a packet not to it. This phenomenon is called busy terminal problem. If the modem is busy with either sending, receiving or overhearing at a scheduled packet transmission time, the outgoing packet pushed into the modem can not be processed immediately as the MAC protocol has scheduled. The packet transmission will be postponed until the modem comes out of busy state. This busy terminal problem is aggravated by the long transmission time in acoustic networks. In our experiments, the packet of 200 bytes lasted for 7.4 seconds when Benthos modems operated at 300 bps. We calculate the interval between modem sending time and MAC scheduling time and display the delays in Fig. 7. When the packet transmissions were not interfered by the busy terminal problem, the modem sending delays were randomly distributed from 0 to 200 ms. Among these 48 packet receptions in Fig. 7, four significant delays were observed in one test. This means the delayed modem transmission is not a rare situation. The highest delay was up to 1.8 seconds, which implies that the actual data sending time was 1.8 seconds later than the MAC scheduled transmission. These four modem sending delays were considerable even compared with the 0.7 seconds propagation delay and could make the collision avoidance mechanism futile. The delays introduced by the busy terminal problem are impulsive and unpredictable events and therefore pose grand challenges to MAC protocol design. D. Summary To summarize, we observed high packet loss rate and significant channel asymmetry, spatial and temporal communication range uncertainty and delayed data transmission on acoustic
5
1.8 Forward Link Backward Link
1.6
4
Modem Sending Delay (s)
Transmission Range (in hops)
4.5
3.5 3 2.5 2 1.5 1
1.2 1 0.8 0.6 0.4 0.2
0.5 0
1.4
5
Figure 6.
10
15 20 Time periods
25
30
Transmission range changes with time.
modems, from real filed experiments. Dealing with high packet loss rates becomes a challenging task for MAC protocol design, as packet losses could dramatically degrade the MAC performance from all aspects. Significant channel asymmetry becomes another challenge faced by MAC protocols with two-way handshaking or acknowledgement mechanisms. Collision avoidance handling, transmission scheduling and MAC performance analyzing rely on neighborhood information which suffers a lot uncertainty on the communication range in both spacial and temporal dimensions. Unexpected sending delays on acoustic modems are critical due to the busy terminal problem. Especially in dense networks where nodes experience heavy overhearing, delayed packet transmissions would cause significant collision avoidance failures. In the next section, we discuss the impact of aforementioned features on underwater MAC protocols in details. V. E XPERIMENT R ESULTS AND A NALYSIS The mechanisms of UW-Aloha, SASHA and PTMAC have been introduced in Section II. In this section, we analyze and compare the performance of three representative MAC protocols in terms of packet behavior, node level behavior and end-to-end performances. The packet behavior we are going to analyze includes hop-by-hop packet delivery delays and delivery ratio. In Section V-B, we define load balancing as a critical factor to evaluate node level behavior of the three MAC protocols. The end-to-end performance metrics we compare include throughput, delay and delivery ratio. Next we discuss each performance in details. A. Packet Behavior First we are going to study the packet behavior of the three MAC protocols, which includes the hop-by-hop delay and delivery ratio of data packets. These two packet level performance measures serve as the foundation to analyze the overall end-to-end protocol performance and meanwhile provide insights to pinpoint the problems within the design of the protocols. The hop-by-hop delay and delivery ratio of the three protocols are presented in Fig. 8 and Fig. 9. Hop-by-hop delay is defined to be the interval between the time when the
0
0
Figure 7.
10
20 30 Packet ID
40
50
Delays before modem transmission.
packet arrives at the sender and the time when the packet is delivered to the receiver. Hop-by-hop delivery ratio is defined to be the percentage of the packets received by the receiver at a given hop. UW-Aloha achieved much lower delays than the handshaking SASHA and scheduling based PTMAC, benefiting from the simple nature of the protocol. UW-Aloha is designed to transmit packets immediately as long as the node is in idle state. Even when it suffered huge packet losses, packets were dropped after a certain number of retries, which enabled senders to process new packets after short delays. The downside of this packet dropping mechanism is that it leads to a low packet delivery ratio. For instance, Link 5 had a much higher packet loss rate than other links and therefore discarded a substantial amount of packets, leading to a sharp delivery ratio drop. SASHA and PTMAC showed comparable hop-by-hop delays, as both protocols introduce extra delays for data packet transmission. For SASHA, the two-way handshaking process is time consuming, which was 13.1 seconds in the experiment, including the long preamble, high propagation delay and guard time. If the packet loss rate is as significant as in Fig. 5, drastically long delays will be imposed on handshaking processes and retransmissions. Therefore, SASHA had larger delays than UW-Aloha and PTMAC on most links. In particular, the peak delay on Link 5 was caused by the huge packet losses and retransmissions. Regarding the packet delivery ratio, on Link 5, SASHA had a sharp drop similar to UW-Aloha, but due to a different reason. Unlike UW-Aloha, SASHA retransmits until all packets are delivered. With this scheme, a large amount of packets were queued on Link 5, which had a bad link quality. Nodes running PTMAC take turns to send packets. Each cycle took about 32.9 seconds in our experiment. If retransmission is needed, it has to wait 32.9 seconds for a new transmission cycle regardless whether its neighbor nodes have sending task in the assigned slots. The significant amount of packet losses and retransmissions on Link 5 caused a remarkable peak in packet delivery delay. This is a limitation of statistic scheduling design. On the other hand, since the whole running time was used for data packet transmissions in PTMAC, nodes had more transmission opportunities than
1 UW−Aloha SASHA PTMAC
1400
Hop−by−Hop Packet Delivery Ratio
Hop−by−Hop Packet Delivery Delay (s)
1600
1200 1000 800 600 400 200 0
1
Figure 8.
2
3
4 5 Link ID
6
7
8
Hop-by-hop packet delivery delays.
nodes in SASHA, and therefore achieved appealing delivery ratios on all hops along the path. B. Node Behavior In the node behavior analysis, we compare the data sending and receiving behaviors of each node among the three MAC protocols. We list the number of packets sent and received in a two and half hours test in Table III. We define load balancing factor in Equation (1). Pn ( i=1 Ni )2 , (1) FB = Pn n i=1 Ni2 where n is the number of nodes and Ni is the number of packets processed at node i. It is a different metrics from fairness [17], which is defined as an equal share of bottleneck. Load balancing refers to the balanced sending or receiving actions among nodes in the multi-hop network. Load balancing is a preferred feature in a network when all nodes have same traffic load, which was true in our experiment. Table III lists the balancing factor of three MAC protocols. Transmission balancing plays an important role in determining the network lifetime. Balanced transmission can help to avoid the early depletion of a node because of unbalanced heavy load, thus enhance network connectivity. Reception balancing, on the other hand, can help to avoid over-crowded region in the network. This feature is crucial for MAC protocol performance since the collision probability relies on the traffic rates. Severe interference would happen in the over-crowded region. UW-Aloha had poor balance on both sending and receiving events, since nodes closer to the source had more packets to receive and transmit than nodes closer to the sink, especially when a large amount of packets were dropped on Link 5. SASHA had better transmission balancing benefiting from the handshaking mechanism. Data packets could be sent out only when reservation is successful, which reduces unnecessary data transmissions. However, receiving balancing factor is still low due to the severe packet losses. Similar to UWAloha, much fewer packets traveled through Link 5, due to the time consuming two-way handshaking and retransmissions. For PTMAC, on the contrary, all nodes in the network have equal slots to transmit. Unbalanced sending was caused by
0.9 0.8 UW−Aloha SASHA PTMAC
0.7 0.6 0.5 0.4 0.3 0.2
1
2
Figure 9.
3
4 5 Link ID
6
7
8
Hop-by-hop packet delivery ratios.
retransmissions. Since PTMAC is designed to be collision free, more significant packet losses and retransmissions than UWAloha and SASHA in the test was possibly caused by the transmission range dynamics. PTMAC is based on the assumption that nodes two hops away are unable to reach each other and therefore allowed to send simultaneously, which should be the truth in the field. However, due to the communication range uncertainty, packets can reach nodes further than two hops, leading to unexpected collisions. Another serious problem for scheduling based MAC is the delayed modem transmission. When a packet is failed to be pushed out at scheduled time due to the busy terminal problem, unexpected collisions also occur. The receiving process, on the other hand, achieved high balancing rate in PTMAC. Nodes almost received similar number of packets along the path and led to a higher end-toend throughput than the other two protocols, which will be discussed in Section V-C. C. End-to-End Performance The end-to-end performance metrics we focus on in the comparison are throughput, packet delivery ratio, and delays. 1) End-to-End Throughput: End-to-end throughput is the most direct metric to evaluate the network performance. As shown in Fig. 10(a), UW-Aloha got the lowest throughput even at ultra low traffic rate. Because of time limitation, we did not get chance to conduct further test for UW-Aloha. The low throughput was a result of the packet drop mechanism. As revealed in Table III, a large number of packets failed to reach N 6, since UW-Aloha is designed to simply drop packet after several retries. This leads to much lower endto-end throughput and delivery ratio performance for UWAloha. SASHA achieved similar throughput performance with UW-Aloha at low traffic rate. SASHA handles data packet interference better than UW-Aloha using RTS/CTS reservation, but with a penalty incurred by high handshaking delays. The throughput of SASHA increased when the network had higher traffic rates. However, SASHA significantly underperformed PTMAC. Since the whole time in PTMAC was assigned for data transmission, the throughput performance linearly grew with the increasing network load before the PTMAC saturated. The highest throughput for PTMAC only depends on the
Table III N UMBER OF PACKETS SEND AND RECEIVED ALONG THE PATH FB
Number of Data Packets N1
N2
N3
N4
N5
N6
N7
N8
N9
(%)
Send
96
90
81
73
163
77
37
35
\
82.6
Recv
59
49
49
47
47
20
16
16
14
80.9
Sender ID UW-Aloha
SASHA
PTMAC
Send
66
75
56
47
46
49
30
29
\
90.0
Recv
59
52
51
51
45
15
15
15
15
79.5
Send
175
239
98
181
334
132
67
49
\
76.4
Recv
59
59
48
48
48
48
48
48
48
99.2
1
25
4000
UW−Aloha SASHA PTMAC
15
10
5
3500
0.8 UW−Aloha SASHA PTMAC
0.6 0.5 0.4
5
10
15 20 25 30 Data generation rate (in bps)
35
(a)
40
0.2
2500 2000 1500 1000
0.3 0
UW−Aloha SASHA PTMAC
3000
0.7
End−to−End Delay (s)
20
End−to−End Delivery Ratio
End−to−End Throughput (in bps)
0.9
500
4
4.5
5
5.5 6 6.5 Network Size (hops)
7
7.5
8
0
4
4.5
5
5.5 6 6.5 Network Size (hops)
(b) Figure 10.
7
7.5
8
(c)
End-to-end performance comparison. (a) Throughput, (b) Delivery ratio, (c) Delay.
modem transmission rate and channel quality. Due to the pipelined scheme, the hop with worst channel performs as the bottleneck. 2) End-to-End Delivery Ratio: End-to-end delivery ratio is an important metric related to the network reliability. Due to the high cost of transport layer retransmission in UANs, link level reliability becomes an essential feature for MAC protocols. In Fig. 10(b), we compare three MAC protocols in terms of delivery ratio performance. End-to-end packet delivery ratio relies on the network size. With a larger number of hops along the path, packets are more vulnerable to losses. UW-Aloha had as much as 75% packets loss along the path after a limited number of retransmissions. The huge packet losses were caused by collisions and bad channel quality. When the network was as small as 4-hops, SASHA successfully delivered 70% of packets generated. However, when the network size increased to 8-hops, the delivery ratio drastically reduced to 28%. As Link 5 was very unstable in the 8-hop network, a quite large number of packets were stuck in the middle of network. Even though SASHA is designed to be able to avoid data packet interference, the time consuming handshaking process and high packet losses lead to low capacity on data packet delivery, which is the main reason for the low delivery ratio in the 8-hop network. PTMAC, on the other hand, achieved the highest end-to-end reliability. Benefiting from the scheduling mechanism, nodes had time to process more packets since no contention or reservation delays were introduced in PTMAC.
3) End-to-End Delay: End-to-end delay grows with the increase of network size, since longer time would be required to reach the destination if the sink is further away. Fig. 10(c) shows the delay performance of the three MAC protocols. According to the design of UW-Aloha, packets are pushed out with minimum delays. Even though superfluous packets were lost in the middle of network, the delivered packets were able to reach the destination with small end-to-end delays, as shown in Fig 10(c). SASHA and PTMAC had much more significant end-to-end delays than UW-Aloha. This conclusion is consistent with the results of hop-by-hop delays in Fig. 8. Since both protocols are designed to deliver all packets with unlimited retries. When one link (Link 5) was bad, the substantial retransmissions led to dramatic delays. Delays of both SASHA and PTMAC linearly increase with the network size according to our test results. Similar to the throughput performance, SASHA was inferior to PTMAC on delay performance. This is also caused by the time consuming handshaking process considering the low sound speed and long preamble in acoustic modems. VI. D ISCUSSION In Section IV, we discussed three facts we observed about real system features, namely, high packet loss rate and significant channel asymmetry, communication range uncertainty and delayed data transmissions. The impact of these facts on three representative MAC protocols was analyzed in Section V. In this section, we discuss how these real system features affect
general MAC protocols and provide some suggestions on how to address the observed issues in underwater MAC protocol design. The high packet loss rate brings grand challenges to underwater MAC protocol design. Even though most MAC protocols employ retransmission mechanism to deal with packet losses, it becomes inefficient if we consider the long preamble length, high propagation delays and high energy consumption with retransmissions in real systems. In this case, network coding technique [18] becomes a promising technique because of the broadcast nature of UANs. The communication reliability could be improved to some extent benefiting from the error recovery capacity of network coding. However, the time-varying feature of UANs requires dynamic coding rate, which is still an open issue. On another hand, the significant channel asymmetry might degrade the performance of the ARQ based MAC protocols, since both the data packet and the ACK packet losses will lead to data packet retransmitting. This implies that the number of retransmissions is determined by the worse channel between the data transmission channel (forward link) and the feedback channel (backward link). To counter the negative effect of channel asymmetry, one viable solution is to employ independent coding rates for channels with different link qualities. However, this introduce further complexity for MAC protocol design. The spatial and temporal communication range uncertainty changes the interference area in real experiments, which is generally assumed to be fixed and homogenous in theoretical and simulation studies. This results a gap between simulation results and the real performance in sea experiments. This gap could be mitigated by introducing the communication range randomness in the simulator. For scheduling based MAC protocols, the communication range uncertainty can also incur undesired interference to nodes that are multi-hop away if they fail to consider the dynamic neighborhood issue. Dynamic scheduling might help but is difficult to implement in real underwater networks, where the negotiation throughout the network is slow and inefficient even if a common control center exists. The delayed data transmission on acoustic modems could make the collision avoidance mechanism futile. Especially in the network where nodes experience heavy overhearing, the data transmissions might behave in totally unexpected ways. Adding large guard time could reduce the chance of collisions when the data transmission is undesirably postponed due to the busy terminal problem, however, with a penalty of increased network latency. VII. C ONCLUSION In this work, we conducted multi-hop string network experiments at Atlantic Ocean. In the field results, we observed high packet loss rate and significant channel asymmetry, spatial and temporal communication range uncertainty and delayed data transmission caused by the busy terminal problem, which have evidential effect on MAC protocol performance. We also analyzed and compared the random access based UW-Aloha,
handshaking based SASHA and scheduling based PTMAC with different network scenarios. Based on the field test results, we studied the advantages, shortcomings and limitations of three MAC protocols and how they work in real systems. The end-to-end metrics we compared are throughput, delivery ratio and delays. Following this, we discussed the impact of observed system features on general underwater MAC protocols and provided some inspirations to address these specific problems in MAC design for real multi-hop networks. R EFERENCES [1] J.-H. Cui, J. Kong, M. Gerla, and S. Zhou, “Challenges: Building Scalable Mobile Underwater Wireless Sensor Networks for Aquatic Applications,” Special Issue of IEEE Network on Wireless Sensor Networking, May 2006. [2] I. F. Akyildiz, D. Pompili, and T. Melodia, “State of the Art in Protocol Research for Underwater Acoustic Sensor Networks,” ACM Mobile Computing and Communication Review, 2007. [3] M. Chitre, S. Shahabudeen, and M. Stojanovic, “Underwater Acoustic Communications and Networking: Recent Advances and Future Challenges,” Marine Technology Society Journal, vol. 42, no. 1, pp. 103–116, Spring 2008. [4] J. Liu, Z. Wang, M. Zuba, Z. Peng, J.-H. Cui, and S. Zhou, “JSL: Joint time synchronization and localization design with stratification compensation in mobile underwater sensor networks,” in Sensor, Mesh and Ad Hoc Communications and Networks (SECON), 2012 9th Annual IEEE Communications Society Conference on. IEEE, 2012, pp. 317– 325. [5] N. Chirdchoo, W.-S. Soh, and K. C. Chua, “Aloha-based MAC Protocols with Collision Avoidance for Underwater Acoustic Networks,” in Proceedings of INFOCOM’07, April 2007, pp. 2271 – 2275. [6] M. Xiaoxing Guo; Frater, M.R.; Ryan, “Design of a Propagation-DelayTolerant MAC Protocol for Underwater Acoustic Sensor Networks,” IEEE Journal of Oceanic Engineering, pp. 170–180, 4 2009. [7] C.-C. Hsu, K.-F. Lai, C.-F. Chou, , and K. C.-J. Lin, “ST-MAC: SpatialTemporal MAC Scheduling for Underwater Sensor Networks,” in IEEE INFOCOM 2009, 2009. [8] Y. Luo, L. Pu, Z. Peng, Z. Zhou, and J.-H. Cui, “CT-MAC: a MAC protocol for underwater MIMO based network uplink communications,” in Proceedings of the Seventh ACM International Conference on Underwater Networks and Systems. ACM, 2012, p. 23. [9] Z. Peng, Z. Zhou, J.-H. Cui, and Z. J. Shi, “Aqua-Net: An Underwater Sensor Network Architecture: Design, Implementation, and Initial Testing,” in Proc. of MITS/IEEE OCEANS Conference, Biloxi, Mississippi, USA, October 2009. [10] Z. Peng, S. Le, M. Zuba, H. Mo, Y. Zhu, L. Pu, J. Liu, and J.-H. Cui, “Aqua-TUNE: A testbed for underwater networks,” in IEEE OCEANS, Santander, Spain, June 2011. [11] L. Pu, Y. Luo, Y. Zhu, Z. Peng, S. Khare, J.-H. Cui, B. Liu, and L. Wang, “Impact of Real Modem Characteristics on Practical Underwater MAC Design,” in Proceedings of IEEE OCEANS’12, May 2012. [12] R. P. Petrioli, Chiara and J. Potter, “Performance evaluation of underwater MAC protocols: From simulation to at-sea testing,” in Proceedings of IEEE OCEANS’11, 2012. [13] H. Mo and J.-H. Cui, “Evaluating Selective ARQ and Slotted Handshake based Access in Real World Underwater Networks,” UCONN CSE, Tech. Rep. UbiNet-TR13-02, Jan. 2013. [14] S. Le, Y. Zhu, J.-H. Cui, and Z. Jiang, “Pipelined Transmission MAC for String Underwater Acoustic Networks,” UCONN CSE, Tech. Rep. UbiNet-TR13-01, Jan 2013. [15] “Teledyne-Benthos Acostic Modems,” http://www.benthos.com. [16] Y. Zhu, Z. Zhou, Z. Peng, and J. Cui, “Busy Terminal Problem and Implications in Underwater Acoustic Networks,” in Proceedings of the Seventh ACM International Conference on Underwater Networks and Systems. ACM, 2012, p. 45. [17] R. Jain, A. Durresi, and G. Babic, “Throughput fairness index: An explanation,” Tech. rep., Department of CIS, The Ohio State University, Tech. Rep., 1999. [18] T. Ho, M. M´edard, R. Koetter, D. Karger, M. Effros, J. Shi, and B. Leong, “A random linear network coding approach to multicast,” IEEE Transactions on Information Theory, vol. 52, no. 10, pp. 4413– 4430, 2006.