TOWN OF NORTH ANDOVER
Community Development Plan Final Draft Report May 24, 2004
Prepared for: North Andover Community Development & Services Division
Prepared by:
Community Opportunities Group, Inc. Boston, Massachusetts
Transportation Planning & GIS Mapping Services by:
Merrimack Valley Planning Commission
Haverhill, Massachusetts
This project was supported in part by an Executive Order 418 grant from the Commonwealth of Massachusetts Department Housing and Community Development, Executive Office of Environmental Affairs, Department of Economic Development, and Executive Office of Transportation, and administered by the Merrimack Valley Planning Commission.
TABLE OF CONTENTS EXECUTIVE SUMMARY.............................................................................................................................. I 1. 2. 3.
SCOPE ...................................................................................................................................................... I RECOMMENDATIONS ............................................................................................................................... II ACTION PLAN AND TIMELINE .................................................................................................................. I
PROFILE: NORTH ANDOVER....................................................................................................................1 Population Characteristics ........................................................................................................................2 Economic Characteristics ..........................................................................................................................5 Development Trends ..................................................................................................................................8 Community Values .....................................................................................................................................9 ECONOMIC DEVELOPMENT...................................................................................................................10 1.
LUCENT TECHNOLOGIES/1600 OSGOOD STREET ...................................................................................10 Region ......................................................................................................................................................12 Redevelopment of Large Single-User Facilities ......................................................................................13 Potential Reuse Options ...........................................................................................................................15 2. ZONING REVIEW ...................................................................................................................................18 Industrial Districts....................................................................................................................................18 Commercial Districts ...............................................................................................................................22 Recommendations ....................................................................................................................................26
HOUSING.......................................................................................................................................................35 Housing Trends ........................................................................................................................................35 Housing Affordability ..............................................................................................................................41 Planning Considerations...........................................................................................................................44 Recommendations ....................................................................................................................................48 OPEN SPACE & RESOURCE PROTECTION .........................................................................................55 Natural Resources and Land Use Suitability Map ...................................................................................55 Habitat Preservation and Water Resource Protection Priorities ...............................................................56 Recommendations ....................................................................................................................................59
EXECUTIVE SUMMARY 1.
SCOPE
The North Andover Community Development Plan consists of several components: Ÿ
Transportation and associated mapping services by Merrimack Valley Planning Commission (MVPC), with particular emphasis on traffic and public safety issues at Route 114/Peters Street and Route 125/Holt Road.
Ÿ
Economic Development, including: Ÿ
An economic development database.
Ÿ
An economic profile of the town, considering population and labor force trends, education levels, household wealth, local employment, transportation services, and workforce development.
Ÿ
A review of North Andover’s commercial and industrial development regulations.
Ÿ
An evaluation of possible options for reuse of the Lucent Technologies plant on Osgood Street.
Ÿ
Opportunities to create or retain jobs for low-, moderate-, and middle-income individuals.
Ÿ
An update of the economic development goals outlined in North Andover’s Master Plan 2000.
Ÿ
Housing, with special emphasis on preserving North Andover’s existing affordability, and creating new housing through adaptive reuse/redevelopment of residential and nonresidential buildings, and infill development.
Ÿ
Open Space, including recommendations for resource protection steps the town should take in addition to those outlined in North Andover’s most recent Open Space and Recreation Plan.
Ÿ
An action plan and timeline.
This report includes the economic development, housing and open space components of North Andover’s community development plan.1 MVPC has provided the transportation analysis and maps to the town in a separate submission.
1
The economic development database was delivered to the town on CD-ROM in 2003.
Town of North Andover
2.
Community Development Plan
-ii-
RECOMMENDATIONS
The Community Development Plan includes the following recommendations (see also, Map 1).
Economic Development Summary. North Andover’s existing zoning is complicated and contains a number of subtle but important inconsistencies. The bylaw provides for ten commercial and industrial districts and often, they are located randomly around town, with little sense of connection between them. At times, the districts seem to have been created for particular projects or sites rather than as a result of planned choices. In addition, the town’s use and dimensional regulations should be updated, clarified and coordinated in a way that reduces the potential for use conflicts and increases the economic worth of land zoned for business and industrial development. North Andover has few if any options to rezone additional land for non-residential use. Moreover, the town has to think carefully about the environmental, traffic and quality-of-life implications of placing large amounts of land in commercial and industrial use. “Fiscal zoning” – land use policies adopted for the sole purpose of generating revenue and reducing costs – usually bring unanticipated and unwanted consequences. North Andover already has established built assets that can be used, reused and redeveloped more intensively for new business and industry, notably the former Lucent Technologies plant on Osgood Street. The town needs to focus its economic development attention on all that will be required to restore 1600 Osgood Street as a viable industrial center. North Andover does have options to encourage more intensive use of land in existing commercial and industrial districts. Its dimensional, density and parking regulations effectively limit development in ways that may not be obvious to local officials and residents. Regulatory strategies to encourage higher-density development in existing business districts will make these areas more valuable to the town’s economy and tax base. 1.
Consolidate and reorganize the Business and Industrial Districts. Commercial Districts Downtown Business Neighborhood Business Commercial Business Transitional (Mixed-Use) Business District
Industrial Districts Industrial-1 Industrial-2
2.
Add clear use definitions and classify uses by compatibility and similarity of impacts.
3.
Provide “campus-style” industrial development regulations for industrial parcels of 10 or more acres.
4.
Allow frontage waivers and/or a higher floor area ratio (FAR) by special permit in the (proposed) Neighborhood and Commercial Districts in exchange for: Ÿ
Access management: shared driveways and shared parking area or structured parking facility serving two or more commercial sites.
Town of North Andover
Community Development Plan
Ÿ
For redevelopment projects, reduce or eliminate existing front parking and relocate parking areas to the side and rear of a site.
Ÿ
Sub-grade parking (for which a height waiver may also be required in Neighborhood Business.
Ÿ
Developer contribution to a community facilities fund, based on a fee schedule established by the town pursuant to its capital improvements plan, for sidewalks, landscaping, lighting, pedestrian/bicycle and other amenities in the business districts.
-iii-
5.
Prohibit parking between the street and the front of new commercial buildings and reduce minimum front yard setback requirements in all commercial districts.
6.
Require wide sidewalks particularly in Neighborhood Business District developments wherever feasible, or allow the developer to pay a fee in lieu of sidewalks to a community facilities fund.
7.
Allow a higher FAR and modest increase in building coverage in the Industrial-1 and Industrial-2 Districts in exchange for a significant reduction in surface parking area by providing sub-grade parking or a structured parking facility.
8.
Adopt design guidelines for commercial and industrial development, and incorporate architectural design review into the Site Plan Review process.
9.
Establish a maximum gross floor area (GFA) for commercial uses in the (proposed) Downtown Business and Neighborhood Business Districts, and a GFA threshold over which a special permit would be required for commercial uses in the Commercial Business District. Include large-scale commercial development design requirements in the special permit granting criteria.
10. Encourage two-family homes, multi-family dwellings and accessory dwellings in commercial buildings, especially in the Downtown Business and Neighborhood Business Districts. For vertical mixed-use buildings, increase the maximum GFA for accessory residential uses to 65% from the existing 50%. 11. Eliminate the “Fiscal Impact” submission currently required under Site Plan Review. Fiscal impact may be an appropriate consideration when reviewing a proposed use, but Site Plan Review is not a review procedure for use. Rather, it is a review for the design, public safety, public utilities and operational features of a proposed development. The town could not reject a site plan submission on the basis of a fiscal impact analysis, so requiring the developer to supply one seems excessive. 12. Institute a minimum requirement for open space as a percentage of lot area in all commercial and industrial districts except the Downtown Business District.
Town of North Andover
Community Development Plan
-iv-
Housing 1.
Adopt a mandatory open space-residential development bylaw for new housing developments of more than five homes, by special permit from the Planning Board.
2.
Replace the Phased Development Bylaw with a new Growth Management Bylaw: set a maximum number of dwelling units that may be permitted annually, with “opt-out” provisions by special permit for types of development that address the town’s housing and open space needs, such as: Ÿ
The inclusion of affordable dwelling units.
Ÿ
The inclusion of a mix of housing types – units both large and small, for individuals, couples and families.
Ÿ
The provision for more open space than the minimum required under the open spaceresidential development bylaw.
Ÿ
Conversion of older homes to two-family or multi-family units.
Ÿ
Payment of a fee in lieu of phasing development, with fee revenue placed in a special trust fund for neighborhood facilities, bicycle trails and sidewalks, or parks.
3.
Adopt a demolition delay bylaw to obtain review authority over whole or partial demolition of any building over a certain age, e.g., 50 years.
4.
Adopt preservation incentives in the Zoning Bylaw to encourage reuse of existing structures for affordable housing: greater use intensity where appropriate, by special permit, in the R-1, R-2 and R-3 Districts and outside of the Watershed Protection District. (Conversions are already allowed as of right in R4 and R6).
5.
Develop a target list of single-family, multi-family and condominium properties for acquisition/rehabilitation in exchange for permanently affordable housing units, and establish a funding pool with CPA revenue.
6.
Develop a Comprehensive Permit Policy to guide local decision-making about affordable housing proposals and assist developers with addressing North Andover’s housing needs.
7.
Designate areas that are appropriate for higher-density housing and infill development, and rezone them accordingly. Ÿ
Allow mixed-use development (residential and commercial) by special permit in portions of the existing R4, R2 and GB Districts, provided that the residential component of a mixed-use development includes deed-restricted affordable housing units.
Ÿ
Adopt infill development regulations.
Town of North Andover
Ÿ
8.
Community Development Plan
-v-
Pursue “Local initiative” housing, e.g., housing developed under a Local Initiative Program (LIP) comprehensive permit or in partnership with a non-profit development corporation.
Submit a housing plan to DHCD for approval as a Chapter 40B Production Plan – after the town institutes the policies and regulations necessary to implement the plan.
Open Space 1.
Consider a home rule petition to establish a Lake Cochichewick Management Commission that has development review and permitting powers within the Lake’s watershed.
2.
Focus open space and recreation resources (volunteer, staff and funds) on implementing North Andover’s existing plans. New planning initiatives should be limited to the next open space plan update in 2005 and a Water Master Plan.
3.
ACTION PLAN AND TIMELINE
Timeline (CY) 2004-2005
Recommendation/Action Reorganize & consolidate the Business and Industrial Districts, substantially in accordance with the recommendations of this plan.
Leadership Required Community Development Planning Board
Resources Required Consulting services or Merrimack Valley Planning Commission (MVPC) for mapping and planning support.
2004-2005
Amend Zoning Bylaw by adopting a mandatory open space-residential development bylaw.
Community Development Planning Board Conservation Commission
Technical assistance from MVPC or Alliance for Green Neighborhoods.
2005
During the next Open Space & Recreation Plan update, consider establishing a Lake Cochichewick Management Commission.
Community Development Conservation Commission Planning Board Board of Selectmen
Can be done with in-house resources.
2005
Develop a Comprehensive Permit Policy Statement and determine whether the town should submit a Chapter 40B Production Plan to DHCD.
Community Development Housing Partnership Board of Selectmen
Can be done with in-house resources.
2005
Develop a target list of single-family, multifamily and condominium properties for acquisition/rehabilitation in exchange for permanently affordable housing units, and establish a funding pool with CPA revenue
Housing Partnership Community Preservation Committee
Can be done with in-house resources, including data and technical support from Assessor’s Office.
2006
Amend Zoning Bylaw to include clear use definitions, and classify uses.
Community Development Planning Board
Consulting services or MVPC for planning support.
Timeline (CY) 2006
Recommendation/Action Amend Zoning Bylaw by updating and strengthening the Site Plan Review regulations, to include design guidelines and design review standards for commercial, industrial and multi-family development. Eliminate fiscal impact submission requirement.
Leadership Required Community Development Planning Board
Resources Required Consulting services from a team that includes an architect and a landscape architect.
2006
Adopt demolition delay bylaw.
Community Development Planning Board Historical Commission
Can be done with in-house resources. Mass. Historical Commission maintains a library of demolition delay bylaws.
Amend the Zoning Bylaw to provide preservation incentives for historically important buildings in R-1, R-2, R-3 Districts and the Downtown Business District. 2007
Replace Phased Development Bylaw with a new Growth Management Bylaw that includes incentives to address town planning goals.
Community Development Planning Board
May need consulting services or MVPC for planning support; could be done inhouse if time permits. Requires information from Town Manager, Capital Improvements Plan Committee, Finance Committee.
2008
Amend the Zoning Bylaw by changing the off-street parking requirements substantially in accordance with the recommendations of this plan.
Community Development Planning Board
Can be done with in-house resources. Will require consultation with DPW.
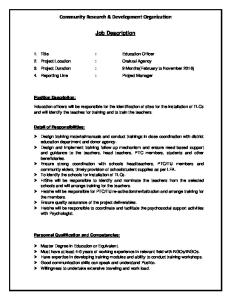
PROFILE: NORTH ANDOVER North Andover is located 24 miles north of Boston in the Merrimack Valley region. Bounded by Andover, Lawrence, Methuen, Haverhill, Boxford, Middleton and North Reading, North Andover offers easy access to regional highways, a well-respected school system, great neighborhoods, and a considerable amount of open space. Although its 26.7 mi2 land area makes North Andover a fairly large town, it retains a number of small-town qualities: family oriented, an active, participatory town government, and a strong sense of community. These qualities mean that North Andover is poised to attract businesses, employees and residents.
" ! 213
" !
HAVERHILL
METHUEN
113
! "
GROVELAND
125
LAWRENCE
! "
97 " !
133
" ! 110
NORTH ANDOVER
. , 495
. , -
BOXFORD
. , 95
" !
93
114
ANDOVER 28 ! "
" ! 125
MIDDLETON
NORTH READING
1
0
1
2 Miles
The North Andover Master Plan (Update 2000) highlights several of the town’s strengths, including: Ÿ
Retained features of North Andover’s roots: agricultural legacy and industrialization
Ÿ
Housing diversity (architectural styles, housing sizes and types, location and cost)
Ÿ
Highly educated workforce
Ÿ
Economy that supports leading edge firms and small businesses
Ÿ
Outstanding public school system and private college
Ÿ
Affordable tax structure for homeowners and businesses
Assets such as these will continue to influence the size, structure and health of North Andover’s economy.
Town of North Andover
Community Development Plan
-2-
POPULATION CHARACTERISTICS Population Growth Location, available land and prestige make North Andover very attractive to suburban home seekers in the Lawrence-Haverhill metro area. Although it is not the region’s most rapidly growing town, North Andover experienced a relatively high rate of population, household and housing unit growth between 1990-2000. Recent trends pale in comparison to the town’s growth experience when I-495 was completed in the 1960s, but throughout the last half of the 20th century, North Andover witnessed a fairly consistent pace of housing development. Two decades of declining population growth rates were reversed by changes that occurred during the 1990s, when North Andover absorbed both population and housing unit growth at a rate significantly higher than the state’s overall experience. Table 1 reports population changes in North Andover and ten surrounding communities since 1950. Today, the town’s population density of 1,019.9 persons per square mile (mi2) is essentially equal to that of neighboring Andover. Table 1: Regional Population Trends Area (mi2) 1950 Andover 31.0 12,437 Boxford 24.0 926 Georgetown 12.9 2,411 Haverhill 33.3 47,280 Lawrence 7.0 80,536 Methuen 22.4 24,477 Middleton 14.0 2,916 NORTH ANDOVER 26.7 8,485 North Reading 13.3 4,402 Topsfield 12.7 1,412 Wilmington 17.1 7,039
1960 15,878 2,010 3,755 46,346 70,933 28,114 3,718 10,908 8,331 3,351 12,475
1970 23,695 4,032 5,290 46,120 66,915 35,456 4,044 16,284 11,264 5,225 17,102
1980 26,370 5,374 5,687 46,865 63,175 36,701 4,135 20,129 11,455 5,709 17,471
1990 29,151 6,266 6,384 51,418 70,207 39,990 4,921 22,792 12,002 5,754 17,651
2000 31,247 7,921 7,377 58,969 72,043 43,789 7,744 27,202 13,837 6,141 21,363
Source: Massachusetts Institute for Social and Economic Research (MISER).
North Andover’s recent population growth has been attended by shifts in the age composition of its residents. The elderly as a percentage of the state's population dropped minimally from 13.6% in 1990 to 13.5% in 2000, but in North Andover, elders made up 12.4% of the population in 1990 and nearly 14% in 2000. In absolute terms, North Andover’s elderly population increased by 817 people or 29%, mainly among persons over 75. The town’s experience differs in at least one other respect. The in-migration of families during the 1990s led to a 28% increase in North Andover’s under-18 population, yet the state’s rose by only 10.9%. Moreover, under-18 population growth statewide occurred among persons 5-17 years of age while the pre-school population declined 3.7%, but in North Andover, the pre-school population increased by 24% between 1990-2000.2 Today’s population characteristics in North Andover reflect internal changes that were evident by the end of the 1980s and a higher-than-average in-migration of households during the past decade. On April 1, 2000, the percentage of the population that had lived in the same home for at Bureau of the Census, [database online], Census 2000 Summary File 1, Table P11, 1990 Census of Population and Housing, Summary File 1, Table P011.
2
Town of North Andover
Community Development Plan
-3-
least five years was lower in North Andover (54.2%) than in all nearby suburbs. The recycling of older homes and a large inventory of new homes help to explain North Andover’s overall growth rate and the age profile of its population. Between 1990- 2000, 4.5 new households moved into North Andover for every new housing unit built.3 Not all of the town’s population growth is attributable to new families, however. About 12% of North Andover’s 1990-2000 population increase consists of persons in shared quarters: college dormitories, off-campus housing and nursing homes. In fact, the rate of group quarters population growth (40.2%) significantly exceeded the rate of household population growth (18%).4 By Census 2000, the group-quarters population had increased from 5.8% to 6.8%of North Andover’s total population. About 71% are students at Merrimack College.
Race & Ethnicity Like most suburbs, North Andover has experienced not only household and population growth but also change in the racial and ethnic make-up of its people. A decade ago, 97% of the town’s 22,792 residents were white, primarily of Irish, Italian and English descent. As of Census 2000, 93% of the 27,202 people living in North Andover were white and while the same ancestries prevailed, the number of persons reporting cultural ties to Eastern Europe, the Middle East and Eastern, South Central and South Eastern Asia increased significantly. Slightly more than 8% of the town’s current population is foreign-born, primarily in Asian and Latin American nations.
Households North Andover’s 9,699 households are comprised primarily of families: that is, households of two or more people related by blood, marriage or adoption. The composition of its housing stock, the relative wealth of its population and the town’s commitment to high-quality public schools all help to explain North Andover’s attractiveness to families, particularly those with school-age children. Table 2 shows that the town surpasses county and statewide norms for percentage of family households, households with children and average household size. North Andover has developed under zoning policies that favor traditional neighborhoods of single-family homes, and its neighborhoods are very appealing to Merrimack Valley homebuyers. Table 2: Comparison Population Characteristics North Andover Population 27,202 Households 9,699 Families 7,012 Percent Families 72.3% Average Household Size 2.61 Households w/ Children < 18 3,621 Percent Households w/ Children <18 37.3%
Essex County 723,419 275,410 186,043 67.6% 2.57 90,854 33.0%
Massachusetts 6,349,097 2,443,580 1,576,696 64.5% 2.51 748,865 30.6%
Source: Bureau of the Census, Summary File 3, Tables P1, P9, P10. 3
Bureau of the Census, Census 2000, Summary File 3,
Census 2000, Summary File 1, Table PCT16; and Merrimack College, available on the World Wide Web at [cited 12 February 2003]. 4
Town of North Andover
Community Development Plan
-4-
Household Income North Andover’s median household income of $72,728 ranks 60th in the Commonwealth and it is about 1.35 times higher than the median for the Lawrence metropolitan area. While one-third of the town’s households have annual incomes below the Lawrence area median, 8.7% have annual incomes of $200,000 or more – a rate that in North Andover’s region is surpassed only by Andover, Boxford and Topsfield, as shown in Table 3. Table 3: Comparison Household Income Statistics
Community Andover Boxford Georgetown Haverhill Lawrence Methuen Middleton NORTH ANDOVER North Reading Topsfield Wilmington
Median Household Income ($) 87,683 113,212 76,260 49,833 27,983 49,627 81,395 72,728 76,962 96,430 70,652
Households >$200,000 Percent of % Aggregate Households Income 12.7% 24.0% 4.0% 1.6% 0.9% 1.3% 6.4% 8.7% 5.5% 8.9% 2.3%
37.9% 52.4% 12.6% 9.7% 10.0% 7.4% 22.2% 29.8% 18.2% 26.6% 9.6%
Source: Census 2000.
North Andover’s highest-income age group consists of householders between 45-54 years of age, and its lowest-income households are the very young – people under 24 – and elderly households headed by persons over 75. These conditions are nearly universal, and they certainly apply to all towns in North Andover’s region. However, householder age is only one of several factors that influence household income. Household type is also important. Families generally have higher incomes than non-family households and this applies to North Andover as well, but the difference is somewhat more pronounced. North Andover’s median family income of $91,105 is 1.25 times higher than the median household income, a ratio that slightly exceeds that of other communities nearby. In addition, non-family households (one-person households and households of unrelated individuals) usually have somewhat lower incomes in relation to the household median. Again, North Andover’s experience is fairly typical: its median non-family household income is $30,994, or 43% of the household median. Approximately 2.9% of the town’s population falls below the federal poverty standard. Among persons below poverty, 82% are below age 65 and 63% are in family households.5
5
Census 2000, Summary File 3, Tables P77, P80.
Town of North Andover
Community Development Plan
-5-
ECONOMIC CHARACTERISTICS Labor Force, Education & Unemployment
2000
1998
1996
1994
1992
1990
Persons in Labor Force
North Andover’s labor LABOR FORCE TRENDS force has grown by 18% since 1995, from 12,371 to (Source: DET, 2003) Employed Unemployed 14,572 people. The rate of 16,000 growth in North Andover’s labor force is a surrogate 14,000 for the town’s population 12,000 growth, Over the past decade, North Andover 10,000 experienced a significant increase in the percentage 8,000 of persons over 25 holding undergraduate, graduate or 6,000 professional degrees (50.3%). Overall, North 4,000 Andover’s adults are not as highly educated as their 2,000 counterparts in Andover 0 and Boxford, but the educational attainment of its labor force is different from that of the town’s total adult population. As more young families moved into North Andover between 1990-2000, they changed the demographic make-up of the town. About 48% of North Andover’s labor force is employed in occupations that require college or advanced training, e.g., management, education, medicine, architecture and engineering, and human services. The percentage of married women who work is lower in North Andover and Andover (55%) than in all communities nearby except Lawrence (43.6%), and this contributes to North Andover’s somewhat lower percentage of persons over 16 in the labor force. Whether in family or non-family households, North Andover’s women with full-time jobs earn more than women statewide, but their mean earnings are only 57% of the town’s mean earnings by men, $38,495 compared to $66,793.6 Despite the size of North Andover’s employment base – 861 establishments and 18,343 jobs – less than one-fourth of its employed residents work locally and 43% commute more than 30 minutes to and from work. Of the town’s commuters, 83% drive alone while only 8.5% use some form of public transportation, mainly commuter rail, on a daily basis. It is easy to see why. According to federal census data, a small percentage of North Andover’s residents (10.4%) work in Boston or Cambridge, where inbound public transportation service is available to commuters. Most residents work in suburbs elsewhere in Essex County or in Middlesex County along I-93 or I-495. 6
Census 2000, Summary File 3, Tables P37, P50, DP-3, P85.
Town of North Andover
Community Development Plan
-6-
Employment & Wages When the Planning Board adopted North Andover’s first master plan (1957), manufacturing jobs comprised more than 95% of the town’s total employment. A “company town” making the transition from textiles to technology, North Andover had recently attracted a new Western Electric Company plant on Osgood Street near Haverhill.7 Although North Andover aspired to be one of the region’s top industrial centers, manufacturing employment gradually gave way to growth in other industries. During the 1990s, manufacturing employment declined by nearly 50% in North Andover. Manufacturing still exceeds other industries for total employment, but service jobs have become an increasingly prominent part of the town’s economy. In 1990, North Andover had 3.55 manufacturing jobs for every service job; by 2001, the ratio had dropped to 1.43.8 Similar rates of decline have occurred throughout North Andover’s region, yet some communities with a much smaller manufacturing base absorbed modest growth in manufacturing employment toward the end of the decade.
7
2001
2000
1999
1998
1997
1996
1995
1994
1993
1992
1991
1990
1989
1988
1987
1986
1985
Establishments
Employment
Since 2000, North EMPLOYMENT TRENDS Andover has lost an (Source: DET) additional 3,000 1,000 19,500 manufacturing jobs because Lucent 900 19,000 Number of Establishments Technologies all but 800 Total Employment 18,500 closed its Osgood Street complex: the plant 700 18,000 originally built by 600 Western Electric in the 17,500 1950s. Only three years 500 17,000 ago, Lucent was still 400 North Andover’s 16,500 largest employer, but 300 by the time the 16,000 200 company sold its 15,500 Osgood Street property 100 to local investors in 0 15,000 2003, the North Andover facility had scaled back to about 800 workers. North Andover’s other significant manufacturing employers include A.E.G. Schneider, Sweetheart Cup, Watts Regulator and AEP Industries. Most of the town’s manufacturing establishments are located in one of six industrial parks. In addition, North Andover has a considerable mix of small businesses. Retail shops, food establishments and service providers operate in several locations around town. North Andover Master Plan (2000).
Massachusetts Department of Employment & Training (DET), “North Andover, 1985-2001,” and North Andover ES-202 Employment 2002, 2003, generated by author using NAISC Data Retrieval System, . 8
Town of North Andover
Community Development Plan
-7-
Wages
2001
2000
1999
1998
1997
1996
1995
1994
1993
1992
1991
1990
1989
1988
1987
1986
1985
In 2000, North WAGES PAID BY LOCAL EMPLOYERS Andover companies (Source: DET) employed approximately 14,400 $50,000 people and paid an $45,000 average annual wage $40,116 of $42,600. Growth in $40,000 $42,699 wages and $35,000 employment seem to $30,788 run parallel to the $30,000 growth in service $25,000 industries between 1993 and 2000, in the $23,464 $20,000 Northeast region of Average Annual Wage Massachusetts. Over $15,000 the past 15 years, $10,000 North Andover and Andover have offered $5,000 higher average annual $0 wages than other municipalities in the Lawrence Labor Market Area. North Andover has remained consistently over $40,000 per year since 1997. The town is competitive in attracting a mix of business, industry and educational institutions that provide desirable jobs for a highly educated workforce.
Transportation & Commute Interstate 495 runs through the northern corner of town, bringing access to the Lawrence Municipal Airport, industrial parks and residential areas. Route 114 crosses through the southern half of North Andover and offers connections to Routes 125 and 133. In North Andover, more people than ever are commuting to work by driving alone. Although commuting via public transportation has increased slightly, carpooling has declined. The average travel time to work of 28.8 minutes indicates that residents are working fairly close to home. The MBTA does not have a commuter rail station in North Andover. The option for taking the train exists along the Haverhill/Reading line in Reading (113 parking spaces), North Wilmington (20 spaces), Ballardville (120 spaces), Andover (152 spaces) or Lawrence (163 spaces). North Andover is also a member of the Merrimack Valley Regional Transit Authority. In addition to regular bus routes that service in and around North Andover, the MVRTA provides special employment shuttles to the Lucent Technologies site that departs from Lawrence and Haverhill.
Workforce Development Opportunities North Andover’s region offers a number of educational programs for workers seeking to improve their employment skills. Locally, Merrimack College offers day and evening courses through its
Town of North Andover
Community Development Plan
-8-
continuing education program. The program includes liberal arts, science and computer technology courses. Students may register without working toward a degree or they may matriculate into a certificate, associate’s or bachelor’s degree program. In addition, Northern Essex Community College (NECC) in Haverhill runs the Institute for Community and Workforce Development. The college makes it a priority to play a key role in the economic and workforce development of the region it serves. According to NECC’s program literature, “The Institute’s programs are designed to provide remedial classes, adult basic education, readiness for the General Equivalency Diploma exam, and more advanced community and leadership training.” Finally, the Valley Works Career Center, with locations in Lawrence and Haverhill, is funded through the Workforce Investment Act. VWCC is an employment and career services agency for Merrimack Valley that offers a wide range of services to job seekers: resume development, career counseling, job matching, veterans’ services, workshops and a Resource Room.
DEVELOPMENT TRENDS North Andover is a maturely developed community, but it still has a considerable amount of vacant, developable land, mainly for residential development. According to a buildout study prepared by Merrimack Valley Planning Commission for the Executive Office of Environmental Affairs’ Community Preservation Initiative (2000), North Andover has enough developable land for about 2,300 new dwelling units and 8.37 million square feet (ft2) of commercial and industrial space.9 However, most of the non-residential land in MVPC’s study is in parcels held by existing companies and is not currently available for development. Map 2 characterizes the town’s existing land use pattern and many of its key amenities. Housing is the most prevalent type of land use in North Andover. Since 1995, the town has issued building permits for more than 800 new single-family and multi-family dwellings. Like other suburbs, North Andover’s housing inventory is comprised mainly of detached singlefamily homes. However, the town has an unusually large base of two-family, three-family, multi-family and condominium units. North Andover’s housing profile reflects not only its industrial history but also its zoning, for local regulations encourage a considerable mix of moderate- to higher-density housing. The town also has several mixed-income housing developments, both rental and homeownership. Although North Andover’s zoning has kept the town accessible to people of all ages and incomes, sales prices have steadily increased in the past 12 years from $250,000 to more than $400,000. This trend will most likely continue, for North Andover’s experience mirrors that of the entire Eastern Massachusetts housing market. North Andover officials have issued permits for more than 2 million ft2 of new, non-residential development. About 16% of all recent non-residential activity represents municipal and institutional uses that contribute to the local economy but do not directly increase the tax base, such as new dormitory and academic buildings at Merrimack College and the construction of Foster Farm Elementary School. Many of North Andover’s new commercial projects are fairly
The North Andover Master Plan’s residential buildout estimate is 3,800 new dwelling units, based on 1997 conditions. The Master Plan does not provide a detailed forecast of future commercial and industrial development. 9
Town of North Andover
Community Development Plan
-9-
Approved Development (Square Feet)
small, as would be COMMERCIAL, INDUSTRIAL & INSTITUTIONAL GROWTH expected given the 1993-2003 limited supply of (Source: North Andover Planning Department) vacant, businesszoned land. 650,000 However, there have 600,000 been major 550,000 investments in large 500,000 retail and office 450,000 developments, 400,000 including the 350,000 Eaglewood Retail 300,000 Plaza (2003). 250,000 Investments in new or expanded 200,000 industrial space 150,000 accelerated toward 100,000 the end of the 1990s, 50,000 with projects 0 ranging from 10,0001993 1994 1995 1996 1997 1998 1999 2000 2001 2002 2003 55,000 ft2. In addition, the development of surplus land at Lawrence Municipal Airport – one of North Andover’s longsought objectives – has begun to materialize with permits and approvals for the North Andover Business Park.
COMMUNITY VALUES North Andover residents take great pride in their public schools. In FY 2002, North Andover invested more than $27 million in K-12 programs, not including debt service for school construction projects. The town’s total general fund expenditures exceeded $53 million, making education spending more than half of all expenditures. Approximately 60% of all general fund revenue is from the tax levy, 84% of which is comprised of residential taxes and 16%, commercial, industrial and personal property taxes. The town’s average single-family tax bill ranks 40th in the Commonwealth.
Strategy Paper
ECONOMIC DEVELOPMENT 1.
LUCENT TECHNOLOGIES/1600 OSGOOD STREET
Originally owned by Western Electric, the Lucent Technologies Merrimack Valley Works plant at 1600 Osgood Street is a distinguished, impressive compound that has defined the image of North Andover’s northernmost industrial area since the mid-1950s. The site consists of 169 acres, including 40 acres on the south side that have never been developed. In addition to nearly 2 million square feet (ft2) of manufacturing, office and warehouse space in 30 Former Lucent Technologies Merrimack Valley Works permanent and temporary 1600 Osgood Street, North Andover (Ozzy Properties Photo) buildings, the property includes 40 acres of roadways and parking, 6,000 parking spaces and four little league ball fields. The centerpiece of the site is its 1.5 million ft2 manufacturing facility. Western Electric built the North Andover plant between 1954-1956. The company’s arrival marked a significant turning point in North Andover’s economy, for while much of the region was suffering from the decline in textiles manufacturing, Western Electric made North Andover into a new kind of “company town.” For three decades, Western Electric employed 10,000-12,000 people in North Andover. The property eventually transferred from Western Electric to AT&T, and in 1996, AT&T sold the property to Lucent for $45 million. Toward the end of the 1990s, Lucent Technologies began to downsize, gradually laying off and relocating employees in North Andover and at other U.S. facilities. The layoffs, buyouts and early retirement packages intensified, and in mid-2001 Lucent reduced its payroll by nearly 900 jobs. Last year, 1600 Osgood Street, LLC – the Andover-based Ozzy Properties, Inc. – purchased the site for approximately $13.86 million with the goal of attracting high-tech/high-end industrial tenants. Today, the property is almost entirely vacant, with only a few hundred remaining Lucent Technologies employees filling its halls. The town and the people still employed there remain uncertain about the property’s future. For both North Andover and the region, the stakes are obviously high. For the new owners, however, the risks are enormous: dividing 1.5 million ft2 of single-user manufacturing space for multiple-tenant occupancy is daunting at best, and it is made far more challenging by the precarious state of the nation’s economy. Local, state and federal resources will have a major impact on the successful redevelopment of this property, for it is hardly the only industrial space available in Eastern Massachusetts. While the Lucent site
Town of North Andover
Community Development Plan
has economic, psychological and social significance to its present and former workforce and residents of North Andover, it is a massive plant that was designed and built to meet the industry-specific needs of one company.
-11-
" ! 1 13
HAVERHILL
1600 Osgood Street
METHUEN
" â
" ! RR IM AC K
RI VE R
110
" !
ME
1600 Osgood Street is served by 125 public water and sewer, Essex 4 95 County Gas Company, and LAWRENCE Massachusetts Electric. Both MUNICIPAL AIRPORT freight and passenger trains run BOXFORD on the tracks behind the site, 133 ! " LAWRENCE beyond which is the Merrimack River. Interstate 495 is only five minutes away via Route 125, the Ward Hill Connector and interchange 48 to the north, but access to the site from the regional highway system is not optimal, especially for tenants requiring oversized trucks and frequent deliveries. One commercial real estate services firm said recently that “the plant is somewhat off the beaten path.”10 Although the access routes to and from I-495 south are not ideal, it is important to remember that Lucent Technologies was the destination point for 12,000 commuters not so long ago. Transportation routes alone should not be an insurmountable barrier to redevelopment.
. , -
LT HO
RO
AD
C KE LA
OC
W HE HIC
ICK
Ozzy Properties purchased 1600 Osgood Street anticipating that the extensive space and Lucent’s recent investment of $75 million in facility improvements would make the site appealing to highend manufacturing establishments and thereby lure another large tenant. The staying power to be selective about the right “first tenant” will be crucial to the long-term reinvention of this property. Not surprisingly, many of the earliest inquiries have come from lower-end industrial firms. While Ozzy Properties has to remain open about potential tenants, they know that the initial leases could have a significant impact on their ability to market the property to quality tenants in the future. The issues are not only tenant compatibility and image, but also the sheer number of permutations involved in dividing such a large space. Currently, Ozzy Properties is focusing on biotechnology companies that are in the early stages of product development and will need production space in the near future. In addition, the owner wants to maintain the existing “campus” setting, adding some landscaping and modest site improvements in the short run. Ozzy Properties has designed new entrances at the north and south walls, handicapped accessible entrances and elevators, campus improvements to soften the appearance, common atrium space and breezeways, connections from the office building to
10
Ethan Forman, “A New Beginning,” Eagle Tribute, 12 October 2003.
Town of North Andover
Community Development Plan
-12-
manufacturing floor for contiguous corporate layouts, and new loading docks and shipping/receiving areas.11 Lease rates are estimated to be comparable to the rest of the region at approximately $6-$7 per square foot.12 For research and development firms occupying industrial buildings, the average rental rate is between $7-$9 per square foot. Should Ozzy Properties consider more office users for the facility, they may be able to charge higher rents, e.g., $14-$19 per square foot. However, office vacancy rates are very high throughout Eastern Massachusetts and rents have dropped significantly. Under current conditions, competing for office tenants is very difficult.13 In 2003, Haverhill voted to extend its Economic Target Area (ETA) designation, which offers a 5% investment tax credit, to include the Lucent Technologies site. North Andover has also approved a tax increment financing (TIF) agreement and the state legislature approved an additional economic stimulus package for the site.14
REGION North Andover is one of 15 communities in the Merrimack Valley Planning Commission’s (MVPC) regional planning district. According to MVPC, industrial growth in the Merrimack Valley area can be attributed in part to: Ÿ
Growth in the area due to proximity to Boston and its higher educational institutions.
Ÿ
The nearly full development of the Route 128 belt.
Ÿ
A well educated workforce.
Ÿ
Availability of reasonably priced industrial land along I-495.
Ÿ
Easily accessible local transportation networks including I-93, I-95, I-495 and a conveniently located international airport.15
All of these factors have fueled new development in industrial zones or rehabilitation and reuse of older structures. Under existing conditions in the I-495 real estate market, notably commercial and industrial vacancies, many are concerned that the region is vulnerable to a protracted economic downtown. For example, the MetroWest region is at a 21.3% vacancy rate, up from 9.9% in the third quarter of 2001. In the past 12 months, communities in the I-495 north area have experienced an increase in vacancy rates from 15.6% to 25.3% and communities in the I-495 west area, 18.6% to 29.2%. The only subregion with slightly improved market conditions is I-495
11
Ozzy Properties, Inc., “1600 Osgood Street,” , 1 June 2004.
12
Forman, “A New Beginning.”
13
Mitch Jacoby, CRESA Partners, 29 October, 2003.
Merrimack Valley Economic Development Council, “Annual Report 2003,” , 25 May 2004. 14
15
Merrimack Valley Planning Commission, “Industrial Site Inventory,” 24 October 2003.
Town of North Andover
Community Development Plan
-13-
south.16 An anticipated, modest recovery in the next 12-15 months will most likely result in the best buildings in the best locations being sought first along Route 128. As a result, the I-495 north market will most likely remain weak for a longer period. North Andover has advantages that other areas of Massachusetts do not, however. First, North Andover’s region has a comparatively strong track record in manufacturing. It is the state’s only region that experienced manufacturing job growth between 1993-2000: an increase of 5%. Since the Merrimack Valley area has traditionally been able to maintain manufacturing and high-end industries, North Andover and other communities nearby offer a skilled, educated workforce to prospective employers.17 This should give Ozzy Properties a marketing edge over other commercial developers looking to fill vacant industrial space. A second advantage is the town itself. North Andover is a great town with excellent public schools, a wide range of homes – including more than 500 recently permitted units in mixed-income developments – and cultural and open space amenities that will be very attractive to decision-makers in companies that are in a “move-up” or expansion mode. Unfortunately, many businesses in Massachusetts are not in an expansion mode. Rather, they are in a survival mode. Companies have downsized and some have had very high layoff rates. Since the early 1990s, the most notable shift in North Andover’s region is a clear transition toward services and away from manufacturing. Although the high-profile presence of manufacturing has declined, it remains critically important to the town, the region and the state. Manufacturing provides 20.8% of the northeast region’s total employment and manufacturing exceeds most other industries for the competitiveness of its wages.18
REDEVELOPMENT OF LARGE SINGLE-USER FACILITIES Ozzy Properties is hardly the first developer to purchase a once thriving, single-user facility with the intent of dividing and leasing space to multiple tenants. Wang Towers in Lowell, the Framingham General Motors assembly plant, the South Lowell Raytheon plant and Lucent Technologies’ plant in Lee’s Summit, Missouri, shed light on some of the issues involved with successfully redeveloping single-user properties. Wang Towers. In 1994, the Wang Towers property was sold at auction for $525,000 to a private developer who promised to recruit new tenants and bring in new business to Lowell. Along with financing deals from the city, the developer set out to make his new investment work. The towers, built in the late 1970s for $60 million, consist of approximately 1.5 million ft2 of office space.19 Renamed Cross Point Towers, the site offers low rental rates, day care facilities, fiber optic wiring, a fitness center and numerous conference rooms, elevator service and easily adaptable floor space. As of November 1999, Cross Point Towers, the largest single office building outside of Boston, had cemented its success with the attraction of big-name companies such as IBM, Cisco Systems, Eastman Kodak, Metropolitan Life, Chase Manhattan and AT&T. Banker & Tradesman, “Office Vacancies, Concerns Rise in I-495 and MetroWest Markets,” 24 October 2003.
16
17
Robert Halpin, Merrimack Valley Economic Development Council, 29 October 2003.
18
Massachusetts Office of Economic Development, Towards a New Prosperity, 2002.
“Sale of Wang Towers Complete,” The Lowell Sun, 21 March, 1994.
19
Town of North Andover
Community Development Plan
-14-
Today, the three buildings are 80-85% occupied and are expected to reserve the remaining floor area as expansion space for existing tenants. The success of this venture reinforces that converting a single-user facility for multi-tenant occupancy is possible. However, the redevelopment and leasing of Wang Towers occurred over a five-year period when the market was much stronger than it is today. General Motors. Framingham’s General Motors assembly plant, with 2.9 million ft2 of manufacturing space and 4,000 employees, closed its doors in 1991. Framingham lost another major employer, Prime Computing, at about the same time. At one point, Framingham and neighboring Natick had commercial and industrial vacancy rates near 50%.20 While the economic outlook was poor, local officials decided to engage in some thoughtful, long-range planning and a search for the right buyer. Both the town and General Motors contacted buyers on their own, and the town worked to create incentive packages such as a tax increment financing (TIF) plan. Ultimately, the property was purchased for $8.9 million by ADESA Corporation for an auto auction facility. The new wages were not in the $20/hour range that General Motors had paid, but ADESA did offer 250 full-time positions and 100 part-time jobs.21 If the goal of redevelopment is to retain jobs and tax revenue, the Framingham General Motors reuse project is a success story. Still, there are mixed feelings in Framingham about whether ADESA Corporation is as valuable as General Motors was to the community as a whole. Raytheon-South Lowell Plant. Once a thriving missile production plant, Raytheon’s South Lowell facility closed and was offered for sale in 1996. It includes 600,000 ft2 of space and 130 acres of land.22 Less than a quarter mile away is an I-495 interchange that offers direct access to the site.23 The property was purchased by private developer Don Levine, who renovated the entire building. Jabil Circuits, a Florida-based company that was lured by incentives to open a branch in Massachusetts, occupies half the site and is Levine’s main tenant. The other tenants include Solitec, Nortel and smaller manufacturing and assembly companies. The South Lowell Raytheon project required cooperation from three communities — Lowell, Billerica and Tewksbury — and they perceive the development as a successful venture to preserve viable industrial space and jobs for the region. Lucent-Missouri. In 1997, Townsend Capital LLC purchased the defunct Lucent Technologies plant in Lee’s Summit, Missouri. The facility was built in 1961 about fifteen miles southeast of Kansas City. It includes a 332-acre site with about 1 million ft2 of manufacturing space and is located less than one-quarter of a mile from Interstate 470, the outer belt highway surrounding Kansas City. The former Lucent-Missouri plant has three existing buildings with 173,092 ft2 of actual and potential clean room space for sensitive manufacturing operations.24 It also has its own power, steam and wastewater treatment plants, truck loading docks, a railroad spur and 20
Andy Murray, “Filling the Void,” The Lawrence Eagle Tribune, 16 December 2001.
Charles M. Sennott, “Blue-Collar Tradition Sold to the Highest Bidder,” The Boston Globe, 20 July 1997. 21
22
Richard Scanlon, Billerica Town Assessor, 30 October 2003.
Union Capital Investments, “Riverview Commerce Center – Tewksbury, MA,” , 30 October 2003. 23
Townsend Capital LLC, “Property Information,” , 25 May 2004. 24
Town of North Andover
Community Development Plan
-15-
5,500 parking spaces. In 1999, the plant was renamed “Summit Technology Campus,” and marketed as a high-tech manufacturing center. To date, the Summit Technology Campus has attracted AT&T, LabOne Inc., Perfect Commerce Inc. and the U.S. Bureau of Citizenship Services as long-term tenants. Townsend Capital LLC lists the campus as being 48% vacant, and the developer is currently spending $3 million to convert the campus into back office and data/call center space.25 One of the buildings has already been totally gutted and retrofitted, and another will be demolished. Over 175 acres of vacant land remain available for additional development.
POTENTIAL REUSE OPTIONS There are several reuse possibilities for 1600 Osgood Street, but for every possibility there are numerous challenges to realizing them. During its last five years of occupancy, Lucent Technologies spent nearly $75 million on technology and system upgrades, yet the facility’s massive size and the state’s weak market for office and industrial space complicate the prospects of marketing and leasing up this property. From a regional economic development perspective, the most viable options will probably be biotechnology/biopharmaceutical and medical supply R&D, manufacturing – both high- and low-end – and transportation and warehousing. However, the region itself has some formidable, internal competition for the same kinds of businesses. There are 300+ biotechnology/biopharmaceutical companies in Massachusetts and many are in the drug development stage. Should they continue to move forward into production, 1600 Osgood Street offers ideal space for their needs. Massachusetts is also home to numerous medical device manufacturers. The amenities and technology features at 1600 Osgood Street would be a distinct advantage to these firms. For Ozzy Properties, the challenge will be to lure them away from well-established biotechnology centers in Burlington, Cambridge and Lexington. However, the educated and plentiful labor supply in North Andover’s area, the site’s relatively easy access and amenities, and the town’s positive stance toward redevelopment should help to increase the site’s attractiveness. In addition, the site’s proximity to a small airport, major passenger and freight rail lines, and two interstate highways (I-93 & I-495) offer the potential to attract shipping, trade, transportation, and warehousing tenants. Lawrence Municipal Airport, less than one-quarter mile from 1600 Osgood Street, is one of only three airports in the state with both a control tower and a runway longer than 5,000 feet.26 According to Mike Miller, the airport manager, it has the potential to support increased commercial freight and passenger service and can currently support small jet landings.27 The main rail line connecting all points northeast, south, and west runs along the Merrimack River directly behind 1600 Osgood Street. About eight freight trains operated by Guilford Rail System and 14 Amtrak and the Massachusetts Bay Transportation Authority passenger trains pass the site every weekday. Interstate 495 is approximately 3-5 minutes to the north, via the Ward Hill Connector and interchange 48. Interstate 495 connects directly to I-90 to western Massachusetts and New York, I-93 to Boston, and I-95 to Connecticut, Maine and Rhode Island, while Route 213 to the south also connects with I-93 to New Hampshire. A concentrated “Summit Technology campus should be ready by midyear,” The Business Journal,15 January 2004. 25
Mark E. Vogler, “Lawrence need not repeat Fall River's fate,” The Lawrence Eagle Tribune, 3 December 2000. 26
27
Michael Miller, Manager, Lawrence Municipal Airport, 28 May 2004.
Town of North Andover
Community Development Plan
-16-
supply of households, labor and businesses are within easy reach of North Andover, making the location potentially suitable for a regional distribution facility. The Reviviendo Gateway project, a collection of mill buildings totaling 1.2 million ft2 that are being redeveloped across the Merrimack River in Lawrence, could dramatically inflate the supply of office and high-end manufacturing space in the area and pose stiff competition for Lucent’s former plant.28 Lawrence’s project includes reconstruction of the Marston Street interchange to provide direct, easy access to and from I-495, and the construction of an inter-modal transit facility to the south. According to the Merrimack Valley Economic Development Council, MassDevelopment —developer of the site — has not yet released a marketing plan for the space.29 MassDevelopment’s presence in Lawrence could be an asset or a significant liability for Ozzy Properties. On one hand, building the state’s economy with favorable financing for new, emergent and expanding companies has been MassDevelopment’s primary mission for more than a decade. On the other hand, when MassDevelopment acts as both developer and quasipublic lender, its access to financial and political capital gives the agency enormous competitive advantages over private developers. The Lawrence Airport Commission owns land that will be developed as a business park adjacent to the airfield in North Andover – a direct result of North Andover’s own efforts to free up airport property for new business growth. 30 According to airport officials, the park has received all necessary permits and approvals from the town, and the development is expected to commence within the next few months.31 However, the Federal Aviation Administration must first approve disposition of the land and the commission has not yet finalized a marketing plan for the parcels. These projects offer the potential for cooperative marketing and packaging of area sites and amenities. A strategic campaign with amenity packages offering sewer, power, communications, rail transit, air transportation, and tax incentives to target complimentary businesses, could build the necessary mass for a sustainable business community in North Andover’s area. Without this kind of cooperation, it is highly possible that potential tenants will exploit the glut of new space, the result being deflated rental rates across the board. A coordinated and strategic plan for marketing and leasing space in all three developments, improved inter-site transportation including new access roads between the airport and 1600 Osgood Street, and the sharing of resources such as utilities, transportation, warehousing, etc., could yield tremendous economic benefits for the individual property owners and the entire region.
28
“Lawrence Gateway Project,” , 01 June 2004.
29
Robert Halpin, Merrimack Valley Economic Development Council, 1 June 2004.
Under Chapter 57 of the Acts of 2000, the Lawrence Municipal Airport Enterprise Commission has authority to acquire, develop and dispose of surplus land at the airport. The Enterprise Commission’s unusual powers include levying and collecting taxes on parcels sold to private interests, just as a city or town levies taxes on real and personal property. However, the Enterprise Commission will not be a municipal service provider and it will not retain the tax revenue it collects. Instead, its job is to disperse the revenue to Lawrence and Andover under a formula approved by the legislature and the Department of Revenue. 30
31
Michael Miller, 28 May 2004.
Town of North Andover
Community Development Plan
-17-
Eco-industrial development should also be investigated. Eco-industrial parks benefit tenants by encouraging clusters that integrate suppliers and users. In this case, it may make sense to coordinate with both the Reviviendo Gateway developer and the Lawrence Airport Commission. For North Andover, the main benefit of encouraging an eco-industrial park would be higher probability of sustainable economic development: the clustering of customized, interdependent tenants decreases the likelihood that they will relocate operations in the future. However, designing a workable eco-industrial park is challenging and time-consuming, and it requires considerable staying power on the part of any developer. The key is the location of an anchor tenant and designing the facility around that tenant’s material, transportation and energy needs. As a part of the design, it would be essential to streamline the introduction of new tenants and producers.32 Shipping, trade, transportation and warehousing businesses could take advantage of the multimodal options available at 1600 Osgood Street. Improved connections to I-495 southbound via a new bypass road along the riverfront or improved connections to the Ward Hill Connector to the north would significantly improve the marketability of this site. These improvements may be more economically feasible if done in cooperation with the airport commission. There is continuing talk of relocating the existing Bradford commuter rail station and there may be an opportunity to build a new station on the Lucent property. These kinds of access improvements would undoubtedly improve the site’s desirability and viability while limiting traffic impacts on North Andover. Coordinated, transit-oriented land use planning for the area surrounding any proposed rail station would allow developers to best exploit the improved access and provide an accessible ridership pool in the station’s service area. A station at 1600 Osgood Street may not serve existing commuters traveling to Boston because access from I-495 and I-93 south would be poor, as would access from residential areas in North Andover and Haverhill. More likely, the success of any station here would depend on reverse-commuters headed to jobs in the immediate area or new residents of neighborhoods nearby.
32
“Eco-Industrial Parks, A Timely Idea,” , 20 October 2003.
Town of North Andover
2.
Community Development Plan
-18-
ZONING REVIEW
Approximately 10% of North Andover’s total area is zoned for commercial and industrial development. The town has divided its commercial and industrial land into numerous districts, some of which are quite small. When the North Andover Master Plan was completed four years Business & Industrial Zones ago, local officials estimated that the town had Zoning District Acres only 161 acres of vacant, developable or partially Business 1 16.0 developable land available in business and industrial districts. Concerned about the fiscal Business 2 10.8 impacts of rapid residential growth, the Master Business 3 30.5 Plan Committee endorsed one of the major goals Business 4 59.4 of North Andover’s Strategic Planning General Business 136.1 Committee (1997): to restore non-residential Village Commercial 73.3 assessed values to 20% of the town’s total assessed valuation and hold residential values to Industrial 1 309.2 a maximum of 80%. Industrial 2 918.3 Industrial 3 100.5 Since the town had so little vacant, developable
Industrial S 136.9 land left for new industrial growth, the Master Plan Committee argued for decommissioning the Total 1,790.9 Lawrence Municipal Airport and marketing the land for new development. The Committee said that at the very least, town leaders should press for an agreement with Lawrence that would put 52 acres of the airport property back on North Andover’s tax rolls. According to estimates released by the planning department, the 52 acres would support about 304,250 square feet (ft2) of industrial development, or an average of 5,850 ft2 per acre. In retrospect, what is remarkable about the town’s sense of urgency over the airport property is the very low density of development anticipated by the proponents.
The Master Plan also notes that as of the late 1990s, the average amount of industrial development per acre in North Andover was 6,160-9,800 ft2. Translated: the average floor area ratio for industrial uses ranged from .141-.225. The following analysis explores the relatively low intensity of use in North Andover’s industrial zones as an indicator of zoning barriers to highvalue development.
INDUSTRIAL DISTRICTS Most of North Andover’s industrial land is located in the northern end of town, generally between Sutton Street-Osgood Street (Route 125) and the Merrimack River (Map 3). Nearby, there are smaller, industrially zoned pockets between Sutton and Belmont Streets, and between the railroad, Water Street and Walker Road. The remaining industrial land is located in two areas along Route 114: south of the intersection of Routes 125-114, and at the Middleton town line.
Town of North Andover
Community Development Plan
-19-
Until the late 1980s, most of Route 114 was also zoned for industrial use. In 1985, North Andover discovered giardia in Lake Cochichewick, the town’s largest water body and primary drinking water supply. The town developed a watershed management plan and changed the zoning throughout the watershed by doubling the minimum lot area requirement from 40,000 to 80,000 square feet (ft2). At the time, communities across the Commonwealth were highly conscious of so-called “snob zoning,” in part because the state was actively enforcing a 1982 executive order that directed agencies to withhold grants from towns with zoning barriers to new housing growth.33 When North Andover “down-zoned” land to protect Lake Cochichewick, it also rezoned about 450 acres in the southern end of town and created two new districts: Village Commercial and Village Residential. In doing so, North Andover hoped to create a village node in an area that was beginning to grow, and simultaneously protect its decision to reduce future development in the Lake Cochichewick watershed. The town also hoped that developers would pay to extend sewer service southward on Route 114. Toward that end, North Andover inserted an “adequate facilities” policy in the Village Residential bylaw and pledged higher-density development rights to projects that connected to the municipal sewer system. While the town gained an opportunity to provide new neighborhoods with a mix of homes, it also lost 325 acres of industrially zoned land. Data supplied by the assessor’s office suggest that today, there are very few vacant developable parcels in any of North Andover’s four industrial zones. The town has about 91 acres of vacant industrial land with some use potential,34 mainly in the Industrial-1 (I-1) and I-2 districts. Since the parcels are not always contiguous and many are small, estimating buildout capacity by applying the town’s dimensional regulations to 91 acres would distort the actual development yield of the land. However, applying the town’s dimensional and intensity standards to the few larger vacant parcels suggests that zoning itself may act as a barrier to high-value development in North Andover’s industrial districts. Table 4: Summary of Industrial District Dimensional and Intensity Regulations Industrial 1 Industrial 2 Industrial 3 Industrial S Lot Area 80,000 80,000 435,600 50,000 Height 55 55 55 55 Frontage 150 150 150 150 Front Setback 50 50 100 30 Side Setback 50 50 200 20 Rear Setback 50 50 200 50 Floor Area Ratio 0.500 0.500 0.500 0.500 Building Coverage 35% 35% 35% 35% Open Space Source: North Andover Zoning Bylaw, Table 2.
33
Executive Order 215.
North Andover Assessor’s Office, Fiscal Year (FY) 2003 Parcel Database, CD-ROM. The data set received from the town appears to be missing parcels in several use codes, so the 91-acre estimate may be too low. It is 34
Town of North Andover
Community Development Plan
-20-
Except for Industrial-S (I-S), located at the periphery of the downtown area and to the north adjacent to Haverhill, North Andover’s industrial districts limit all uses to fairly large lots. The front, side and rear setbacks for I-1, -2 and -S are conventional, but the setback requirements for development in the I-3 zone are onerous and they effectively place large amounts of land in uneconomic use. While the maximum height for industrial district buildings is reasonable, the building coverage limit of 35% is low. The more disconcerting issues involve North Andover’s unusually low maximum floor area ratio of .50 in all zones, and parking. In addition to the I-S setbacks, a floor area ratio of .50 and sizeable off-street parking requirements place significant constraints on the amount of development that North Andover’s industrial land can accommodate. On a per-acre basis, the town has capped the development yield of its existing industrial zones. These issues should be addressed before North Andover considers rezoning additional land for industrial uses. Although I-1 and I-2 are governed by the same dimensional requirements, they are subject to different use regulations. In some cases, the uses seem to have been crafted for particular sites. This applies to all of the industrial zones, especially to I-3. Table 5 provides a synopsis of North Andover’s industrial district use regulations. The regulations raise several issues, notably: Ÿ
North Andover’s Zoning Bylaw does not classify uses by use groupings, and the uses are not clearly defined. This applies to the entire bylaw, not only the industrial zones, but it is particularly obvious because as written, the industrial uses are quite broad.
Ÿ
The town allows day care centers by special permit, but G.L. c.40A, Section 3, explicitly prohibits communities from requiring a special permit for this use.
Ÿ
Agriculture on parcels of less than five acres (that is, non-exempt agriculture) is a permitted use in all industrial zones. The town may want to reconsider the wisdom of encouraging non-exempt agricultural uses on industrial land.
Ÿ
Restaurants and food service establishments are permitted only as accessory uses, except in the I-S District where they are allowed on a limited basis by special permit. Presumably, the bylaw intends to limit food service establishments to uses such as employee cafeterias in a manufacturing facility. In many communities, restaurant uses are often a permitted use in one or more industrial districts as part of a limited complement of non-industrial uses. Given the location of I-S (near the downtown), it would make sense to reclassify restaurants as a permitted use, even if confined to “lunchroom” or limited-seating restaurants.
Ÿ
Retail is permitted only as an accessory use, and the bylaw limits the total of all accessory uses (which may include restaurants) to a maximum of 10% of a facility’s gross floor area (GFA). It is not clear whether these accessory restrictions apply to retail sale of goods sold primarily at wholesale on the premises.
Ÿ
Research and development (R&D) facilities are permitted in all zones. Although the town may want to attract R&D establishments because they are usually high-value uses, from an economic development perspective it is best to offer R&D an industrial zone that is fairly specialized. A separation from “heavy” industrial, trucking and distribution uses may make North Andover’s industrial property more attractive to the kinds of facilities the town wants to encourage.
Town of North Andover
Community Development Plan
Table 5: Summary of Industrial District Use Regulations35 Use I-1 Art gallery or museum. Y Automobile or other motor vehicle repair. Automobile service station. Bus garage Business, professional and other offices. Y Car wash. Day care center. SP Agriculture. Y Golf course. Y Hotels and motels Light manufacturing. Y Lumber, building materials storage or sales, fuel storage or contractor's yard. Medical center, clinic, or medical laboratory. Y Educational use. Y Parking, other accessory uses customarily Y associated with permitted uses. Place of worship. Y Bank, post office, telephone exchange or telephone business office, local bus passenger station Printing and reproduction. Y Public service corporations. Y Public buildings. Public garages and accessory buildings. Public sanitary disposal site. Public storage of equipment. Research and development facilities. Y Restaurant or diner. Retail food store. Accessory retail and food uses. Y Swimming or tennis clubs, indoor ice skating rinks. SP Veterinary hospitals and kennels. Accessory warehousing and wholesaling. Y
-21-
I-2 Y Y Y Y Y Y SP Y Y Y Y Y
I-3 Y
Y Y Y
Y Y Y
Y
Y
Y Y
Y Y
Y Y Y Y Y Y Y
Y Y
Y
Y SP Y Y
Y
I-S
SP Y Y
SP Y Y
SP Y
Y
Y Y
Y
Y SP SP
Y SP Y
Y
Source: North Andover Zoning Bylaw (2002), 49-54. “Y” means permitted, “SP” means special permitted.
Use descriptions have been condensed and listed alphabetically for table presentation. In some cases the Zoning Bylaw imposes additional restrictions or requirements not listed above.
35
Town of North Andover
Community Development Plan
-22-
COMMERCIAL DISTRICTS
St re
et
Osgood Street
The Village Commercial District is the second largest of six business districts. Together, they include 326 acres of land. There are at least two noteworthy features of North Andover’s commercial zones: first, the districts are scattered broadly across town, often in COMMERCIAL DISTRICTS LUCENT isolated pockets, and second, they are Business 1 TECHNOLOGIES Business 2 randomly mixed. A good example is the Business 3 commercial area on Osgood Street/Route 125 Business 4 General Business south of Holt Road, where several parcels are Village Commercial zoned for commercial use, each in a different d Roa Holt commercial district. Ba r
ke r
According to the North Andover Master Plan, 20 of the town’s then-existing 161 acres of vacant, non-residential land were located LAWRENCE MUNICIPAL in commercial zones. As a result, North AIRPORT Great Pond Road Andover’s commercial districts appeared to be all but “built-out,” i.e., developed to their maximum capacity under current zoning. Since 1997 when the land use analysis was prepared for the Master Plan, vacant commercial land has declined to about 12 acres.36 Table 6 summarizes the town’s dimensional and use intensity regulations for commercial development. Table 6: Summary of Business District Dimensional and Intensity Regulations Requirement Lot Area Height Frontage Front Setback Side Setback Rear Setback Floor Area Ratio Building Coverage Open Space
Business 1
Business 2
Business 3
Business 4
Village Commercial
General Business
25,000 35 125 30 20 30 0.30 30%
25,000 35 125 25 25 30 0.75 35%
120,000 35 300 100 50 50 0.40 30%
80,000 60 200 50 50 50 0.50 25%
90,000 40 200 50 25 25 N/A 25% 25%
25,000 45 125 25 25 35 N/A 35%
Source: North Andover Zoning Bylaw, Table 2.
As with the industrial districts, North Andover’s business district regulations tend to favor a fairly low intensity of use. The Zoning Bylaw anticipates somewhat more variety in business district form, for the small minimum lot size for Business-1 (B-1), B-2 and General Business (GB) differ quite a bit from the larger lot standards for B-3, B-4 and Village Commercial (VC). Given the location of each district, the side and rear setback requirements seem appropriate, but like 36
North Andover Assessor’s Office, “FY 2003 Parcel Records Database.”
Town of North Andover
Community Development Plan
-23-
most communities, North Andover has no maximum front yard setback. As a result, many of its commercial areas outside of downtown are visually and operationally dominated by parking lots. The aesthetic impact of large parking areas is partially attributable to their proximity to the road and partially to North Andover’s off-street parking regulations, which impose “high-side” parking requirements on commercial (and industrial) uses. This is a common problem in many communities, and it stems from industry standards that equate minimum parking needs with maximum-demand conditions, e.g., the number of cars a shopping center might attract right before Christmas. Today, national and regional chain stores often propose very large parking lots even in zones with reasonable parking standards because they want to convey the impression of adequate, convenient parking to people driving by their establishments. Another similarity between the commercial and industrial districts is the low floor area ratio that North Andover assigns to four of its business zones. There is no FAR standard in the VC and GB Districts, but B-1, B-3 and B-4 impose fairly low caps on commercial development. The standard for B-2, .75, more closely approximates an intensity of use that can generate high-value commercial development on a per-acre basis, but the B-2 District applies to small, unconnected parcels in only a few areas of North Andover, primarily on Osgood Street. Even though higherdensity commercial development is attainable on lots in the B-2 District, North Andover’s parking requirements reduce the feasibility of developing a B-2 site with a structure that meets the building coverage, height and FAR regulations. For example, a retail establishment at the maximum FAR on a conforming lot in the B-2 District would require about 94 parking spaces, 9’ x 18’ each. To achieve the maximum FAR, the structure would have to take advantage of the maximum building coverage of (35%) because the height limit for the district is 35 feet. After deducting the total area consumed by the building footprint (coverage) and 94 parking spaces, a 25,000 ft2 lot would be left with slightly more than 1,000 ft2 of area, with no provision for driveways, landscaping and pedestrian walkways. Despite minor dimensional and density differences between B-1 and B-2, the permitted uses in these zones are not the same (see Table 7). Considering allowed and special permitted uses in all six districts, B-1 is more like B-4 than the other zones while B-2, B-3, VC and GB are functionally similar. It is clear from the zoning map and discussions with local officials that many parcels in North Andover’s commercial districts are the product of incremental rezoning, such as changes initiated by citizen petition. Downtown North Andover has the traits of “pre-zoning” commercial centers, including its mix of uses, the close proximity of the building line to the street, and a density that is more urban than any other business area in town. In contrast, the VC District is obviously a planned district: its location, shape, and dimensional and density regulations, which encourage larger parcels, fewer curb cuts and three-story buildings, all point to contemporary suburban planning standards. The most obvious sign of suburban land use controls is North Andover’s approach to front setbacks. Even VC imposes a substantial front yard requirement of 50 feet – a setback that hardly encourages “village” design. Providing multiple commercial districts makes sense when a community wants to achieve a particular shape as it continues to develop. Promoting village centers is a classic example of a shaping objective that calls for thoughtfully conceived use and dimensional regulations tailored to the center’s location and size, and the character of the area that surrounds it. Multiple commercial districts without clear planning objectives, such as the seemingly random placement of B-4 zoning along Route 114, the broadly dispersed GB zones, and pockets of B-2 zoning created on a site-by-site basis, do not achieve coherent planning outcomes.
Town of North Andover
Community Development Plan
Table 7: Summary of Commercial District Use Regulations Use B-1 B-2 B-3 Accessory restaurant, food services. Y Agriculture. Y Y Y Art Gallery. Y Y Y Auto repair, body shop Automobile service station. Y Y Day care center. SP SP SP Educational use. Y Y Y Funeral parlor. Y Hall, club, theater, other place of amusement of assembly. Hotel Indoor amusement, assembly. Y Y Medical center, clinic, laboratory. Y Y New car sales. Y Nursing and convalescent homes. Offices, banks. Y Y Y Parking, indoor storage, other Y Y Y accessory uses. Personal service establishments. Y Y Y Place of worship. Y Y Y Printing and reproduction. Y Y Public building. Y Y Y Public parking garage. Y Y Public service corporation. Y Y Y Research and development facilities. Y Residential: multifamily, townhouse. SP Residential: one and two family Y homes, apartments. Residential: not more than 50% of Y structure. Restaurant, lunchroom. Y Y Retail bakeries and confectionaries. Retail establishments. Y Y Y Swimming and/or tennis clubs. SP SP SP Taxi depot Y Y Wholesale establishments.
-24-
B-4 Y Y Y
SP Y
VC
GB
Y
Y
SP
Y Y SP
Y
Y Y
Y Y Y Y Y Y
Y Y Y
Y
Y
Y
Y Y
Y Y Y
Y Y Y
SP Y
Source: North Andover Zoning Bylaw (2002), 42-49. “Y” means permitted, “SP” means special permitted.
Town of North Andover
Community Development Plan
-25-
North Andover’s commercial district use regulations could be improved with clear definitions and use groupings. Most likely because of bylaw amendments made over time, the lists of allowed and special permitted uses in the Zoning Bylaw refer to uses that seem to have the same meaning even though they are worded differently. For example: Ÿ
In the VC and GB Districts, permitted uses include “hall, club, theater, or other place of amusement of assembly,” while the phrase “indoor place of amusement or assembly” appears in the list of permitted uses for B-2 and B-3. These uses are not defined in the Zoning Bylaw, so it is not clear whether the town means to differentiate the kinds of indoor entertainment or assembly establishments allowed in each district.
Ÿ
All districts except B-4 permit “retail establishments,” but “retail” for GB and VC includes a more extensive list of examples, including “retail bakeries or retail confectionaries.” Since these uses are not explicitly mentioned elsewhere, it is not clear whether the town intends to prohibit them in B-1, B-2 and B-3.
Grouping uses according to a set of consistent criteria helps to identify uses that may create incompatibility problems, uses that make sense to encourage in one district over others in order to create business clusters, or uses that could be regulated more effectively if they required a special permit when they exceed a certain size. There are potential use incompatibility concerns in North Andover, but from an economic development perspective there are also strategic issues caused by the inclusion or omission of certain uses in the business districts. For example: Ÿ
North Andover encourages research and development facilities in all four industrial districts and two business districts: B-3 and B-4. The prevalence of this use in North Andover’s zoning suggests a strong desire by the town to promote high-end industrial development. However, B-4 exists in scattered locations on Route 114 and the only B-4 area with a recognizable district form is at the intersection of Andover Street (Route 125), Peters Street (Route 133) and Turnpike Street (Route 114) by the Andover town line.
Ÿ
“Personal service establishment” is a standard feature of business zones in downtown and neighborhood business districts. As defined in the Zoning Bylaw, a personal service establishment provides “personal services to the public such as shoe repair, barbering, dry cleaning, etc.” Ironically, the General Business District use regulations omit personal services establishments, yet GB is the town’s largest business district and it includes Downtown North Andover. One would imagine that the town does not intend to prohibit a barber shop in Downtown North Andover, but since the bylaw explicitly recognizes “personal service establishments” in B-1, B-2 and B-3, a literal reading suggests that barber and shoe repair shops are not allowed in the downtown area.
Ÿ
In several ways, the regulations for B-4 seem to anticipate an industrial zone more than a commercial zone. Not only does B-4 allow research and development facilities by right, but also it prohibits traditional commercial uses such as retail and food service establishments except as accessory uses.
Ÿ
North Andover’s Zoning Bylaw conspicuously omits purpose statements for all of its zoning districts. In the absence of purpose statements, one must look to permitted uses, density and development regulations and try to infer a community’s goals. The mix of uses in North
Town of North Andover
Community Development Plan
-26-
Andover’s commercial and industrial zones conveys a blurred image of what the town hopes to accomplish, both for its land use pattern and the composition of its local economy. Ÿ
North Andover has no policies in place to regulate or restrict “big box” commercial development.
Ÿ
The use and dimensional regulations for development in the GB District may be appropriate in many locations, but they do not reflect the established pattern of development or mix of uses in Downtown North Andover. The lack of development tools for an environment like the downtown area is a significant weakness in North Andover’s Zoning.
RECOMMENDATIONS Ÿ
Ÿ
Consolidate and reorganize the Business and Industrial Districts, considering the conceptual alternatives illustrated in Map 4. Objectives: Ÿ
To simplify and clarify North Andover’s Zoning Bylaw.
Ÿ
To increase the value of existing business and industrial property, wherever possible.
Ÿ
To encourage new investment and reinvestment in North Andover’s commercial and industrial land.
Ÿ
To promote sensible economic development.
Ÿ
To promote Smart Growth.
Proposed New/Replacement Districts Ÿ
Ÿ
Ÿ
Commercial Zoning Districts Ÿ
Downtown Business District
Ÿ
Neighborhood Business District
Ÿ
Commercial Business District
Industrial Zoning Districts Ÿ
Industrial-137
Ÿ
Industrial-2
Transitional Business District
Proposed Industrial-1 is very similar to North Andover’s existing Industrial-2. The more significant changes involve the mix of industrial uses in proposed Industrial-2. See Map 4.
37
Town of North Andover
Ÿ
Community Development Plan
-27-
Related Zoning Amendments Ÿ
Add to Section 4 of the Zoning Bylaw a new subsection, “Uses and Use Groupings.” Provide brief definitions of uses and group them by impact or density classes. For example, “Group 1 Residential Uses” might include detached single-family dwelling, accessory dwelling, and two-family home,” while “Group 2 Residential Uses” could include multi-family dwelling (buildings of 3+ units) or townhouses up to five units/acre, or accessory residential dwellings in a mixed-use building.” “Group 3 Residential Uses” could include multi-family or townhouse dwellings at a density greater than five units per acre or any multi-family or townhouse development of more than 100 units,” and “Group 4 Residential Uses” could include institutional-residential facilities such as college dormitories, assisted living facilities, or nursing homes.” This method of grouping uses enables communities to simplify the way they refer to permitted, special permitted or prohibited uses elsewhere in a zoning bylaw, and it helps to determine the requirements that should apply to “related uses” not explicitly identified but clearly intended within the meaning of the bylaw.
Ÿ
Provide “campus-style” industrial development regulations for industrial parcels of 10 or more acres.
Ÿ
Allow modest frontage waivers and/or a higher FAR by special permit in the Neighborhood and Commercial Districts in exchange for: Ÿ
Access management: shared driveways and shared parking area or structured parking facility serving two or more commercial sites.
Ÿ
For redevelopment projects, reduce or eliminate existing front parking and relocate parking areas to the side and rear of a site.
Ÿ
Sub-grade parking (for which a height waiver may also be required in Neighborhood Business.
Ÿ
Developer contribution to a community facilities fund, based on a fee schedule established by the town pursuant to its capital improvements plan, for sidewalks, landscaping, lighting, pedestrian/bicycle and other amenities in the business districts.
Ÿ
Prohibit parking between the street and the front of new commercial buildings and reduce minimum front yard setback requirements in all commercial districts.
Ÿ
Require wide sidewalks particularly in Neighborhood Business District developments wherever feasible, or allow the developer to pay a fee in lieu of sidewalks to a community facilities fund.
Ÿ
Allow a higher FAR and modest increase in building coverage in the Industrial-1 and Industrial-2 Districts in exchange for a significant reduction in surface parking area by providing sub-grade parking or a structured parking facility.
Ÿ
Adopt design guidelines for commercial and industrial development, and incorporate architectural design review into the Site Plan Review process.
Town of North Andover
Community Development Plan
-28-
Ÿ
Establish a maximum gross floor area (GFA) for commercial uses in the (proposed) Downtown Business and Neighborhood Business Districts, and a GFA threshold over which a special permit would be required for commercial uses in the Commercial Business District. Include large-scale commercial development design requirements in the special permit granting criteria.
Ÿ
Encourage two-family homes, multi-family dwellings and accessory dwellings in commercial buildings, especially in the Downtown Business and Neighborhood Business Districts. For vertical mixed-use buildings, increase the maximum GFA for accessory residential uses to 65% from the existing 50%.
Ÿ
Eliminate the “Fiscal Impact” submission currently required under Site Plan Review. Fiscal impact may be an appropriate consideration when reviewing a proposed use, but Site Plan Review is not a review procedure for use. Rather, it is a review for the design, public safety, public utilities and operational features of a proposed development. The town could not reject a site plan submission on the basis of a fiscal impact analysis, so requiring the developer to supply one seems excessive.
Ÿ
Institute a minimum requirement for open space as a percentage of lot area in all commercial and industrial districts except the Downtown Business District.
Table 8: Recommended Dimensional and Intensity Regulations Standard Lot Area Height Frontage Front Setback Side Setback Rear Setback Floor Area Ratio Building Coverage Open Space % Lot Area
Downtown Business 10,000 40 50 N/A 20 20 1.25 50% N/A
Neighborhood Business 25,000 45 125 20 25 35 1.00 40% 20%
Commercial Business 80,000 60 200 25 25 25 1.25 35% 20%
Standard
Industrial 1
Industrial 2
80,000 55 150 50 50 50 1.50 35% 25%
217,800 55 150 100 200 200 1.00 35% 30%
Transitional Business 50,000 60 150 30 20 50 1.50 35% 20%
Lot Area Height Frontage Front Setback Side Setback Rear Setback Floor Area Ratio Building Coverage Open Space % Lot Area
Town of North Andover
Community Development Plan
-29-
Table 9: Recommended Off-Street Parking Regulations Use Minimum Required Number of Parking Spaces Residential Uses Single-family or two-family dwelling 2 per unit 3 or more units (multi-family) 2 per units of two+ bedrooms 1.5 per one bedroom 1 per studio unit Over-55 housing 1.5 per unit Assisted living facility 0.5 per unit, plus 1 per employee on each shift Congregate living residence .75 per unit Other housing 1 per sleeping room for single or double occupancy Nursing home 1 per three rooms, plus 1 per employee on each shift Non-Residential Uses Auditorium, convention hall 1 per three seats, plus 1 per two employees Theatre 1 per four seats or 10 spaces per 1,000 NLA Restaurant 1 per 4 seats, 1 per employee on each shift Retail, store, personal or business service 4 spaces per 1,000 ft2 NLA, up to 120,000 ft2 NLA; 4.5 spaces per 1,000 ft2 NLA over 120,000 ft2 NLA 5 per 1,000 ft2 NLA for convenience stores Office 1 per 250 ft2 NLA on ground floor; 1 per 300 ft2 NLA in the basement and upper stories Industrial or manufacturing facility 1 per 500 ft2 for first 25,000 ft2 NLA; 1 per each 650 ft2 portion of building between 25,000-50,000 NLA; 1 per each 800 ft2 NLA for portion of building exceeding 50,000 ft2 NLA Medical office or research facility One per 500 ft2 NLA Hotel 0.9 per room, plus one additional parking space for each three employees, 75% of the requirement for other uses associated with the establishment Notes Ÿ Provide authority to the Planning Board to reduce or waive off-street parking requirements for development in Downtown North Andover in exchange for “in-lieu-of” payments to an Off-Street Parking Fund. Ÿ
Establish a workable, clear formula for determining parking requirements in mixed-use developments, e.g., 100% compliance for the use with the largest parking requirement and 75% for all other uses.
Ÿ
Adopt parking lot design standards comparable to existing requirements for the Village Commercial District.
Ÿ
Allow a modest amount of parking in front of commercial buildings only in exchange for some public benefit, such as a distinctive pedestrian walkway design, additional landscaping and screening, or for a mixed-use development that includes affordable housing units.
Ÿ
Through site plan review, establish minimum requirements for bicycle facilities.
Town of North Andover
Community Development Plan
-30-
Table 10: Recommended Commercial District Uses Use Groups & Uses
DB
NB
CB
Site Plan Review
EXEMPT USES Agriculture on 5+ acres of land. Public or non-profit educational uses. Religious uses. Day care center.
Y Y Y Y
Y Y Y Y
Y Y Y Y
N Y Y Y
RESIDENTIAL USES Detached single-family dwelling. Two-family dwelling. Multi-family dwelling or townhouse. Residential mix with business, up to 65% GFA.
N Y SP Y
N SP SP Y
N N SP SP
----Y Y
COMMERCIAL USES Public Services Public service corporation. Government use. Public parking garage.
Y Y Y
Y Y N
Y N N
Y Y Y
Y
Y
Y Y
Y
Y Y Y Y Y Y
Y Y Y Y N Y
Y Y Y SP Y Y
Y Y Y Y
SP
SP
Y
Y
Retail Uses Food items: confectionery, dairy products, fruits, vegetables, groceries and meats. Baked goods, manufacture of same for sale. Dry goods, variety merchandise, crafts. Clothing and clothing accessories. Hardware, household appliances. Household furniture, furnishings, supplies. Stationary, pharmaceuticals, photographic supplies, bookstore or newsstand. Video tape rental & sales, equipment.
Y
Office, Banks & Related Uses Office for dental, architectural, engineering, legal, medical, and similar professions. Real estate, insurance, general office Bank, with or without drive-through facility ATM in kiosk, drive-up access only.
Y
Y
Y
Y
Y Y N
Y Y N
Y Y Y
Y Y Y
Medical & Related Facilities Medical center, clinic or medical laboratory. Hospital. Nursing home or convalescent home.
N N N
Y N SP
Y Y Y
Y Y Y
Town of North Andover
Community Development Plan
-31-
Table 10: Recommended Commercial District Uses Use Groups & Uses Food Service & Hospitality Uses Restaurant: service inside or outside but on premises, e.g., tables on deck or patio. Take-out food establishment, delicatessen or catering service, no drive-through. Food service with drive-through. Bed and breakfast. Hotel, motel.
DB
NB
CB
Site Plan Review
Y
Y
Y
Y
Y
Y
Y
Y
N Y N
N Y N
SP N SP
Y Y Y
Y Y
Y Y
Y SP
Y Y
Personal & Business Service Establishments Barber or beauty shop Shoe/ hat repair, bicycle or household appliance repair, laundry, dry cleaning, pressing, tailor shop with no work done on premises for retail outlets elsewhere. Shop for custom work, manufacture of articles to be sold on premises. Shop of contractor or tradesperson. Mortuary and funeral home. Printing business.
Y
Y
N
Y
Y N N
Y N N
N SP Y
Y Y Y
Cultural & Entertainment Uses Art gallery, museum Cinema or theatre. Hall, club, or other place of assembly. Indoor recreation or amusement facility.
Y Y Y N
Y Y Y SP
Y Y Y Y
Y Y Y Y
N
SP
Y
Y
N N N
SP N N
SP Y Y
Y Y Y
Y
Y
Y
Y
Y
N
Y
Y
Y Y Y
Y Y Y
N Y Y
--Y Y
Auto-Related Uses Auto service (filling) station, with or without convenience store. Auto repair, body shop. Auto sales, no outdoor sale of >10 used cars. Car wash Transportation Related Uses Transportation service, e.g., taxi depot, train station Commercial parking garage. Accessory Uses Home occupation Structured parking garage Incidental, enclosed storage
Town of North Andover
Community Development Plan
-32-
Table 11: Recommended Industrial & Transitional Business District Uses. Use Groups & Uses I-1 I-2
TB
EXEMPT USES Agriculture on 5+ acres of land Public or non-profit educational uses Religious uses Day care center Government use
Site Plan Review
Y Y Y Y Y
Y Y Y Y Y
Y Y Y Y Y
Y Y Y Y
Y Y
N Y
SP Y
Y Y
INDUSTRIAL USES Research & development, associated offices. Light manufacturing & offices for the following types of industries:38 Electronic and electrical products. Robotics and precision instruments. Computer related products. Instruments and related products. Furniture and fixtures. Millwork manufacturing. Primary and fabricated metal industries. Machinery. Transportation equipment. Apparel manufacturing. Food manufacturing, e.g., beverage and bottling companies, specialty or frozen food manufacturing, fruit & vegetable canning, dairy product manufacturing, baked goods, perishable foods, but not including animal slaughtering or processing. Warehousing and distribution. Printing and publishing. Contractor’s yard Wholesale/retail sale of lumber, wood products. Recycling center Commercial waste disposal facility
Y Y Y Y Y N N N N N N
Y Y Y Y Y Y SP SP SP Y Y
Y Y Y Y Y SP SP SP SP Y SP
Y Y Y Y Y Y Y Y Y Y Y
SP Y N N SP SP
Y Y Y Y SP SP
SP Y Y Y N SP
Y Y Y Y Y Y
TRANSPORTATION RELATED USES Train station, bus terminal. Commuter parking facility.
Y Y
Y Y
Y Y
Y Y
These industries are intended to represent types of manufacturing operations. The building commissioner should determine whether a proposed manufacturing use is sufficiently similar to comply with zoning. 38
Town of North Andover
Community Development Plan
-33-
Table 11: Recommended Industrial & Transitional Business District Uses. Use Groups & Uses I-1 I-2 COMMERCIAL USES Health club, indoor athletic facility. Trade school, professional or other school conducted as a commercial business. Professional, business or medical offices, clinic. Veterinary clinic or animal hospital Retail Uses Food items: confectionery, dairy products, fruits, vegetables, groceries and meats. Baked goods, manufacture of same for sale. Dry goods, variety merchandise, crafts. Video tape rental & sales, equipment. Hospitality & Food Service Uses Hotel, motel, inn Convention or conference center Restaurant: service inside or outside but on premises, e.g., tables on deck or patio. Take-out food establishment, delicatessen or catering service, no drive-through. Adult entertainment uses. Accessory Uses39 On-site resident watchperson’s quarters. Parking, including structured parking. Incidental storage. Food service, retail, other services primarily for employees and customers of primary establishment.
39
TB
Site Plan Review
Y N
Y SP
Y Y
Y Y
Y Y
Y Y
Y Y
Y Y
N
N
Y
Y
N N N
N N N
Y SP SP
Y Y Y
Y Y N
Y Y N
Y Y SP
Y Y Y
N
N
SP
Y
N
SP
N
Y
Y Y Y Y
Y Y Y Y
Y Y Y Y
Y Y Y Y
Accessory uses would be included in the Site Plan Approval process for the principal use.
Town of North Andover
Community Development Plan
-34-
North Andover Master Plan The North Andover Master Plan identifies six economic development goals: Ÿ
Increase the tax base in order to shift our tax burden from residential to commercial and industrial uses.
Ÿ
Promote the highest and best use of the Lawrence Municipal Airport property in order to maximize benefits to the Town of North Andover and City of Lawrence.
Ÿ
Promote clean, industrial development consistent with the character of North Andover.
Ÿ
Encourage economic development on Routes 114 and 125 while resolving land use, traffic, and circulation conflicts.
Ÿ
Strengthen and sustain downtown’s role as the business, civic, social, cultural, and governmental center of North Andover.
Ÿ
Establish small, neighborhood service centers in residential areas.
These goals remain appropriate for the Town. The Community Development Plan supports them in the following ways: Ÿ
Except for the recent agreement between Lawrence and North Andover to redevelop a portion of the Lawrence Airport property, it is unlikely that North Andover will be able to rezone more land for commercial and industrial use. Moreover, zoning additional land for non-residential development may perpetuate sprawl and effectively reduce the fiscal advantages that North Andover hoped to achieve when the Master Plan was completed four years ago. The Community Development Plan recommends that North Andover focus on encouraging higher-density development in established commercial and industrial areas, providing adequate public facilities for economic development (such as public parking), and working with the owners of 1600 Osgood Street (Lucent Technologies) to support the site’s redevelopment.
Ÿ
The Community Development Plan recommends changing the existing zoning for Downtown North Andover (GB) to a new district, the Downtown Business District.
Ÿ
The Community Development Plan recommends zoning incentives to encourage shared access and shared parking in commercial districts along Route 114 and Route 125.
Ÿ
The Community Development Plan does not recommend zoning more land for neighborhood service districts; it does recommend consolidating existing neighborhood business nodes under a common set of use and dimensional regulations with somewhat more use-intensive development opportunities than the town currently offers.
Strategy Paper
HOUSING A community’s physical evolution from hamlet to modern suburb is revealed by the styles, age and location of its homes. Housing plays a crucial role in shaping the visual and social character of cities and towns, yet the recurring irony about housing is that most residents think their communities already have too many homes. Concerned about losing open space and financing the cost of public schools, citizens and town officials seek ways to contain housing growth, but in many cases the techniques they choose bring unintended – and unwanted – consequences. Today, town planning faces several challenges that stem, directly and indirectly, from concerns about residential development. One of these challenges involves housing choice: the degree to a community’s regulations encourage housing styles, sizes and prices that meet the needs of current and future households. However, market demand holds more sway than any other factor, including zoning, over the types of homes that are built. As a result, even in communities that have zoned to provide housing choice, the market often bows to cultural values that make single-family homes the preferred way of life for most Americans in non-urban areas. Accordingly, another challenge is whether communities that want a mix of homes should move beyond their traditional role as regulators and become activists in the realm of housing production. Both of these challenges seem to exist in North Andover, a desirable, rapidly growing suburb on the northern arc of I-495. Over time, North Andover has zoned to provide for varied types and densities of housing development, to guide growth away from Lake Cochichewick, to encourage village density and development patterns along Route 114, and to preserve open space in new subdivisions. The town has also adopted zoning to control growth impacts by requiring developers to phase their projects and by limiting the number of homes that can be built each year. Like other communities that seek to plan for their future, North Andover faces difficult housing policy choices that relate to all other aspects of managing growth and change. A community influences the make-up of its population by the choices it makes to regulate housing growth, and North Andover is no exception. Since 90% of North Andover’s land is zoned for residential development, housing is a major public policy issue for the town.
HOUSING TRENDS North Andover’s identity is indelibly shaped by its homes. Though most of the town’s new housing units are large, spacious, expensive single-family residences, North Andover has a striking inventory of older multi-family housing units, modest one- and two-family homes and late-20th century apartments and condominiums. While a majority of the town’s housing stock is comprised of single-family homes, North Andover is refreshing among suburban communities for its degree of housing choice.
Physical Characteristics of Housing Stock North Andover’s 9,943 housing units represent a broad range of residential use types. Table 12 shows that more than 40% of the town’s housing inventory consists of multi-family homes and
Town of North Andover
Community Development Plan
-36-
apartments. In terms of housing stock diversity, North Andover exceeds all other suburbs and small towns in the immediate region. Table 12: Composition of Housing Stock, North Andover & Region
Community
SingleFamily Homes
Type of Structure 2-4 Unit 5-9 Unit 10+ Units
Other % SingleFamily
Andover Boxford Georgetown Haverhill Lawrence Methuen Middleton NORTH ANDOVER North Reading Topsfield Wilmington
8,474 2,442 2,309 10,107 4,771 10,307 1,719 5,609 4,029 1,842 6,368
1,152 97 249 8,746 14,269 4,237 366 2,099 312 224 490
351 65 40 1,658 2,165 608 108 652 30 47 50
1,576 6 18 3,191 4,360 1,727 136 1,570 451 23 244
37 0 0 35 36 6 18 13 48 8 6
73.1% 93.6% 88.3% 42.6% 18.6% 61.0% 73.2% 56.4% 82.7% 85.9% 89.0%
Regional Inventory North Andover %
57,977 9.7%
32,241 6.5%
5,774 11.3%
13,302 11.8%
207 6.3%
52.9%
Source: Census 2000, Summary File 3, Table H-30.
Homes in North Andover are generally in good condition. More than 80% of the town’s entire housing inventory was built after 1940, and neither federal census data nor local records indicate evidence of overcrowding or serious substandard conditions. A recent lead paint screening report by the Massachusetts Department of Public Health shows a 0% incidence rate among children living in North Andover.
Housing Market Most of the state’s high-growth communities are nestled between Boston’s two circumferential highways, Route 128 and I-495, and on Cape Cod and the Islands. Owing to its location along the northern arc of I-495, North Andover is among several communities that began to grow rapidly when the interstate highway was completed during the 1960s. Although Merrimack Valley home prices are somewhat lower than prices in high-growth towns along the I-495 corridor west and south of Boston, communities throughout Eastern Massachusetts have been pressed to house new families at a pace that surpasses the rate of new-home production, and North Andover is no exception.
Town of North Andover
Community Development Plan
-37-
Homebuyers. Much like watersheds, housing markets are not limited by municipal boundaries. Market choices are made on the basis of household income – what a buyer can afford – while factors such as public school quality, commute distance and convenient highway access narrow the field. Ultimately, homebuyers MARKET AREA HOUSEHOLDS may investigate homes for sale in a (Source: Census 2000) cluster of towns that seem more or less equal in terms of their 41.4% advantages. The preferences of North Reading 78.3% homebuyers, developers and the communities themselves, by the choices they make to zone land, 41.5% Middleton 76.5% converge to shape housing demand and supply characteristics at local and sub-regional levels. 37.6%
NORTH
North Andover is part of a subregional market that includes communities such as Andover, Middleton and North Reading: towns with demographically similar home seekers and overlapping range of housing prices. Despite important differences between them, these communities bring several qualities to the market: high-quality school and town services, access to regional employment, a housing inventory comprised mainly of single-family homes, and home prices that, while high, are affordable to a broader mix of homebuyers than the BoxfordTopsfield market area. A majority of the subregion’s new homebuyers are upper-middle income families who have, or will have, school-age children, as the Department of Education recognized in a recent study of statewide school enrollment growth (1999).
72.3%
ANDOVER 40.5%
Andover
75.7%
0%
20%
% Family Households
40%
60%
80%
100%
% Households w/ Persons<18
HOME VALUES IN 2000 (Source: Census 2000)
North Reading
Middleton
NORTH ANDOVER
Andover
$100
$200
$300
$400
$500
Market conditions throughout S ingle-Family Home Values (in $100,000) Eastern Massachusetts can be Lower-Quartile Median Upper-Quartile traced to a complex weave of federal and state policies: interstate highways that opened once-rural areas to new growth, housing policies that siphoned investment away from cities, and public finance policies that sway municipalities to attract business growth in exchange for the promise of tax revenue. Current
Town of North Andover
Community Development Plan
-38-
residents of North Andover’s sub-region may lament recent growth rates, but few people in any of these communities remember when the populations of North Reading and Middleton were virtually equal (c. 1940). The early 1960s completion of I-495 caused North Andover’s population to grow by 85% over the course of two decades, and more than 60% of the subregion’s owneroccupied housing units today were built since 1960, as shown in Table 13. Table 13: Age of Housing Stock & Owner-Occupied Housing Units Year Built Andover NORTH Middleton ANDOVER All Homes 1990-2000 1980-1989 1970-1979 1960-1969 1950-1959 1940-1949 1939 or earlier Total % Built 1960-1980 % Built 1980-2000 Owner-Occupied Homes 1990-2000 1980-1989 1970-1979 1960-1969 1950-1959 1940-1949 1939 or earlier Total % Built 1960-1980 % Built 1980-2000
North Reading
Sub-Region
1,195 1,608 1,762 1,775 1,464 526 3,260 11,590 30.5% 24.2%
1,401 1,599 2,088 1,552 931 545 1,827 9,943 36.6% 30.2%
578 488 270 178 238 170 425 2,347 19.1% 45.4%
728 688 614 764 1,103 282 691 4,870 28.3% 29.1%
3,902 4,383 4,734 4,269 3,736 1,523 6,203 28,750 31.3% 28.8%
961 1,225 1,492 1,540 1,309 368 1,996 8,891 34.1% 24.6%
1,195 1,318 1,314 1,043 752 362 1,089 7,073 33.3% 35.5%
547 453 213 126 194 134 307 1,974 17.2% 50.7%
710 613 488 625 1,008 282 611 4,337 25.7% 30.5%
3,413 3,609 3,507 3,334 3,263 1,146 4,003 22,275 30.7% 31.5%
Source: Census 2000, Summary File 3, Tables H34, H36.
As the youngest of the “Baby Boomers” began to form new households a decade ago, they sought suburban housing: most of them had been suburban children, and a large percentage of the state’s highest-paying jobs are in suburban locations. In Massachusetts, the housing pipeline was poorly equipped to handle new demand for homes, for the state’s 8.7% growth in households (1990-2000) was met by only a 6% increase in housing units. Table 14 shows that the same trend occurred throughout North Andover’s market area, for the rate of household growth consistently exceeded the rate of housing unit growth. In all but Middleton, the rate of household growth also surpassed the rate of population growth. Households – not population – create housing demand. North Andover’s low homeownership vacancy rate of .4% indicates that properties for sale move quickly and that the level of market demand surpasses the available supply of homes. Throughout the 1990s, the median sale price of single-family homes increased by 70%. North
Town of North Andover
Community Development Plan
-39-
Andover has become a “buy-up” market: a desirable community that attracts second-time homebuyers. For many, “buy-up” means a new or larger house that needs little improvement. However, North Andover also offers older, more affordably priced homes that increase significantly in value with investment in renovations, an addition or modernization. For every new single-family home permit issued in North Andover during the 1990s, about 6 permits were issued for substantial home improvement projects: expansions, second-story additions, and major investments in remodeling.40 Both new-home construction and re-investment in residential properties have contributed to the 48% increase in North Andover’s single-family home values since 1999.41 Table 14: Population, Household and Housing Unit Growth, 1990-2000 Measurement Andover NORTH Middleton North ANDOVER Reading Population 1990 29,151 22,792 4,921 12,002 2000 31,247 27,202 7,744 13,837 % Change 7.2% 19.3% 57.4% 15.3% Households 1990 10,429 7,893 1,828 4,072 2000 11,305 9,724 2,305 4,795 % Change 8.4% 23.2% 26.1% 17.8% Housing Units 1990 10,892 8,271 1,907 4,176 2000 11,590 9,943 2,347 4,870 % Change 6.4% 20.2% 23.1% 16.6%
Market Area
68,866 80,030 16.2% 24,222 28,129 16.1% 25,246 28,750 13.9%
Source: Census 2000, SF File 1, Table DP-1; 1990 Census, Summary File 1, Table DP-1.
Renters. North Andover’s rental market area extends across a dozen communities in a triangle formed by I-95, I-93 and I-495. Both regionally and statewide, the scarcity and cost of rental housing give prospective renters limited choice. In some towns, rental housing is comprised of many age-restricted units, such as elderly housing owned by housing authorities or private investors, making portions of the rental inventory unavailable to a larger market of tenants. Furthermore, the needs of tenants vary considerably: young citizens looking to establish their independence, new families who need a short-term rental while they search for home to buy, senior citizens who no longer want the burden or expense of homeownership, and households that cannot afford to buy a home or simply prefer to rent. In short, the “demand” side of the rental housing market is hardly uniform. As for the supply side, at least four conditions exist in North Andover’s area: the inventory is fairly diverse, expensive in relation to renter incomes, older than the supply of homeownership units, and vulnerable to homeownership conversion. North Andover Annual Town Reports, 1990-2000. See Reports of Building Inspector. Data compiled by author. 40
Mass. Department of Revenue, Municipal Data Bank [database online] “Average Single-Family Tax Bill,” in EXCEL file format as “bill98.xls” sequentially through “bill03.xls,” available at , INTERNET [cited January 2002; January 2003].
41
Town of North Andover
Community Development Plan
-40-
By policy, North Andover and most towns nearby discourage multi-family housing by limiting residential uses to single-family homes or allowing attached units at a density high enough to attract some condominium development but not high enough to attract rental development. Very few rental units have been added to the regional housing inventory since the 1980s, yet many communities absorbed significant residential growth during the past decade. Table 15 shows that regionally, 5.4% of all renter-occupied housing was built between 1990-2000 while 68.9% predates 1970. Lawrence, Haverhill and Methuen account for nearly 81% of the rental units, followed by Andover and North Andover with 13.5%.42
Andover Boxford Georgetown Haverhill Lawrence Methuen Middleton NORTH ANDOVER North Reading Topsfield Wilmington
2,414 72 350 9,138 16,594 4,640 331 2,651 458 232 678 37,558
194 0 18 507 729 112 27 177 13 0 246 2,023
346 24 57 851 1,658 679 35 253 40 47 32 4,022
Pre-1970
1970-1980
1980-1990
1990-2000
Table 15: Rental Housing Characteristics in North Andover Market Area Year Built Community RenterOccupied Units 251 0 100 1,361 2,173 751 52 721 126 66 50 5,651
1,623 48 175 6,419 12,034 3,098 217 1,500 279 119 350 25,862
% SingleFamily Homes
% Apt. Buildings of 10+ Units
13.9% 48.6% 28.3% 5.0% 3.4% 10.2% 28.1% 5.6% 18.1% 21.6% 41.3% 7.0%
45.2% 8.3% 5.1% 29.6% 25.0% 30.4% 2.4% 40.3% 48.9% 9.9% 31.1% 29.1%
Source: Census 2000, Summary File 3, Tables H30, H32.
Regardless of any other factors that may differentiate renter households in North Andover’s area, they have at least one challenge in common: the high cost of housing in relation to income. Measured by monthly rents alone, i.e., excluding utility costs not included in rent, tenants pay anywhere from $550-575 per month in Lawrence or Haverhill to $1,200 per month in Boxford. To some extent, the variation in rental prices reflects the size and type of rental structure, unit sizes, and the percentage of rental inventory that is subsidized by federal or state sources. On a priceper-room basis, Andover, North Andover, Topsfield and Boxford offer the most expensive rental housing and Middleton, the lowest, with North Reading at the midpoint. These statistics reflect conditions on April 1, 2000, but while rental charges have undoubtedly increased since then, the order-of-magnitude relationship between rents in each community has most likely remained the same. Of the town’s 219 vacant units on April 1, 2000, 73 were available for rent. Unless they qualify under federal income guidelines, households searching for a suburban apartment face difficult odds of finding one they can afford, particularly in North Andover. In 42
Census 2000, Summary File 3, Table H-7.
Town of North Andover
Community Development Plan
-41-
April 2000, there were 1,359 vacant units for rent in the 11-town area, 5.4% of them in North Andover. Eight percent of the region’s vacant units were for rent at monthly rates of $1,000 or more – an asking rent that applied to 23% of the vacant units in North Andover. However, for both existing and soon-to-be tenants, the issue is not only monthly rents charged by landlords, but also the cost of utilities. Depending on the type of unit and whether it is subsidized, utilities add $45 to $100 per month to the base rent paid by renter households. Table 16 compares renter costs to incomes and provides a summary of units for rent and the median rent asked in each community. Table 16: Characteristics of North Andover Area Renter Households Community RenterMedian Median Gross Rent Occupied Renter Gross Rent as % Units Household Household Income Income Andover Boxford Georgetown Haverhill Lawrence Methuen Middleton NORTH ANDOVER North Reading Topsfield Wilmington
2,414 72 350 9,138 16,594 4,640 331 2,651 458 232 678
41,124 51,250 15,972 27,952 21,163 30,000 30,125 42,780 35,081 30,909 50,481
781 1,256 515 658 607 645 423 879 783 625 948
22.8% 29.4% 38.7% 28.2% 34.4% 25.8% 16.8% 24.7% 26.8% 24.3% 22.5%
Vacant Median Rent Rental Asked for Units Vacant Units 67 4 9 272 640 189 24 73 21 6 54
757 725 950 633 536 625 433 639 950 625 759
Source: Census 2000, Summary File 3, Tables H7, H18, H38, HCT1, HCT12.
HOUSING AFFORDABILITY Chapter 40B Though North Andover has lower-cost homes, very few meet the definition of an affordable housing unit under state law. In Massachusetts and most states across the country, the term “affordable housing” means homes made affordable to lower-income households by a deed restriction or covenant that restricts sale prices and rents as the units are vacated, sold or leased to new tenants. North Andover currently has 529 housing units, and 140 more under construction or in the pipeline, that qualify as “affordable” under Chapter 40B,438 a law that is highly controversial in most communities because it overrides local zoning regulations that make lowand moderate-income housing economically infeasible to build. The device that overrides local zoning is a comprehensive permit. Enacted in 1969, Chapter 40B establishes a legal presumption of unmet housing needs when less than 10% of a community’s Department of Housing and Community Development (DHCD), “Chapter 40B Subsidized Housing Inventory,” April 2002, . 43
Town of North Andover
Community Development Plan
-42-
year-round housing stock is affordable to households at or below 80% of median family income. Generally, communities that do not meet the 10% threshold must issue a comprehensive permit unless there is a compelling basis to deny one. Developers, in turn, may ask the state's Housing Appeals Committee (HAC) to overturn a local Zoning Board of Appeals (ZBA) decision. In most cases they negotiate a compromise with town officials, but HAC’s less frequent overrides have left a lasting impression on communities and form the basis for most of the opposition from local governments today. All 529 units currently in North Andover’s Chapter 40B inventory are renter occupied (52% agerestricted). The inventory represents 5.35% of the town’s year-round housing stock. However, in the past two years the ZBA has issued comprehensive permits for three homeownership developments with a total of 484 homes, including 129 Chapter 40B units, and is reviewing two more proposals: a 16-unit development with four affordable homes, and a 28-unit development with 7 affordable homes. If all 140 recently approved and proposed affordable units are added to North Andover’s Subsidized Housing Inventory, 6.67% of the town’s housing stock will meet the definition of “affordable” under Chapter 40B. Statewide, 8.45% of all houses and apartments meet the statutory definition of "low- and moderate-income housing units," though only 27 of the state’s 351 communities have produced enough subsidized housing to satisfy the 10% goal. While cities top the list for affordable housing production, a few towns also exceed 10%. Fig. 10 shows that the percentage of subsidized housing in North Andover’s area varies quite a bit. Across the region, there are 9,253 Chapter 40B units or 8.48%, much like the state as a whole. Lawrence tops the list for number and percentage of Chapter 40B units, but excluding the region’s cities – Lawrence, Haverhill and Methuen – most of the towns exceed the average percentage of Chapter 40B units for suburban communities throughout the state, or 2.77%.44
Other Measures of Affordability The legislature’s intent in enacting Chapter 40B was to assure a "fair-share" distribution of lowincome housing across the state, but housing policy analysts do not define affordable housing need on the basis of a fixed 10% standard. The national definition of housing affordability assumes that a home is affordable to its owners if their monthly housing costs – a mortgage payment, property taxes, and house insurance – are equal to or less than 30% of their monthly gross income. Similarly, an apartment is considered affordable to tenants if they pay 30% of their gross monthly income, or less, for rent and utilities. Under these criteria, "affordable housing need" exists when households pay more than 30% of their gross income for housing costs. In housing industry parlance, they are classified as "housing-cost burdened." According to recent federal census data, 21.3% of all homeowners in the Lawrence metropolitan area and 21.2% in North Andover qualify as housing-cost burdened. The condition is more pronounced among renter households, for 36.2% of Lawrence-area tenants pay more than 30% of their monthly income for rent and utilities, compared to 30.6% in North Andover.45 Table 12 provides comparative data on the incidence of rental housing cost burden in North Andover and other communities nearby, particularly among elderly and low-income renters. Affordable housing percentages derived from DHCD Subsidized Housing Inventory; “suburban communities” refers to 53 towns defined as suburbs in Department of Revenue “Kind of Community” classification system. 44
45
Census 2000, Summary File 3, Tables DP-4 and H-84.
Town of North Andover
Community Development Plan
-43-
In a competitive real estate market like North Andover, the cost of housing creates a significant challenge for lower-income households. The measure of “low- and moderate-income” varies by household size and region, but by federal definition, a household meets the moderate-income threshold if its annual income is equal to or less than 80% of area (regional) median income. After each decennial census, the U.S. Department of Housing and Urban Development (HUD) publishes the estimated percentage of moderate-income households, families and persons in all cities and towns across the country, down to census block groups – generally, sub-areas within each community. Recently released HUD statistics show that in April 2000, 31.4% of all households and 25.3% of all persons in North Andover qualified as low- or moderate-income under that year’s housing program income guidelines. A decade ago, HUD placed North Andover’s low- and moderate-income population at 20.4%.46
Affordability Gap
2002
2000
1998
1996
1994
1992
1990
1988
Downpayment (10% Purchase Price)
Since the 1930s, federal CHANGE IN SAVINGS REQUIRED FOR 10% housing policies have DOWNPAYMENT IN NORTH ANDOVER effectively subsidized homeownership – $45,000 through income tax $40,000 deductions for $35,995 $35,000 mortgage interest and real estate taxes, $30,000 federal home mortgage $24,600 $25,000 insurance, and more recently, low-interest $20,000 loans and grants that $21,150 $15,000 help moderate-income renters become $10,000 homeowners. Though $5,000 some home-seekers $have more resources than lenders require, such as equity to invest from the sale of a previous home or a gift or loan from family members, those with only their savings to put toward a downpayment find homebuying more difficult. First, while saving to purchase a home they must also pay rent, and because apartments are so scarce, market rents have become very expensive. Second, since the purchase price of a house usually determines the downpayment amount, first-time homebuyers end up saving toward a moving target: the sale price of homes in a very tight real estate market.
HUD, “Census 2000 Low and Moderate Income Summary Data: Non-Entitlement Local Government Summaries for Low and Moderate Income Estimates,” available by state, in EXCEL format, .
46
Town of North Andover
Community Development Plan
-44-
Under conventional loan underwriting standards, homebuyers at North Andover’s median household income of $72,278 can afford a purchase price of about $226,519. For them, the town’s median single-family home sale price of $400,000 (2001) LOCAL & REGIONAL RENTER HOUSEHOLDS UNABLE translates into an TO P URCHASE A HOME IN NORTH ANDOVER (IN %) “affordability gap” of $173,478: the difference 74.9% between the sale price and the Lawrence PMSA purchase price they can afford. 95.0% A sale price of $400,000 is also high enough to preclude 64% of North Andover’s present households from purchasing a house in town if they were firsttime homebuyers today.
Boston PMS A
Essex County
66.0% 91.7%
74.7% 95.0%
Condominiums often supply more affordability than single58.3% NORTH family homes, and in North ANDOVER 84.9% Andover this clearly applies. The town’s median 0.0% 20.0% 40.0% 60.0% 80.0% 100.0% condominium sale price of $145,000 (2001) would be % S ingle-Family Price Barrier % Condominium Price Barrier affordable to about 29% of its present households if they were first-time homebuyers. However, the more disturbing issue is the lack of access to homes or condominiums in North Andover for renters – many of whom are saving to purchase their first house. North Andover’s median condominium sale price is unaffordable to 58% of its own renters and 75% of all renters in the Lawrence metropolitan area. In addition, North Andover’s median single-family sale price exceeds the buying power of 85% of its own renters and 95% of all renters living in the Lawrence region.47
PLANNING CONSIDERATIONS Residential Development Trends North Andover regulates residential land use with zoning policies that encourage single-family home development. Nearly 90% of the town is zoned for single-family homes as of right on parcels that meet minimum lot area requirements of 12,500 ft2 to 87,120 ft2 and minimum frontage requirements of 85-175 feet. North Andover also allows new multi-family housing as of right in two districts and by conversion of existing single-family homes in three districts. In addition, residential uses are permitted in three of the town’s commercial districts, generally on a mixeduse basis, i.e., residential uses above the ground floor of commercial buildings. However, very 47
Purchase price assumes a 10% downpayment and a 30-year mortgage at 7.5% interest.
Town of North Andover
Community Development Plan
-45-
little if any developable land remains in zoning districts where multi-family development is allowed. Over the last thirty years, low-density residential development has absorbed increasingly large amounts of the town’s land, as shown in Table 17. Table 17: Developed Land in North Andover, 1971-1999 Land Use Multi-Family Higher-Density Single-Family Moderate-Density Single-Family Low-Density Single-Family Commercial Industrial Total Developed Acres Total Area (Town) % Higher-Density Housing % Moderate-Density Housing % Low-Density Housing % Commercial % Industrial
1971 162.7 596.5 629.0 1,185.9 174.7 275.5 3,024.3 17,681.9 4.3% 3.6% 6.7% 1.0% 1.6%
Acres in Use 1985 235.2 596.5 1,195.6 1,680.9 249.8 368.0 4,326.0
1999 258.6 605.3 1,694.0 2,368.6 273.0 444.1 5,643.5
4.7% 6.8% 9.5% 1.4% 2.1%
4.9% 9.6% 13.4% 1.5% 2.5%
Source: MassGIS. Statistics by author.
Land Use & Zoning
2002
2001
2000
1999
1998
1997
1996
1995
Number of Permits
Zoning and the market RESIDENTIAL BUILDING PERMITS S ingle-Family work as mutually 1995-2002 Multi-Family reinforcing agents toward 200 a particular development 180 outcome, and to some 160 extent this relationship 140 can be seen in North 120 Andover. In most cases, 100 the ease of developing to local regulatory 80 preference is a greater 60 incentive than the 40 potential for more 20 efficient, lower-cost land 0 use. However, building to the single-family home market has become an economic necessity for many developers, primarily because the high cost of land dictates construction of a large residence that will command a premium sale price. Between 1995-2000, the North Andover Planning Board approved 31 subdivisions with a combined total of 500 house lots while the Building Department issued new-construction permits for nearly 729 single-family homes and
Town of North Andover
-46-
RESIDENTIAL SHARE OF ANNUAL "NEW GROWTH" VALUE 70.0
90%
60.0
80% 50.0
70% 60%
40.0
50% 30.0
40% 30%
20.0
20%
Residential % of New Growth
10%
New Growth Value
10.0
Total Value New Growth (Millions)
100%
0.0 2002
2001
2000
1999
1998
1997
1996
1995
1994
1993
0% 1992
New Growth %
164 two- and multi-family units.48 Attesting to the impact of high land costs and market preference on housing affordability, North Andover’s newest homes (i.e., built 19972001) carry a median assessment of $459,440, 60-65% of which is driven by building value. Whether in conventional or cluster subdivisions, the median value of a recently developed house lot is $145,000.4915 It is little wonder that residential development has contributed so significantly to each year’s “new growth” tax levy in North Andover.
Community Development Plan
Residential Buildout & Chapter 40B Two years ago, Merrimack Valley Planning Commission (MVPC) evaluated North Andover’s future development potential as part of a statewide program sponsored by the Executive Office of Environmental Affairs (EOEA). MVPC determined that North Andover has about 2,768 acres of vacant residential land. Given natural constraints and zoning requirements, 94% of the land could support 2,324 residences: 2,315 single-family homes and 9 multi-family units. Under MVPC’s build-out estimate, new residential growth would consume more than twice the amount of land per unit as the town’s established housing base does today.50 Consistent with the state’s build-out methodology, MVPC did not account for new Chapter 40B units in North Andover’s future development forecast. Given the town’s three recently approved homeownership developments, the Chapter 40B inventory will increase from 529 to 658 units, or 6.65% of the town’s Census 2000 year-round housing base. The remaining Chapter 40B “gap” would be 333 units. However, the town accrues liability for Chapter 40B units as market-rate homes continue to be developed on relatively generous house lots. If the town were to build out to an additional 2,324 homes with no provision for affordable housing development, the shortfall
48
MISER, “Residential Building Permits,” and MVPC, “North Andover Build-out Study.”
49
North Andover Assessor’s Office, “FY02 Parcel Data.”
In a build-out study prepared in-house for the North Andover Master Plan (1998-99), the Community Development Department estimated North Andover’s future development capacity at 3,747 new homes. 50
Town of North Andover
Community Development Plan
-47-
would increase to about 570 units. To accommodate these 570 units, North Andover may absorb as many as 2,275 additional homes, i.e., beyond MVPC’s build-out estimate. Chapter 40B requires NORTH ANDOVER'S DEVELOPMENT FUTURE: developments to include at least POTENTIAL OUTCOMES OF CURRENT ZONING one affordable unit for every three market-rate units. To 12,500 encourage rental production, the Current Future state counts all apartments in a 10,000 comprehensive permit rental development regardless of whether the apartments rent at 7,500 low-, moderate- or market-rate levels. For mixed-income 5,000 homebuyer developments, Chapter 40B recognizes only the affordable units.51 Since the 2,500 market-rate homes do not count toward the 10% goal, they 0 effectively expand the yearAcres of Land Used Unmet Chapter 40B Housing Units round base that is used to for Housing Requirements calculate a community’s percentage of Chapter 40B units. 9,943 4,926 336 Current The impact of this policy will be 2,324 2,768 569 Future evident when North Andover’s Chapter 40B inventory is updated to reflect the town’s three new homeownership developments: unless the legislature enacts proposed changes to Chapter 40B, the Subsidized Housing Inventory will include the town’s 129 deed-restricted affordable units, but the other 356 homes will be classified as “total development units,” not Chapter 40B units.52
Land Undeniably, housing demand drives the market for land in North Andover. The near doubling of land used for residential, commercial and industrial development between 1971-99 brought about a dramatic increase in the market value of land and simultaneously eroded North
Proposed amendments to Chapter 40B would change the way that DHCD “counts” units in a homeownership development. If the amendments become law, each community’s Chapter 40B inventory will recognize 50% of the units in a homeownership project or twice the number of affordable homeownership units. Under the proposed formula, North Andover’s Chapter 40B inventory would increase to about 8% because the number of recently approved low-income affordable units – 129 – would be counted as 258. 51
“Total development units” measures all of the housing units included in approved comprehensive permits. The only units that DHCD considers when calculating a community’s percentage of low-and moderate-income housing are those classified as “Chapter 40B units.” 52
Town of North Andover
Community Development Plan
-48-
Year Built
Andover’s inventory of open RATIO OF LAND TO BUILDING VALUE BY AGE OF space, 89% of it forested.53 SINGLE-FAMILY HOMES Virtually all of the parcelization that has occurred in North 0.00 0.20 0.40 0.60 0.80 1.00 1.20 Andover since 1990 is Ratio attributable to land divisions for 0.50 1990-2001 single-family homes. By last year, single-family parcels 0.59 1980-1990 comprised 65% of all 9,202 parcels in North Andover, up 0.77 1970-1980 from 59% of 8,172 parcels in 1990.54 The gradual absorption 0.90 1950-1970 of North Andover’s best land by earlier development eras means 1.08 1930-1950 that recent growth has occurred on increasingly marginal sites. 1.03 1900-1930 To accommodate natural constraints and comply with the 0.96 pre-1900 zoning and Title V regulations, new growth has also consumed more land per housing unit. As growth continues to spread into outlying areas, the town’s propensity for high residential land costs will accelerate. Throughout Eastern Massachusetts, market expectations for very large homes and the high cost of land for new development have conspired to make modest homes attractive for redevelopment. The same phenomenon is happening in North Andover. Local data show that North Andover is not immune to the risks of “mansionization,” or the practice of altering, expanding and “reinventing” a small, older home – or simply tearing it down and replacing it with a large residence.55 Housing units built during the inter-war years (19201945) are particularly vulnerable in North Andover because in most cases, they are smaller and less valuable than new or pre-20th century homes. For example, the 510 housing units in this class tend to be 1.5-story, six-room homes (including three bedrooms) with 1,627 ft2 of gross floor area. On average, they occupy .29-acre house lots and are assessed at $208,000. Over half of their assessed value is based on land value alone.
RECOMMENDATIONS When the Master Plan was completed in 2000, the town adopted five goals for housing and residential development:
53
MassGIS, Vector Data Library.
54
DOR, Municipal Data Bank [online database], “Parcels by Use Class,” in EXCEL format
55
Data for Figures 16-17 were obtained from the North Andover Assessor’s Office (November
2002).
Town of North Andover
Community Development Plan
-49-
Ÿ
Calibrate the rate and amount of residential development with the town’s ability to provide services.
Ÿ
Maintain the character of existing North Andover neighborhoods by preserving landscape features, development patterns, density and scale of new growth.
Ÿ
Discourage development in environmentally sensitive areas.
Ÿ
Encourage negotiated residential development in order to foster creativity, appropriate use of land, a sense of community and the highest quality projects with the maximum attainable public benefits for the town.
Ÿ
Preserve the diversity of North Andover’s housing stock.
These goals remain appropriate for North Andover. The Community Development Plan’s recommendations to address three of the goals should be incorporated in the Master Plan by amendment to the Housing Element.
Growth management Ÿ
Amend the Phased Development Bylaw to set a maximum number of dwelling units that may be permitted annually, with “opt-out” provisions by special permit for types of development that address the town’s housing, community development and open space needs. Ÿ
In an effort to control the total amount of residential development and protect its drinking water supply from development impacts, North Andover requires one- and two-acre minimum lot sizes and enforces a one-unit-per lot development rule in the two zoning districts where most of its vacant land remains (R1 and R2). These techniques have and will continue to limit the number of dwelling units, but they create significant challenges to meeting other housing goals. With so many new single-family residences sized to attract families, it is not surprising that since 1990, North Andover has absorbed a 28% increase in married couples with children – and a 29.2% increase in all family households with children.
Ÿ
As companion measures, North Andover also adopted a Phased Growth Bylaw (1986) and later, a Growth Management Bylaw (1996). The Phased Growth Bylaw was among several recommendations contained in the Growth Management Plan (1987). Its purpose is to buffer North Andover from a sudden, large influx of new homes by subjecting most residential projects to multi-year construction plans. The Growth Management Bylaw caps total annual development by restricting the number of permits that the Building Inspector may issue each year. When it was adopted, town meeting established a “sunset” provision for 2002 but allowed for up to four annual extensions so the town would have adequate time to plan. Last year, town meeting approved a one-year extension.
Ÿ
The Growth Management Bylaw has been very difficult to administer. In addition, a key justification for adopting the Growth Management Bylaw in 1996 was that the town needed time to update its Master Plan, which has in fact occurred. North Andover’s
Town of North Andover
Community Development Plan
-50-
Phased Development Bylaw is more consistent with the growth management tools used elsewhere in Massachusetts and it provides a way to treat all developers and land owners equitably. However, it could be revised to incorporate some important features that were written into the Growth Management Bylaw, such as exemptions for affordable housing and projects that accept a voluntary density reduction.
Mandatory open space zoning Ÿ
Replace the existing open space development regulations with a mandatory open spacecluster bylaw. Ÿ
North Andover’s zoning bylaw offers developers several alternatives to conventional single-family subdivisions, such as Planned Residential Development, Large Estate Conversion, Continuing Care-Retirement, and Independent Elderly Housing. Indeed, North Andover’s Zoning Bylaw has so many districts and special regulations that over time, it has become excessively complicated. It is not at all clear that North Andover is getting the kinds of projects that local officials and voters anticipated when they amended the bylaw to provide for these types of uses. The Master Plan indicates that many in North Andover have become skeptical about the benefits of Planned Residential Development, a bylaw that provides density incentives to attract developer cooperation.
Ÿ
The town’s interest would be served better by a mandatory cluster bylaw that applies to all divisions of land or developments over an agreed-upon size threshold, e.g., 5 lots or 5 dwelling units on parcels over a certain size. By right, a developer would be free to pursue a conventional subdivision with fewer than 5 lots or comply with the town’s open space design standards. For 5+ lots, the developer should be required to obtain a special permit from the Planning Board and design a project according to regulations outlined in the Zoning Bylaw. The result would be guaranteed open space in all developments covered by the bylaw.
Ÿ
Under the same set of regulations, the town should offer a modest density incentive to encourage additional public benefits, e.g., exemplary open space, affordable housing, or preservation of a historic home or accessory building. In the future, the town should consider adopting parallel open space-cluster and inclusionary housing bylaws so that all developments over a specified size are required to preserve open space and create affordable units.
Housing preservation Ÿ
Adopt demolition delay bylaw to obtain review authority over whole or partial demolition of any building over a certain age.
Ÿ
Adopt companion zoning incentives to encourage reuse of existing structures for affordable housing, e.g., greater use intensity where appropriate, by special permit, in the R-1, R-2 and R-3 Districts and outside of the Watershed Protection District. (Note: conversions are already allowed as of right in R4 and R6). A bylaw that allows conversion of older single-family homes to two-or three-family use by special permit, provided that one of the units is deed-
Town of North Andover
Community Development Plan
-51-
restricted for long-term affordability, may help to secure new units eligible for Chapter 40B through the reuse of existing development. Ÿ
Develop a target list of single-family, multi-family and condominium properties for acquisition/rehabilitation in exchange for permanently affordable housing units, and establish a funding pool with CPA revenue. Ÿ
North Andover does not have effective regulations to preserve its historic mix of singlefamily homes. Major expansions or alterations to existing homes and demolition-rebuild projects attract new investment to the community and they contribute to the town’s “new growth” revenue under Proposition 2 1/2. However, as these activities cause older homes to appreciate in value, they also remove lower-cost housing from the market. There are about 840 single-family homes in North Andover with building values below $100,000 – relatively small residences built, on average, between 1938-45. Strategies to secure the affordability of these homes could help North Andover establish a base of Chapter 40Beligible units for lower-income homebuyers or renters, avoid the environmental costs of new development, and preserve architectural traditions that pre-date modern subdivisions.
Ÿ
North Andover needs to consider ways to preserve its supply of “informally” affordable homes: modest single-family and two-family residences that may be affordable today but are unlikely to remain affordable in the future. Some have been well maintained while others are in a moderate state of disrepair. Many are of lower value regardless of their condition, simply because of their age and styles. As existing assets, they provide a resource that may be tapped to increase North Andover’s inventory of permanently affordable homes without building more new homes on undeveloped land. Eventually, homes occupied by long-time residents will become available for purchase or rent. Those of comparatively lower values will be desirable to prospective homebuyers in search of an investment opportunity. As North Andover’s base of older, lower-cost housing transitions from present to future homeowners, its “market” affordability will begin to disappear.
Ÿ
Preservation strategies are difficult to implement and they require dedicated community involvement. However, capitalizing on the established base of development is more prudent than encouraging new construction wherever possible, including for the creation of permanently affordable, decent housing. In consultation with the North Andover Historical Commission and the Massachusetts Historical Commission, confirm the status of the town’s existing historic property inventories and determine whether additional or updated surveys would be required in order to qualify areas with high concentrations of small, older homes for local historic districts.
Comprehensive permit process Ÿ
Develop a Comprehensive Permit Policy that identifies (a) community housing needs and (b) preferences for affordable housing development, design and locations. Ÿ
When North Andover’s new Master Plan was being developed between 1997-99, the Master Plan Committee decided to emphasize rate of residential growth, open space and
Town of North Andover
Community Development Plan
-52-
neighborhood design over housing affordability because at the time, fiscal impact, water and open space protection were critical concerns to the town. Since 1997 – and particularly since 1999, when the Housing Appeals Committee (HAC) released the controversial Stuborn Ltd. Partnership v. Barnstable Board of Appeals ruling – there has been a significant increase in comprehensive permit activity across the Commonwealth. North Andover’s recent experience as a recipient of five comprehensive permit applications is indicative of this trend. Ÿ
Today, the town has choices that did not exist five or six years ago. For example, by adopting the Community Preservation Act (CPA) in 2002, North Andover made a commitment to protect open space, create homes affordable to lower-income households and preserve its historic buildings. CPA revenue could be vital to the success of an affordable housing strategy in North Andover. In addition, by accepting an Executive Order 418 grant, North Andover agreed to address its housing, economic development and open space needs through a coherent set of local initiatives. Finally, recent changes to the state’s Chapter 40B regulations offer incentives for municipalities to increase their supply of affordable housing. North Andover should make use of these incentives as appropriate. However, the town should first establish a local housing policy to unify the affordable housing activities of town boards and committees, convey clear expectations to developers, and define the criteria that will guide comprehensive permit negotiations.
Ÿ
Chapter 40B creates opportunities for negotiated development in a process that differs significantly from conventional permitting. A comprehensive permit policy helps to establish the framework for community-developer negotiations. Arguably, Chapter 40B places some constraints on local officials. However, it does not prevent them from exploring trade-offs, issuing conditional permits that preserve a project’s feasibility, or working with applicants to reduce the scale of a proposed development without making it uneconomic to build.
Ÿ
To negotiate effectively, communities must be realistic, reasonable and clear about what they want from a Chapter 40B development. When they adopt a comprehensive permit policy, they should anticipate the ways that it may be used, and by whom. From a municipality's point of view, the policy should establish for everyone – town boards, developers, funding agencies and appellate jurisdictions - the boundaries of negotiation. This means that local officials must be equally clear about negotiable and non-negotiable considerations, and that town boards should not work at cross-purposes. A comprehensive permit policy should provide unambiguous guidance on the following: Ÿ
Community housing needs and priorities.
Ÿ
A statement of consistency with the master plan or other significant plans and policies.
Ÿ
Preferences for types of housing, location, density and scale, intensity of use, architectural design and site plan standards, other public benefits.
Ÿ
Performance standards: desired percentage(s) of affordability, income targets, term of affordability, accessibility, minimization of land use conflicts.
Town of North Andover
Community Development Plan
Ÿ
Expectations concerning development in environmentally sensitive areas.
Ÿ
A "local preference" policy.
-53-
North Andover Master Plan Ÿ
Designate areas that are appropriate for higher-density housing and infill development, and rezone them accordingly (Map 5). Ÿ
Executive Order 418 encourages communities to identify areas suitable for higherdensity housing as part of a larger strategy to increase the supply of affordable homes. The Community Development Office should request participation from boards and committees with an interest in housing to determine whether the town needs to identify additional areas for higher-density development, given that North Andover’s zoning already provides for a continuum of lot sizes in several residential zoning districts. Although it is true that districts with smaller lot sizes have very little land available for new growth, it may be more prudent to focus on these areas for preservation, conversion and infill strategies than to induce more development in North Andover’s rural areas.
Ÿ
Working with the Planning Board, the Community Development Office should pursue zoning changes to facilitate higher-density development, considering the following criteria:
Ÿ
Ÿ
Areas desirable for mixed-use development.
Ÿ
Areas with potential for rezoning to a higher-density district.
Ÿ
Small town-owned parcels with little or no open space and recreation value that may be candidates for disposition/development.
Ÿ
Land the town may want to acquire for open space or other purposes, for which some residential development may be an appropriate strategy to finance the acquisition.
Possible implementation measures include: Ÿ
Zoning to allow mixed-use development (residential and commercial) by special permit in portions of the existing R4, R2 and GB Districts, provided that the residential component of a mixed-use development includes deed-restricted affordable housing units.
Ÿ
Infill development regulations.
Ÿ
Recommendations for targeted (area-specific) development, redevelopment and reuse strategies that include higher-density housing, where implementation involves a combination of zoning, public and private investment.
Town of North Andover
Community Development Plan
-54-
Ÿ
“Local initiative” housing, e.g., housing developed by a community-based economic development corporation or a Local Initiative Program comprehensive permit by a private developer.
Ÿ
Successful housing programs require adequate implementation capacity. The town should assign responsibility for housing policy coordination to a professional staff member and/or one or more qualified volunteers. Effective networking with regional housing organizations to make optimum use of available housing development resources.
Strategy Paper
OPEN SPACE & RESOURCE PROTECTION Since North Andover received equivalency status for its 2000 Open Space and Recreation Plan, the Community Development Plan does not include a detailed analysis of the town’s open space and resource protection needs. The Open Space and Recreation Plan is an excellent plan that includes a number of important goals and strategies. It builds on a number of studies and plans that North Andover completed in the past 15 years. Three key themes reflect the open space and natural resource priorities in North Andover. The Community Development Plan’s goals and recommendations should incorporate and integrate these important priorities. 1. Protect the Lake Cochichewick Watershed. 2. Preserve the open and rural atmosphere and uniqueness of North Andover. 3. Expand North Andover’s recreational programs and quality of life. This technical memorandum lists the resources that should be included on the Community Development Plan’s Land Use Suitability Map, reviews the town’s priorities for protecting wildlife habitat and water resources, recommends additional water quality protection measures, summarizes key findings, and includes recommendations for the Community Development Plan.
NATURAL RESOURCES AND LAND USE SUITABILITY MAP The following resources should be included on the Land Use Suitability Map. Water Resources Berry Pond Boston Brook Cedar Pond Cochichewick Brook Lake Cochichewick Merrimack River Mill Pond Mosquito Brook Osgood Pond Reservoir
Salem Pond Sharpner’s Pond Shawsheen River Stearns Pond Stevens Pond Sudden Pond Sutton Pond Towne Pond Vernal Pools – Certified and Potential Wetlands
Protected Open Space Boxford State Forest Bruin Hill Carter Hill Chaplin Cedar Swamp
Chaplin Nike Site Christmas Tree Estate Cyr Recreation Center Farnsworth Reservation
Town of North Andover
Community Development Plan
Fish Cedar Swamp Foster Farm Half Mile Hill James Swamp Mazurenko Farm Conservation Area Merrimack River Well Osgood Hill Purgatory Swamp Memorial Park Parker State Forest
-56-
Rea’s Pond Conservation Area Riverview Street Boat Ramp Site Shawsheen River Smolak Farm Stevens-Coolidge Place Town Common Town Farm/Forest Ward Reservation Weir Hill Reservation Wilmot Lot
Resource Protection Buffers High Water Mark Conservation Zone – 150’ Tributaries and Lakes – 400’ Wetlands – 100’ Other Resources Chapter 61, 61A, 61B Lands DEM designated “Scenic Landscape” Ipswich River Watershed Lake Cochichewick Watershed Land with Agricultural Preservation Restrictions (APR) Medium and High Yield Aquifers
Open Space preserved in Planned Residential Developments (PRD) Parker River Watershed Proposed Railroad Right-of-Way Trail Shawsheen River Watershed Trails Watershed Protection Overlay District
HABITAT PRESERVATION AND WATER RESOURCE PROTECTION PRIORITIES The Open Space and Recreation Plan includes 16 goals and a number of strategies to achieve them between 2000-2005. This plan also incorporates the recommendations made in the 2000 Master Plan for open space and natural and cultural resources. The priorities listed below are a comprehensive list of the habitat preservation and water resource protection priorities detailed in these plans.
Habitat Preservation Priorities Ÿ
Implement the new local Slope and Elevation Protection Bylaw.
Ÿ
Consider changing residential zoning districts from one to two acres in portions of the town.
Ÿ
Expand conservation efforts and work with DEM, DEP, the Division of Fisheries and Wildlife, the Essex County Greenbelt Association, the Massachusetts Audubon Society and The Trust for Public Land to acquire and manage open space.
Ÿ
Dedicate local funds for open space acquisition through the Conservation Fund, the
Ÿ
Community Preservation Act, impact fees, general obligation bonds and mitigation.
Town of North Andover
Community Development Plan
-57-
Ÿ
Link open space and trails.
Ÿ
Promote river access and awareness.
Ÿ
Manage town-owned open space including ADA compliance.
Ÿ
Use Planned Residential Development to protect the town’s hilltops.
Ÿ
Contact landowners to provide education and encourage participation in the Chapter 61, 61A, 61B program.
Ÿ
Pursue Agricultural Preservation Restrictions on important landscapes.
Ÿ
Dedicate significant roads as Scenic Roads under M.G.L. c.40 § 15C.
Ÿ
Plant a variety of street trees.
Ÿ
Educate regulatory boards – Conservation, Planning, Health, Zoning Board of Appeals
Ÿ
Water Resource Protection Priorities
Ÿ
Amend the Town Charter to create a Water Commission.
Ÿ
Establish a “Water Web” website.
Ÿ
Continue to develop and disseminate water quality and water conservation materials.
Ÿ
Include and educate the Zoning Board of Appeals in watershed protection.
Ÿ
Hold a Lake Cochichewick Annual Meeting to educate landowners and citizens.
Ÿ
Amend the Town Charter to create a Water Commission.
Ÿ
Set water rates to encourage conservation.
Ÿ
Develop watershed maps.
Ÿ
Develop a town-wide Water Master Plan.
Ÿ
Update the Lake Cochichewick Watershed Plan every 10 years.
Ÿ
Develop a Lake Cochichewick Management Plan.
Ÿ
Establish a Conservation Fund.
Ÿ
Designate the Lake Cochichewick Watershed as an Area of Critical Environmental Concern.
Ÿ
Refine Board of Health regulations to manage septic system maintenance in the Lake Cochichewick Watershed.
Town of North Andover
Community Development Plan
-58-
The 2000 Open Space and Recreation Plan also outlined a set of priorities to guide the town’s open space protection and acquisition strategy to protect water resources, wildlife habitat and to preserve community character. These criteria (open space acquisition priorities) are listed below.
Open Space Protection and Acquisition Priorities The first priority for open space protection is the re-establishment of the Open Space Committee, which was dissolved by the Conservation Commission. The committee is needed to update the Open Space and Recreation Plan in 2005 so the town will continue to be eligible for state grant funds. The Open Space Committee’s work managing the town’s open space network and trails, and its representation on the Community Preservation Committee are essential. Ÿ
Adjacent to a tributary of Lake Cochichewick
Ÿ
Within the boundaries of the Lake Cochichewick Watershed
Ÿ
Abutting existing, protected open space at risk of development
Ÿ
Unique aesthetic, historic value or contributing to community character
Ÿ
Feasibility of trail network and/or adjacent to the trail network
Ÿ
Unique wildlife, wetlands, river corridor or riparian habitat
Ÿ
Other Resource Protection Needs
The town’s planning priorities emphasize Lake Cochichewick water quality and watershed protection. However, North Andover provides habitat types for a large number of species. The town’s incorporation required that a Native American named Roger and his “company” have access to alewives in the Cochichawicke [sic] River. Local fishery resources remain important today as do grassland and forest habitats for birds and small mammals and places for amphibians and reptiles. Tracking surveys conducted at Mazurenko Farm and studies conducted by the Natural Heritage and Endangered Species Program and the Merrimack Valley Bird Club provide an inventory of the town’s biodiversity. The town’s resource protection goals and the open space protection criteria could be refined by conducting a gap analysis and creating a portfolio of the specific types of habitat and landscapes that are already protected in order to determine habitats and parcels that are needed to protect all the town’s species. In addition, the town might consider adding aquifer recharge areas and flood sensitive areas to its list of open space acquisition priorities. This should be researched during the next revision of the Open Space and Recreation Plan update.
Water Quality Protection: Additional Measures The town depends on Lake Cochichewick for its drinking water and the town’s water resource priorities reflect the importance of protecting this critical community resource. The 2000 Open Space and Recreation Plan contains many strategies including managing septic system maintenance regulations in the Lake Cochichewick Watershed. This strategy has a “B” priority
Town of North Andover
Community Development Plan
-59-
status. There is a compelling need for mandatory septic system maintenance regulations both in this watershed and throughout the town, and this should be an “A” priority. North Andover’s wetlands are the headwaters of three regionally significant rivers that sustain underground aquifers and open water that surrounding towns use for drinking water. Many wells and public drinking water systems throughout the Merrimack Valley are vulnerable to poorly maintained or failing septic systems in North Andover and mandatory septic system maintenance regulations would help protect potable water. Managing stormwater run-off to prevent non-point source pollution and to encourage infiltration and regulating nutrient concentration and run-off from phosphates and fertilizers would complement septic system maintenance regulations. Another “B” priority strategy is investigating the Holt Road Landfill and other potentially contaminated sites. The town should further investigate sources of point source and non-point source pollution and other hazards that could threaten ground and surface water quality. Underground storage tanks, floor drains, some agricultural practices, household hazardous waste, leachate and road salt can all be threats that require regulation, particularly in sensitive areas.
RECOMMENDATIONS In order to realize the town’s three most important objectives – Lake Cochichewick Watershed protection, preservation of the town’s open and rural character, and increasing recreational opportunities and quality of life – the Open Space Committee developed and ranked 16 goals and their associated strategies in a 5-Year Action Plan. The Plan’s most important goals are: Ÿ
Protect valuable water resources.
Ÿ
Expand existing conservation efforts.
Ÿ
Fund open space acquisition.
Ÿ
Link open space and trails.
Ÿ
Encourage open space management.
Ÿ
Protect scenic hilltops, landscapes and farmland.
Ÿ
Preserve historic landscapes and other historic resources.
Ÿ
Facilitate and implement the Open Space Plan.
The Community Development Plan reinforces all of these goals and strategies. In recognition of the work that has been accomplished since the Open Space and Recreation Plan was written, however, the Community Development Plan recommends that some of the regulatory strategies with “B” priority status in 2000 – septic system maintenance, zoning and subdivision rules and performance standards, and overlay zones – be reclassified as higher priorities today.
Town of North Andover
Community Development Plan
-60-
Lake Cochichewick Management Ÿ
Consider a home rule petition to establish a Lake Cochichewick Commission that has development review and permitting powers within the Lake’s watershed.
Ÿ
The 2000 Open Space and Recreation Plan raises an important question: does North Andover have the institutional capacity to manage Lake Cochichewick? The Open Space Committee notes that residents demand, “a steady supply of potable water and a pristine appearance that comports with our image of an environmentally conscious North Andover.”
Ÿ
The Conservation Commission, the Board of Health, the Planning Commission, the Division of Public Works, the Division of Planning and Community Development, the Recreation Council and the Board of Selectmen all make decisions that affect the Lake and its watershed. The Plan suggests that multiple interests (development, recreation, drinking water) place competing demands on the Lake, but there is no but there is no central coordinating commission that manages this resource.
Planning and Implementation Ÿ
Focus open space and recreation resources (volunteer, staff and funds) on implementing North Andover’s existing plans. New planning initiatives should be limited to the next open space plan update in 2005 and a Water Master Plan. Ÿ
North Andover is to be commended for valuing open space and for developing a number of plans and studies to learn about and protect its resources. A number of resourcespecific plans including “P8” (phosphorous loading) modeling for Lake Cochichewick, Lake Cochichewick Watershed Plans, ENSR Reports for Lake Cochichewick, and several Open Space and Recreation Plans have been completed in the past 15 years. The town has far more data and analysis available than many other towns, and the recommendations and strategies outlined in the 2000 Master Plan and the 2000 Open Space and Recreation Plan reflect this careful planning and thinking about resource protection.
Ÿ
To conserve volunteer hours, town planning staff and financial resources, North Andover ought to focus on implementing its existing open space and natural resources priorities in the next 3-5 years. Presently, the town’s planning documents call for four new plans: a Water Master Plan, a Lake Cochichewick Master Plan Update, a Lake Cochichewick Management Plan and an Open Space Management Plan. Undeniably, these are important plans that should be completed and updated. However, current resources may be better spent in the near term updating regulations, acquiring land and providing education and outreach.