AGRICULTURAL SYSTEMS Agricultural Systems 87 (2006) 18–37 www.elsevier.com/locate/agsy
Combining deliberative and computer-based methods for multi-objective land-use planning K.B. Matthews a
a,*
, K. Buchan a, A.R. Sibbald a, S. Craw
b,1
Land Use Systems, The Macaulay Land Use Research Institute, Craigiebuckler, Aberdeen AB15 8QH, UK b The Robert Gordon University, St. Andrews Street, Aberdeen AB25 1HG, UK Received 18 February 2004; received in revised form 15 October 2004; accepted 19 November 2004
Abstract This paper reports the outcomes of a deliberative workshop comparing land-use plans proposed by land-manager or domain experts with those derived using a computer-based decision support system (DSS). The DSS integrates four main components, a geographic information system, land-use systems simulation models, impact assessments and land-use planning tools. The land-use planning tools draw on the other components to generate and evaluate alternative patterns of land use and management. Since the land-use planning tools are based on multi-objective genetic algorithms (mGAs) it is possible to generate a range of alternative plans that define the structure of the trade-off between the objectives. The workshop tasked the delegates with specifying land-use plans that achieved the best compromise between two objectives known to be non-commensurable and conflicting. The nature of the best compromise was dependent on their individual perspectives. The delegates proposed allocations both as individuals and in researcher-facilitated sub-groups. The mGA allocations were then compared with those derived by delegates and were found to be broadly similar in performance. Differences in the range of allocations considered feasible were explained by the hard and soft constraints on allocations agreed between the delegates and articulated within the workshop process. The hypothesis that part of the difference in performance between the mGA and delegate allocations was due to the delegates blocking together fields with the same land use for convenience of management was proved. The analysis of the group allocations revealed that
*
Corresponding author. Tel.: +440 1224 498200; fax: +440 1224 311556. E-mail address:
[email protected] (K.B. Matthews). 1 Tel.: +440 1224 262711; fax: +440 1224 262727.
0308-521X/$ - see front matter Ó 2004 Elsevier Ltd. All rights reserved. doi:10.1016/j.agsy.2004.11.002
K.B. Matthews et al. / Agricultural Systems 87 (2006) 18–37
19
the decision-making process had failed to improve on the individual allocations. From these results it was concluded that there was a potential role for mGA based land-use planning tools in researching into, and deliberating on, the possible impacts of policy or other factors affecting land-use systems. It was further concluded that the tools should not be used in isolation since there was the need for stake-holder inputs to adequately define the range of feasible and practical land-use plans. Ó 2004 Elsevier Ltd. All rights reserved. Keywords: Decision support; Land use; Multi-objective; Genetic algorithms; Deliberative
1. Introduction The multi-functional or multi-objective nature of land management is being recognised in statements made by policy makers on future rural land use (Munton, 1997; Scottish Executive, 2001, 2002). This has led to a desire to assess the likely financial, social and environmental impacts of policy or environmental change. One response has been the development of computer-based decision support systems (DSS) to assess existing patterns of land use and, where appropriate, suggest alternative patterns of land use or management regimen that satisfy multiple objectives. Potential roles for these DSS have been identified in regulatory compliance, technical management, consultancy and social-learning (McCown, 2002). The paper presents the results of a workshop that used a land-use planning DSS as part of a deliberative process comparing the land-use allocations proposed by practitioners and domain experts with those derived by the planning tools within the DSS. The primary objective was to test quantitatively the effectiveness of the land-use planning tools as a means of generating patterns of land use to achieve multiple-objectives. This was accomplished by comparing the DSS derived allocations with those of individual practitioners. A secondary objective was to compare the effectiveness of a group-based decision-making process with the DSS derived allocations. The richness of the qualitative information provided by the delegates and the process of negotiating the operation of the workshop provided the direction for followup experimentation. First incorporating spatial contiguity constraints for land uses into the DSS planning process and comparing the constrained and practitioner proposed allocations. Secondly in evaluating the practitioner allocations with a broader range of metrics, particularly assessing fixed costs. Section 2 outlines the functionality and limitations of the multi-objective land-use planning tools within the DSS. Section 3 presents the implementation of the other components of the DSS and the organisation of the workshop with the outcomes of the comparative analysis presented in Section 4. After comparing the planning tool and delegate allocations, the paper focuses on the process of agreeing compromise allocations between groups of delegates (Section 4.5) and finally conducts a further analysis of the allocations taking into account the implications for on-farm resources (Section 4.6).
20
K.B. Matthews et al. / Agricultural Systems 87 (2006) 18–37
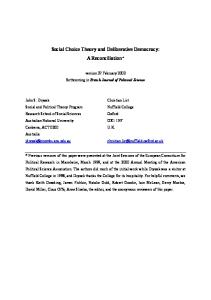
2. Related research 2.1. Computer-based decision support system The land-use planning DSS (LADSS) used within this research is part of an ongoing process of developing an information system to assist in the case-based investigation of policy and environmental change impacts on land-use systems. The DSS operates at the key organisational level of individual management units (e.g. farms or estates). This scale was chosen as this is where policy and other drivers are translated into patterns of land use and management by the decisions of individual land managers. The DSS does not explicitly model the decision-making process but seeks to present a range of possible options and to provide a means of assessing alternative land-use patterns proposed by decision makers. When the DSS is being used to investigate land management decisions, it forms part of a workshop-based deliberative process. 2.1.1. System architecture and software platforms The components of the DSS are illustrated in Fig. 1. The components are implemented in two software systems, G2 (http://www.gensym.com) a knowledge-based systems development environment and GE Smallworld geographic information system (GIS) (http://www.smallworld.co.uk) both running on Sun/Solaris UNIX (Matthews et al., 1999b). GE Smallworld is used to provide the spatial-data handling and spatial analysis functionality, allowing spatially explicit representation and analysis of the farmsÕ bio-physical resources and map-based visualisation of land-use plans. G2 provides a fully-fledged application development environment for the landuse systems models, impact assessments, land-use planning tools and graphical
Geographic Information System
Spatial Data Capture
Bridge
Global & Management Parameters
Land Use Systems Models
Integrated Impact Assessments
Land Use Planning Tools
Graphical Communication Interface Decision makers, consultants, or policy analysts Fig. 1. Components of the DSS.
K.B. Matthews et al. / Agricultural Systems 87 (2006) 18–37
21
communication interface. The DSS is based on third party software systems rather than being built bespoke as this enables the research team to, as far as possible, concentrate on the implementation of knowledge-based content rather than the supporting information technology infrastructure. Inter-application communications are handled by a bespoke software bridge that ensures the synchronisation of communications and the translations of classes between the two systems. The bridge allows data stored in the GIS to be passed to G2 and updated values to be returned for storage. Spatial analysis methods implemented within the GIS can also be called directly as methods from components implemented in G2 with results returned via the bridge. 2.1.2. Land-use systems models The land-use systems represented within the DSS are those typical of upland systems in the UK, primarily focusing on livestock, with arable/fodder crops and plantation forestry. The land-use systems models assess the bio-physical functioning of a land use under a particular management regimen. Land-use systems models use fuzzy suitability rules and empirical models to predict the productivity of spring-sown barley, suckler-cattle, upland-sheep, two conifer and five broad-leaved trees for commercial forestry (Matthews et al., 1999b). The models are applied to land-blockfragments (parcels of land defined as acceptably homogeneous for predictive purposes). The fragments are combined to form land-blocks the unit of land (typically a field) to which allocation decisions are made and management regimen are imposed. The bio-physical yields (mean values based on average climate conditions) from the land-use systems models (tonnage, maximum stocking rates or standing timber volumes) can be used directly by the impact assessments (e.g. sale of arable crops), by other land-use systems models (e.g. fodder crops as the inputs to the livestock production model) or by the land-use planning tools (e.g. the suitability criteria from the land-use systems models used to constrain the possible patterns of land use). 2.1.3. Impact assessments The impact assessments calculate metrics that summarise the functioning of the management unit as a whole taking into account the mix of enterprises and the management regimen. They thus draw on the outputs from the land-use systems models and interact with the land-use planning tools. Three themes are considered, financial, on-farm resource use and environmental impact. Financial. The financial metric used is enterprise gross-margins expressed as net present values (NPV) over 60 years. This allows the direct comparison of those land uses with annual returns to forestry which has periodic returns (Matthews et al., 1999b). The gross margins accounted for variable production costs, prices for products, available grants and other incentives (Chadwick, 2002). The assessment also took account of the restrictions of quotas and other regulations as applicable. On-farm resource use. The ability to analyse patterns of employment provided by land-use systems is desirable primarily since labour is one of the most significant fixed-costs. Labour availability can, however, have important secondary impacts
22
K.B. Matthews et al. / Agricultural Systems 87 (2006) 18–37
for animal welfare or standards of environmental management. A scheduling-based approach to the analysis is used that considers the utilisation of resources over time since there is significant scope for changes to management regimen or enterprise mix that may reduce seasonal peaks in labour demand. Since the numbers and types of equipment available have such profound effects on work rates and thus on labour required, equipment purchase, depreciation, lifetime and running costs are also considered in the analysis. The resources scheduling tool (RST) implemented defines the pattern of resource requirements and utilisation on a week by week basis for individual patterns of land use and management. The operation of the RST is presented in Matthews and Buchan (2003). Environmental. Since there is such a wide range of environmental impacts of potential interest, their implementation was prioritised based on consultation with land managers and NGOs concerned with land management (Landwise Scotland, 1997). From these consultations it was decided that calculation of landscape ecological metrics for alternative patterns of land use would be useful (Forman and Godron, 1986). The interpretation of particular metrics for particular species is undertaken by domain experts. This approach exploits the ability of the GIS to make computationally complex spatial analyses without bias or error and relies on the domain experts to make interpretations. These interpretations draw on a wider range of knowledge and experience than is easily represented within the DSS. The domain experts can also place the land management unit in the context of the wider landscape. 2.1.4. Land-use planning tools The DSS provides land-use planning tools to assist in exploring the range of options available or to find patterns of land-use and management that achieve the goal(s) of a decision maker. It is possible via the GIS interface to interactively define patterns of land use and to modify these in the light of feedback from the impact assessments. Since there are such a large number of possible combinations of land use and management an exhaustive evaluation may not be possible within a reasonable time. In this case it is necessary to employ methods from computer-based search and optimisation. The use of the term optimisation has been deprecated since it can imply a single solution, provability of the outcome and decision making rather than support. All these caveats are valid but search and optimisation methods can be used as part of an exploratory strategy to present a range of alternatives. The solutions found may not be provably optimal, especially in the face of significant uncertainty, but are often good enough where this is defined by their utility to decision makers. The solutions need not in any case be expected to form definitive plans but serve as a starting point for further customisation to suit the preferences of the domain expert. This is particularly important since it is likely that there will be factors of significance to the decision maker that are not explicitly modelled within the DSS. The following section presents the approach implemented within the DSS to support decisions where it is necessary to balance multiple non-commensurable objectives.
K.B. Matthews et al. / Agricultural Systems 87 (2006) 18–37
23
2.2. Multi-objective land-use planning The key distinction for multi-objective land-use planning methods is between a priori and a posteriori approaches (van Veldhuizen and Lamont, 2000). With an a priori approach the strategy is decide-then-search, with the decision-maker defining a weighting or ordering scheme for the objectives from which a solution is generated. This strategy uses the scalarisation or ordering approaches seen in multi-criteria decision making (MCDM) for site selection (Carver, 1991) or indicative zoning (Beedasy and Whyatt, 1999). Solutions found by a priori methods are known to be sensitive to the weightings and orderings employed (Fonseca and Fleming, 1995). This means that, in certain situations, particularly where there is conflict over a decision, it may be impossible to agree on these values. A priori methods may also be employed corruptly to justify a desired solution. In a posteriori strategies the approach is search-then-decide, with the decision-maker presented with a range of alternatives, that define the trade-off between objectives (Matthews et al., 2000). 2.3. Pareto-optimality
Utopian Solution
Pareto-optimal range Objective 2
Infeasible Region
ff
-o
de
a Tr
Objective 2
Objective 2 Optimum
It is intuitive that for many land-use planning problems no Utopian solution will exist, such that all objectives are simultaneously optimal (Fig. 2). For such problems, optimality may usefully be defined as making the best possible compromise between objectives.
Feasible Region Pareto-optimal range Objective 1 Objective 1 Optimum
Objective 1 Pareto-optimal solutions
Fig. 2. Illustration of Pareto-optimality for a two-objective maximisation example.
24
K.B. Matthews et al. / Agricultural Systems 87 (2006) 18–37
The nature of this ‘‘optimality’’ is shown in Fig. 2 and can be formalised using the dominance relationship between alternative solutions (Goldberg, 1989). One alternative dominates another and is, therefore, preferable only if it is superior in pairwise comparison for at least one objective, and has equal or better performance for the other objectives. Alternatives that are not dominated by any other within the space defined by the objectives are members of the set of Pareto-optimal solutions (the POset) (van Veldhuizen and Lamont, 2000; Coello Coello et al., 2002). These alternatives make the best possible compromise between objectives. To characterise the trade-off between objectives the land-use planning tool should find a PO-set encompassing the range of fitness values that are Pareto-optimal and evenly spread across that range (Matthews et al., 2000). 2.4. Multi-objective genetic algorithms One successful approach to finding sets of non-dominated land-use plans defining the trade-off between objectives is to use multi-objective genetic algorithms (mGAs) (Matthews et al., 2000; Ducheyne et al., 2001). mGAs are an extension to a class of search and optimisation algorithms based on the mechanics of natural selection (Goldberg, 1989). GAs maintain a population of alternative solutions from which individuals (termed genotypes) are selected as parents. Components (genes) from the parents are recombined by operators to form new offspring solutions. Selection is biased in favour of those genotypes evaluated as fitter by so-called fitness functions. Fitness will be application-dependent and evaluated by simulation models interfaced to the mGA. For mGAs, fitness is typically rank-based with Pareto-optimal solutions having the highest rank. The least fit member(s) of the population are replaced by offspring that are fitter. mGAs have been shown to be robust and efficient algorithms for searching large, complex and little-understood search spaces such as those of multi-objective land-use planning. mGAs are particularly effective as they allow, within a single run, the characterisation of the trade-off using the population. Limitations of mGAs include their stochasticity, the need for careful parametrisation and the need to represent the problem in such a way that the GA operators can be effective. Two mGA genotype representations have been used for land-use planning within the scope of this research (Matthews et al., 1999a). In the land block (LB) representation individual genes simply encode the land use for one land parcel. There was a concern that with large numbers of blocks the LB representation would be computationally impractical. A second representation was proposed where genes hold two parameters, the target percentage to be allocated and the priority for each land use (the percentage and priority representation – P&P). These parameters are used by a greedy algorithm (Goldberg, 1989) to iteratively allocate LBs starting with those having the best performance for the highest priority land use. Relative performance for land-blocks is determined by user-selected metrics for example yield. Allocation continues until either the target land use percentage is exceeded or no LBs remain to be allocated. The computation required by the P&P representation is proportional to the number of land uses present, rather than the number of land parcels (Matthews,
K.B. Matthews et al. / Agricultural Systems 87 (2006) 18–37
25
2001). For both representations the mGA may only allocate a land use to a block if that land use is bio-physically possible, as determined by suitability rules. 2.5. Evaluating mGA performance There are a range of hard metrics and approaches for comparing the performance of alternative mGAs (Zitzler and Thiele, 1998; Matthews, 2001). These metrics do not, however, address the usefulness of the mGA approach, in particular how the performance of the mGA compares to that of experienced land-managers. Deliberative methods have been used to evaluate the required functionality and operation of DSS (van Beek, 1995). These appraisal methods are workshop-based with delegates chosen to represent a range of differing perspectives (van Beek and Nunn, 1995). Typically, deliberative workshops use facilitated sub-groups (SGs) to produce qualitative analyses with these analyses compared in plenary sessions. The following sections present the results of a workshop-based deliberative analysis comparing the solutions found by the mGA with those proposed by practitioners and domain experts.
3. Materials and methods 3.1. Deliberative methods Ten delegates participated in the workshop, their backgrounds are identified in Table 1. The delegates were first asked individually to design a pattern of land use for a farm (330 ha, 100 fields) in Lanarkshire, Scotland, previously used in the development and testing of the mGAs. Two goals were stated: to maximise financial returns and land-use diversity. The metric for the financial goal was the farm gross margin (income minus variable input costs, excluding fixed costs such as capital and labour) expressed as a NPV over 60 years (Boehlje and Eidman, 1984). The land-use diversity was measured using the Shannon–Wiener (SW) index that is maximised when all potential land uses are present in equal proportions (Forman and Godron, 1986). These two objectives were known to be antagonistic for the test application as increasing areas of less financially productive land uses, such as
Table 1 Workshop delegates – with the codes used to identify their proposed allocations Sub-group 1 (SG1)
Sub-group 2 (SG2)
BA1 – bank adviser AG1 – agriculturalist B1 – biologist E1-1, E1-2 – estate manager F1 – farm manager G1-1, G1-2 – SG1 plans
SA2 – systems analyst AG2 – agriculturalist C2 – conservationist E2 – estate manager F2 – farm manager G2 – SG2 plans
26
K.B. Matthews et al. / Agricultural Systems 87 (2006) 18–37
forestry, increase the SW index while reducing the NPV (Matthews et al., 2000). Given the known trade-off between the two objectives the delegates were asked to produce the best compromise. This gave each delegate the scope to balance the objectives given their varying perspectives. The aim was thus to generate a set of alternative land-use allocations. Where delegates proposed more than one allocation these are identified with 1, 2, etc. To assist in designing an allocation each delegate received an information pack containing sufficient information to allow informed decisions to be made without prejudicing the range of allocations produced. The information provided was broadly similar in nature to that which would be available to a land-management consultant. Following the individual allocations, the delegates were divided into two SGs (see Table 1) and asked to produce a compromise solution from the SG as a whole, using the individual plans as a basis for deliberation. A member of the research team facilitated the process of deriving the group allocation, with each member of the subgroup presenting the individual plans from the previous exercise and the group working together to answer the following questions. Is the plan workable as a whole? Are there parts of the plan that must be kept/dropped? Are there elements that can be added to improve the plan? Following the presentation and discussion of the individual plans, the groups were asked to agree on a group plan by firstly defining the elements that are fixed and non-negotiable, secondly consensus allocations, thirdly patterns that must not occur and finally areas where any land use would be acceptable. In order to ensure that the allocations produced by the delegates and the SGs could be analysed within the DSS it was necessary to propose a series of simplifying assumptions. These assumptions were challenged by the delegates and a series of compromises made by delegates and the research team to ensure that as far as possible the workshop and DSS methods were acceptably reflective of real-world decision making. The rules and their interpretation are given below. 1. The land allocation is defined per existing LB from the range of possible land uses. This assumption was maintained but only a subset (5) of the possible land uses (10) were considered to be of practical value; arable, upland-sheep and sucklercattle with broad-leaved and coniferous trees allocated rather than individual tree species. This simplification may have reflected the limited forestry expertise of the delegates. The restricted set of land uses was also imposed on the mGAs to simplify the process of comparing results. The potential for diversification out of farming was noted. 2. No changes to the existing pattern of field boundaries – this was accepted but noted as limiting for certain delegatesÕ plans. 3. No land may be bought or sold, this was accepted but the potential for renting land in or out was seen as a significant option. 4. The existing land uses do not limit future potential – this was accepted but all delegates went further and retained all existing woodland thus fixing 9% of the farm as common to all allocations.
K.B. Matthews et al. / Agricultural Systems 87 (2006) 18–37
27
5. Capital and infrastructure are not limiting – while accepted, this was highlighted as one of the key constraints on real-world land-use change. Thus the land-use plans proposed may best be regarded as strategic options. The allocations generated by the practitioners were evaluated by the impact assessments within the DSS using the same management and global parameters (e.g. cost and prices) as used for the mGAs. 3.2. Multi-objective genetic algorithms Both mGAs (LB and P&P) were run for the test application. The mGAs used parameterisations established in previous research (Matthews et al., 2000; Matthews, 2001).
4. Results The 10 delegates produced 10 individual allocations and three group allocations (two and one per SG, respectively). The current pattern of land use was also included as an allocation. Fig. 3 shows the location of the individual delegatesÕ and group allocations in the search space, defined by the two fitness functions. The same figure also illustrates the PO-sets found by the P&P and LB mGAs. The details of the landuse allocations are set out in Table 2. The overall pattern of the allocations is informative with many solutions close to the best-compromise front defined by the mGA populations, but others occurring some distance from the front. 2.0 LB mGA
Diversity - Shannon-Weiner Index
P&P mGA Current
1.5
Individual
F2
B1
C2
AG2
E1-1
G2 SA2 BA1
1.0
Sub-group AG1 G1-1
E2
G1-2 E1-2
0.5
0.0
1
2
3
4
Financial Returns - NPV(£M)
Fig. 3. mGA and Land manager allocations.
5
6
28
K.B. Matthews et al. / Agricultural Systems 87 (2006) 18–37
Table 2 Delegate allocations (for codes see Table 1) and evaluation metrics (NPV is net present value, and SW is the Shannon–Weiner diversity index) Allocation
NPV (£M)
SW index
Sheep (Nos.)
Cattle (Nos.)
Broadleaf (ha)
Conifer (ha)
Arable (ha)
Current E1-2 E2 G1-1 AG1 AG2 SA2 G2 BA1 C2 F2 G1-2 E1-1 B1
3.71 4.00 3.77 3.56 3.36 3.16 3.08 3.05 2.74 2.69 2.31 2.31 2.12 1.58
1.048 0.869 1.146 1.135 1.234 1.439 1.271 1.31 1.098 1.454 1.525 0.961 1.327 1.508
1223 1187 1016 967 544 597 1098 802 1150 591 898 1982 1651 768
348 401 355 347 329 307 251 271 246 255 187 137 133 110
23.3 21.8 26.8 49.0 78.5 42.9 36.4 76.0 103.0 54.9 76.1 71.4 57.7 113.6
0 0 0 0 0 40.7 0 0 0 21.7 36.5 0 34.3 47.9
15.2 0 32.6 14.4 33.9 33.9 45.1 38.6 0 31.5 30.6 0 8.3 29.7
Comparing the delegate allocations and those of the mGAs, particularly when informed by the practitioner narratives outlining the reasoning behind their allocations, revealed a wide variety of allocation heuristics and additional metrics that need to be considered when assessing the practitioner allocations. 4.1. Heuristics reducing the range of options considered The upper limit on SW values is 1.6 and represents a 20% allocation to each of the possible land uses (the upper dotted line in Fig. 3). The lower limit of zero occurs when a mono-culture is imposed. It is clear from Fig. 3 that the delegatesÕ solutions occupy only part of the possible range of SW values. The delegates first imposed a precondition that all existing woodland would be preserved. This immediately removes the possibility of a cattle mono-culture (the financial optimum) and sets a lower bound on diversity of 0.25 (the lower dotted line in Fig. 3) and an upper bound on NPV of £5.25M. A broad-leaved woodland mono-culture that could have resulted in zero diversity was excluded as it would have poor performance for both diversity and financial objectives. The preserving existing woodland precondition was also imposed on the mGA search. While it is possible to run single-species livestock farms, there are good animal welfare reasons for having both sheep and cattle present within a single farm. Sequential grazing by sheep and cattle breaks the worm cycle maintaining clean grazings with consequently reduced veterinary interventions. The area of land devoted to sheep is usually less than that for cattle, but must be sufficiently large that it can link in a rotation with cattle. A sheep-cattle mixed livestock system with existing trees preserved raises the lower diversity limit to approximately 0.8 (the middle dotted line in Fig. 3).
K.B. Matthews et al. / Agricultural Systems 87 (2006) 18–37
29
4.2. Larger-scale management units Within these SW bounds the delegates proposed allocations across a range of financial returns from £1.59M to £4.00M. The distribution of these allocations can be seen to roughly form a front similar in shape to the PO-set found by the mGAs with, in most cases, marginally ‘‘poorer’’ performance than the mGA. The mean magnitude of this difference is 26% for NPVs and 13% for land-use diversity. It was hypothesised that the financial performance of the delegatesÕ allocations was reduced by their assembling of fields into higher-level management units, for example keeping all the sheep fields contiguous. There are good practical management reasons for doing this but it can result in allocations that may not be optimal for the fitness-functions imposed. The hypothesis was anecdotally supported by delegate responses to the mGA plans as ‘‘looking fragmented’’. To test this hypothesis the P&P algorithm was altered as follows. After an initial land-block has been allocated to a land-use by the greedy algorithm, the list of remaining suitable land-blocks was sorted by proximity to the initial land-block. Allocation then continues on a closest-first basis. Fig. 4 plots the PO-sets found by the modified proximity–P&P mGA against the delegate allocations. It is clear that assembling blocks into management units reduced the NPV values for allocations with the same diversity. The difference in NPV between the P&P and proximity–P&P PO-sets thus becomes more significant as the diversity increases. More of the solutions proposed by the delegates lie close to the proximity–P&P PO-set, with the mean difference reduced to 13% for finance and 5% for diversity.
2.0
Diversity - Shannon-Weiner Index
Proximity-P&P mGA P&P mGA Current
F2
1.5
AG2
B1
Individual
C2 E1-1 SA2 BA1
AG1
E2
1.0 E1-2
0.5
0.0
1
2
3
4
5
Financial Returns - NPV(£M)
Fig. 4. Proximity–P&P mGA and land manager allocations.
6
30
K.B. Matthews et al. / Agricultural Systems 87 (2006) 18–37
4.3. Further interpretation The three individual allocations furthest from the front (B1, BA1 and E1-1) are useful in indicating that there are possible solutions throughout the search space, and that solutions to the test problem are not necessarily clustered close to the PO-set. For both solutions B1 and BA1 the solutions are financially sub-optimal (within the limits of the fitness metric used) due to the large extent of the low-value woodland areas (113 and 103 ha out of a total area of 300 ha). For E1-1 the reason for sub-optimality was the failure to allocate the arable land uses to land parcels defined as suitable by the DSS. 4.4. Caveats to the organisation of the workshop While the information pack provided to the delegates did provide the information on which suitability could be judged, it did not provide either the criteria used by the DSS or maps of the LBs suitable for particular land uses. This was probably a fault in the analysis as it confused the ability of the land managers to come up with compromise land allocations with their ability to determine the suitability of land for particular land uses. It was decided that, to minimise the possible impact of misallocating land uses to blocks for which they were unsuitable the suitability criteria would be relaxed for arable crops. This can be rationalised as possible management interventions e.g. liming to adjust the pH of acid soils and improvements to field drainage the two criteria that were relaxed. This relaxation means that larger areas were considered suitable for arable crops eliminating almost all of the arable misallocations. This relaxation of the suitability rules, however, also meant that the character of the allocations found by mGAs changed, with larger areas of arable crops present. The need for care in experimental design for the deliberative process is apparent. It was a widely held view of the delegates that to adequately assess the relative financial viability of the allocations it would be necessary to assess the fixed-costs of labour and capital machinery for each allocation (Matthews et al., 2002). 4.5. Group-decision making – the sub-group allocations Fig. 5 shows the SG allocations (G1-1 and G2) and the individual allocations from which the SG plan was derived. Allocation G1-2 was proposed as a distinctly different alternative to G1 and is considered in Section 4.6. The figures also show the centre-of-gravity (CoG), an unweighted average of the coordinates from the delegatesÕ individual allocations. The CoG is the expected location of a group solution based on an equal compromise among the delegates from the individual allocations. It is clear that for both SGs there has been compromise between the delegates. The figure also shows that, as expected, the process of deliberation and compromise from the individual allocations to the group allocation has not been on an equal basis. By calculating weighted averages of individual allocationsÕ coordinates it was possible to explore the influence of individuals on the SG allocation. Weights were
K.B. Matthews et al. / Agricultural Systems 87 (2006) 18–37 Individual
Group LB mGA
Centre of Gravity P&P mGA Sub-group 2 Diversity Shannon-Weiner Index
Diversity Shannon-Weiner Index
Sub-group 1 1.5
B1 E1-1 AG1 G1-1
BA-1 1.0
E1-2 1
2
3
31
4
Financial Returns - NPV(£M)
5
1.5
F2
AG2
C2 G2 SA2
E2 1.0
1
2
3
4
5
Financial Returns - NPV(£M)
Fig. 5. Comparison of the mGA and two sub-group allocations.
set using a gradient-descent method, minimising the difference between the weighted average and the coordinates of the SG allocation. Initially the weights were biased to be non-negative and sum to one but Monte-Carlo testing found that, since G1-1 lies outside the polygon with vertices at the delegate allocations, it is necessary to allow the sum of weights to marginally exceed one. Graphing the weights from 100 gradient-descents revealed that there were several combinations of weights that could result in the SG allocation. This means that there is an inherent uncertainty in determining which combination of delegates influences resulted in the SG allocation. To reflect this uncertainty, the probability of each delegate being the most influential in defining the SG allocation (PMI in Table 3) was calculated. For SG-1, E1-2 was the most influential with AG1 and BA1 second with nearly equal probabilities. For SG-1, two delegates were never the most influential. For SG-2, only one delegate was never the most influential. For the others there is a ranking but without a strong bias. These PMI values match the perceptions of group interactions by the SG facilitators.
Table 3 Influence of individual delegates on the group allocation (PMI is the probability of being most influential and MI the mean value for an individuals influence) Sub-group
Delegate
PMI
MI
1 1 1 1 1
BA1 AG1 B1 E1-1 E1-2
20 16 0 0 64
0.22 0.21 0.04 0.12 0.48
2 2 2 2 2
SA2 AG2 C2 E2 F2
26 22 18 34 0
0.19 0.17 0.19 0.29 0.14
32
K.B. Matthews et al. / Agricultural Systems 87 (2006) 18–37
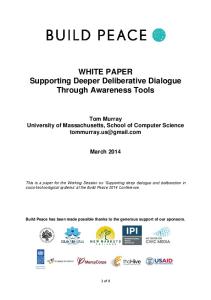
In addition to the PMI metric, the mean value of the weights (MI) per individual was calculated (Table 3). The MI metric is not an ideal measure but does allow limited inferences to be drawn on the influence of delegates that are never the most influential. For SG1, it is clear that E1-1 is more influential than B1 and for SG2 that F2, while never the most influential, is not on average substantially less influential than AG2. For both the PMI and MI metrics the greatest influence is not exerted by the delegate solution closest in the search space to the SG allocation. While this analysis of the compromise process is limited it does highlight the complexities of group-based decision making. The delegates were clearly willing to compromise, though the degree to which this would have occurred, had real incomes or environmental impacts been at stake, is less certain. The effectiveness of the SG compromises is questionable. While distance to the mGA PO-set is a crude measure of quality, it does illustrate that the SG solutions do not improve on the allocations made by the best individuals. This is particularly noticeable for SG2 where the near-equal influence of the delegates results in a solution further from the PO-set than all but one of the individual allocations. For SG1, the strong influence of E1-2 is evident in improving the financial performance of G1. In both cases the compromise process, unlike the mGA, is losing the best elements of the individual solutions by not recombining them to make better solutions. 4.6. Implications of on-farm resource requirements In the light of the results presented above, the Resource Scheduling Tool (RST), developed subsequent to the workshop, was used to further investigate the delegates allocations. The RST evaluated the machinery and labour requirements for a given pattern of land use (Matthews and Buchan, 2003). Three metrics were used in addition to the NPV and land-use diversity: the amount of labour required, the operational costs and the capital costs, each for the first five years. The amount of labour required was the total time (in hours) required to complete the required tasks. The amount of labour required makes no definite statement on the numbers of people that would have to be employed and is indicative only. Since work-rates depend on the machinery available a standard set of machines and equipment was provided such that lack of these resources did not prevent completion of tasks. The operational costs are the running, maintenance and overhead costs for the equipment used. Equipment available but unused is ignored. For capital costs it is possible to use a formal depreciation costing within the RST but since the lifespan of machinery on relatively small enterprises is significantly longer than the depreciation period, the capital cost is the per annum replacement cost over the expected lifespan of the equipment. As with operational costs unused equipment is ignored. Fig. 6 presents, for the delegate allocations, the five evaluation metrics as gains or losses (on a percentage basis) relative to the performance of the current pattern of land use. From this figure and Fig. 3 it can be seen that only E1-2 and E2 result in any gain in NPV. E2 is a marginal improvement for both NPV and SW but for E1-2 the gain in NPV is offset by a substantial loss in diversity.
K.B. Matthews et al. / Agricultural Systems 87 (2006) 18–37
33
Fig. 6. Performance of the delegate allocations for five metrics relative to the current pattern of land use.
When other factors are considered, overall profitability may be improved. The E1-2, BA-1 and G1-2 allocations in Fig. 6 are all effective in reducing the capital equipment costs of the unit by eliminating the arable enterprise. Arable enterprises are characterised by the need for expensive machinery and even allowing for extended lifespans, the cost of such machinery can be prohibitive for upland, mixedfarming systems. A further analysis using contractors for such operations could, however, change the balance, particularly where a premium is available for the use of feed-stuffs grown on-farm. In the mid-range of solutions (G2 to G1-1 in Fig. 6) the increasing diversity of land use by adding forestry enterprises results in increased labour demand. This analysis has, however, only considered the first five years of 50–70 year rotations.
34
K.B. Matthews et al. / Agricultural Systems 87 (2006) 18–37
There is significant labour demand in establishing plantations, particularly for site preparation and planting. The level of longer term labour demand for management operations, such as thinning, could be limited and periodic, with harvesting of relatively small areas probably conducted by contractors. It is possible to stagger the establishment of plantations to achieve a reduced but sustained level of demand. In any case these more diverse patterns of land use suffer up to 20% reductions in NPV. Allocation G1-2 was proposed as a reduced labour input system, and the RST analysis indicates that it has indeed reduced labour requirements (c. 10%) and reduced capital and operational costs. This would increase its profitability. This allocation also proposed renting-out all the suckler-cattle land, and this would further reduce the cost base and improve margins. The G1-2 solution, however, has significant social costs and makes little improvement to the diversity of land use compared with the current allocation. The allocation proposed by BA1 fell well away from the Pareto-optimum front defined by the land-use planning tools (see Fig. 3). With the further RST analysis, allocation BA1 is seen as remarkable as it maintains employment levels (within the limits noted previously for forestry) while greatly reducing operational and capital costs.
5. Discussion and conclusions For the primary objective of this paper it was determined that the land-use plans derived by the mGAs were broadly comparable with individual delegate allocations. The mGAs thus provide an adequate means of simulating a range of possible outcomes for particular multi-objective planning problems defined by the fitness functions used. Given that the DSS incorporates policy instruments as part of its impact assessments there is significant potential for case-based, counter-factual analysis of policy change. With alternative policy scenarios how does the shape of the trade-off change and how potentially does the mix of land uses alter? The mGA analysis also provides a means of presenting the costs and benefits of particular choices relative to a range of alternative plans. Where there is conflict between objectives, particularly conflict between the objectives of different stake-holders, then the mGA analysis may provide a means of making the trade-offs explicit and assist in conflict resolution. The realism of the range of allocations proposed by the mGAs is dependent on identifying and incorporating into the DSS the key constraints within which decision makers are operating. Hard constraints include regulatory controls or quotas with financial penalties for non-compliance but also social constraints that while appearing soft have significant impacts on the standing of individual decision makers. Examples from the workshop include the consensus that removal of the existing woodlands was unacceptable since it causes a highly visible change to the rural landscape and the need to maintain high standards of animal welfare. Softer constraints include the preferences for a portfolio of land uses so that risk is minimised by selling
K.B. Matthews et al. / Agricultural Systems 87 (2006) 18–37
35
into different markets. This was seen as particularly relevant to livestock-based systems where there are significant time lags in being able to respond to market opportunities. While there are a wide range of possible constraints the workshop processes and the comparison of delegate with mGA allocations was effective in identifying the key constraints that define feasible and acceptable patterns of land use. It has proved possible to incorporate the constraints identified within the DSS either as part of the impact assessments or as elements of the land use planning tools and to improve the functionality of the DSS. The secondary objective of the paper was to compare the mGAs with a groupbased decision-making process. In this case there was evidence that the process of compromise between the delegates resulted in allocations that performed less well than the individual allocations, as measured by the DSS metrics. The process of group decision making did, not unlike the mGA, identify and preserve the key features of individual allocations and recombine these to form best-compromise group allocations. The reason for this failure was that there was no way for the delegates to get feedback on the performance of their composite plans as they evolved. There had been a deliberate decision to minimise the intrusion of the DSS into the workshop with only the outputs of the DSS presented. The focus was on the delegates and their ideas, not on the technology. Perhaps the performance of the SGs strengthens the case for interactive use of the DSS to assess proposed solutions in near real-time to give feedback to participants and more strongly engage in a learning process. There are, however, dangers of the technology dominating and constraining the creativity of the delegates. Practical management concerns, particularly the desire for land-blocks of some land uses to be spatially contiguous, was hypothesised as a possible reason for differences between the practitioner allocations and those of the mGAs. Further analysis incorporating the spatial-contiguity constraints within one of the mGAs resulted in a closer fit between the land manager and mGA allocations. Incorporating such constraints into optimisation-based planning tools to avoid ‘‘over-fitting’’ that results in impractical allocations is clearly important and the deliberative workshop is an effective means of identifying the necessary constraints. The analysis of the delegate allocations taking into account on-farm resources emphasised the wide range of possible strategies available to land mangers to achieve the same goal. The analysis emphasised that it is important to explore with practitioners the strategy underlying their plans since this will have a profound effect on how the plans should be evaluated. The process used to negotiate the underlying assumptions for the planning exercises should perhaps have been extended to include formally building a consensus on the metrics that should be used to measure financial performance and diversity. Such a process could be seeded with existing metrics supported by the DSS but would have to allow for using novel metrics suggested by participants. Incorporating new metrics does of course impose a development overhead that compromises using the DSS and land-use planning tools interactively. There can thus be a trade-off to be made between using delegate preferred metrics and on-the-day interactivity. The mGA based approach is, however, notably flexible since the mGAs can draw on any of the metrics provided by the DSS.
36
K.B. Matthews et al. / Agricultural Systems 87 (2006) 18–37
While the mGA based land-use planning tools clearly have potential in researching and deliberating on multi-objective land-use planning problems it is also clear that to be fully effective they need to be deployed as part of a flexible process that includes stake-holders or other domain experts. How central to the process the DSS and the planning tools should be remains an open question with trade-offs between the benefits of an interactive learning approach and the constraints of a computer-focused rather that people-focused workshop.
Acknowledgement The research for this paper is funded by the Scottish Executive Environment and Rural Affairs Department, the Macaulay Development Trust and Scottish Enterprise (Grampian). Particular thanks are due to Dr. Drennan Watson of LandWise Scotland who facilitated and assisted in organising the workshop.The authors also acknowledge the assistance provided by the wide range of researchers, consultants and practitioners who have collaborated in the development of the DSS.
References Beedasy, J., Whyatt, D., 1999. Diverting the tourists: a spatial decision-support system for tourism planning on a developing island. JAG 1 (3–4), 163–174. Boehlje, M., Eidman, V., 1984. Farm Management. Wiley and Sons, New York. Carver, S.J., 1991. Integrating multi-criteria evaluation with geographical information systems. International Journal of Geographical Information Systems 5 (3), 361–367. Chadwick, L. (Ed.), 2002. The Farm Management Handbook 2002/03, 23rd ed. Scottish Agricultural College. Coello Coello, C., van Veldhuizen, D., Lamont, G., 2002. Evolutionary Algorithms for Solving MultiObjective Problems. Kluwer Academic, New York, 576 pp. Ducheyne, E., de Wulf, R., de Baets, B., 2001. Bi-objective genetic algorithm for forest management: a comparative study. In: Goodman, E. (Ed.), Proceedings of the 2001 Genetic and Evolutionary Computation Conference (GECCO 2001). Morgan Kaufmann, San Francisco, pp. 63–66. Fonseca, C.M., Fleming, P.J., 1995. An overview of evolutionary algorithms in multiobjective optimization. Evolutionary Computation 3 (1), 1–16. Forman, R., Godron, M., 1986. Landscape Ecology. Wiley and Sons, New York. Goldberg, D., 1989. Genetic Algorithms in Search, Optimisation and Machine Learning. Addison-Wesley, Reading, MA. Landwise Scotland, 1997. Identifying Land Use Choices for LADSS. Unpublished. Matthews, K., 2001. Applying genetic algorithms to multi-objective land-use planning, PhD Thesis. The Robert Gordon University, Aberdeen, UK. Matthews, K., Buchan, K., 2003. Evaluating labour requirements within a multi-objective land use planning tool. In: Post, D. (Ed.), Integrative Modelling of Biophysical, Social and Economic Systems for Resource Management Solutions, Vol. 4, General Systems of Proceedings of the Modelling and Simulation Society of Australia and New Zealand (MODSIM), Townsville, Australia, pp. 1534– 1539. Matthews, K., Buchan, K., Sibbald, A.R., Craw, S., 2002. Using soft-systems methods to evaluate the outputs from multi-objective land use planning tools. In: Rizzoli, A. et al. (Eds.), Integrated Assessment and Decision Support: Proceedings of the 1st biennial meeting of the International
K.B. Matthews et al. / Agricultural Systems 87 (2006) 18–37
37
Environmental Modelling and Software Society, vol. 3. University of Lugano, Switzerland, pp. 247– 252. Matthews, K., Craw, S., Elder, S., Sibbald, A., MacKenzie, I., 2000. Applying genetic algorithms to multiobjective land use planning. In: Whitley, D. et al. (Eds.), Proceedings of the Genetic and Evolutionary Computation Conference (GECCO 2000). Morgan Kaufmann, San Francisco, Las Vegas, USA, pp. 613–620. Matthews, K., Craw, S., MacKenzie, I., Elder, S., Sibbald, A., 1999. Applying genetic algorithms to land use planning. In: Petley et al., G. (Eds.), Proceedings of the 18th Workshop of the UK Planning and Scheduling Special Interest Group. UK Planning and Scheduling Special Interest Group, University of Salford, pp. 109–115. Matthews, K., Sibbald, A., Craw, S., 1999b. Implementation of a spatial decision support system for rural land use planning: integrating GIS and environmental models with search and optimisation algorithms. Computers and Electronics in Agriculture 23, 9–26. McCown, R., 2002. Changing systems for supporting farmersÕ decisions: problems, paradigms and prospects. Agricultural Systems 74, 179–220. Munton, R., 1997. Sustainable Development: A Critical Review of Rural Land Use Policy in the UK. In: Agricultural Restructuring and Sustainability, A Geographical Perspective, Number 3 in Sustainable Rural Development, CAB International, pp. 11–24 (Chapter 1). Scottish Executive, 2001. A forward strategy for Scottish agriculture. Technical Report, Agricultural Strategy Group. Scottish Executive, 2002. Custodians of change. Technical Report, Agriculture and Environment Working Group. van Beek, P., 1995. A review of decision support tools (DSTs). Technical Report, Macaulay Land Use Research Institute. van Beek, P., Nunn, J., 1995. Introduction to Rapid Appraisals. SyTREC Pty Ltd.. van Veldhuizen, D.A., Lamont, G.B., 2000. Multiobjective evolutionary algorithms: analysing the state of the art. Evolutionary Computation 8 (2), 125–147. Zitzler, E., Thiele, L., 1998. An evolutionary algorithm for multiobjective optimisation: the strength pareto approach. TIK-Report 43, Institute fu¨r Technische Informatik and Kommunikationsnetze, Zu¨rich.