COMBINATION OF STATISTICAL AND RULE-BASED APPROACHES FOR SPOKEN LANGUAGE UNDERSTANDING Ye-Yi Wang, Alex Acero, Ciprian Chelba, Brendan Frey* and Leon Wong Microsoft Research, One Microsoft Way, Redmond, Washington 98052, USA *Electrical and Computer Engineering, University of Toronto
ABSTRACT A Natural User Interface (NUI), where a user can type or speak a request, is a good complement to the well-known Graphical User Interface (GUI). Accurately extracting user intent from such typed or spoken queries is a very difficult challenge. In this paper we evaluate several techniques to extract user intent from typed sentences in the context of the well-known Airline Travel Information (ATIS) domain, where we want to extract which of the possible tasks the user wants to do and the value of the slots associated to that task. In previous work we showed that a Semantic Context Free Grammar (CFG) semi-automatically derived from labeled data can offer very good results. In this paper we evaluate several statistical pattern recognition techniques including Support Vector Machines (SVM), Naïve Bayes classifiers and task-dependent n-gram language models. These methods can yield a very low task classification error rate. If used in combination with our CFG system, they can also lead to very low slot error rates.
1. Introduction Statistical pattern recognition and grammar-based parsing technologies have been successfully applied for spoken language understanding (SLU). Statistical classifiers are very robust, can be easily trained and require little supervision during learning but they often suffer from poor generalization when data is insufficient. Grammar-based robust parsers are expressive and portable, can model the language in granularity, and are easy to modify by hand to adapt to new language usages. Although grammars are learnable, they often require more supervision. While they can yield an accurate and detailed analysis when a spoken utterance is covered by the grammar, they are less robust for those sentences not covered, even with robust understanding techniques. Because of this, the statistical classifiers are often used for broad and shallow understanding, and robust parsers are frequently used for narrow and deep understanding in a specific domain [1, 2], where grammars can be crafted carefully to cover as many usages in the domain as possible. The tasks of language understanding span a wide spectrum. Some tasks only need very shallow understanding --- they require task classification plus the identification of some simple constituents, such as phone and credit card numbers. Others require very deep understanding in great details.
1.1 Task Classification Task classification is the problem of identifying the topic of an input (e.g. ShowCapacity is the topic for “what’s the capacity of seven three seven”.) and it is a typical pattern recognition
problem. Applications of task classification include call routing and information retrieval [3-5]. In this paper, we study several statistical pattern recognition techniques, including task n-gram, Support Vector Machines (SVMs) and Naive Bayes classifiers for task classification in ATIS. We also investigated different approaches to integrate rule-based systems with statistical classifiers for task classification.
1.2 Rule-based Semantic Analysis Task classification is insufficient for applications that need more detailed information. If a user wants to find specific information about a flight, it is not sufficient to know that the task of user’s utterance is ShowFlight. The SLU component should also be able to extract the detailed information (slots) about the flight from user’s utterance, such as departure and destination cities. Statistical classifiers are not capable of this type of deep understanding. Often the task is performed with a rule-based semantic analysis [1, 2]. In [2, 6] we introduced a rule-based understanding system, and in [7, 8] we showed that semiautomatic grammar learning that incorporates multiple sources of information is a viable solution for grammar authoring. We compared our baseline semantic grammar based system with SVM, Naïve Bayes classifier, task n-grams, as well as combinations of the rule-based and statistical approaches on the Airline Travel Information System (ATIS) domain. The paper starts with a description of the experimental settings, followed by a brief introduction of the classification algorithms, several combined approaches and experimental results.
2. Experimental Setting 2.1 Data and Semantic Representation We used ATIS3 set A (sentences that can be interpreted without context) training set and the 1993 test data in our experiments. The training set contains 1424 sentences, and the test set contains 435 sentences. The vocabulary size is 464. Each sentence belongs to one of six possible tasks: ShowFlight, ShowCapacity, ListTranportation, ShowAirlineServeCity, ListAirport and ExplainCode. Among those, ShowFlight, occurs 78% of the time in the test set, so a naïve approach that selected this task all the time would have a task error rate of 22%. In addition to task ID, each task can have several slots defined in a semantic frame. The structure of the semantic frame was derived from the CMU Phoenix semantic grammar, as described in [8]. The example below shows the semantic representation for “List flights from Boston to Seattle”:
In this example, the name of the top-level frame, ShowFlight, is the task class for the sentence; the path from the root to the leaf, like , are slots in the semantic representation. We need to make sure we have enough training data to build statistical pattern classifiers. Unfortunately, for two of the six tasks (ShowCapacity and ShowAirlineServeCity), there are no training samples. For a third task (ExplainCode) there was one task/slot combination for which no data was available in the training data. As in [8], we augmented the training set with the nine sentences below: ShowCapacity: What is the capacity of the aircraft m eight zero How many people can m eight zero hold Tell me the capacity on m eight zero
ShowAirlineServeCity: List the cities served by united List the cities that united flies to What cities does united serve
ExplainCode: Which airline is a s What is the abbreviation u s Tell me about the m eighty aircraft
2.2 Baseline System We used a semantic-based SLU as our baseline system. It includes a robust parser that uses the ATIS grammar developed with our grammar-learning algorithm [7]. The automatically derived CFG system described in [8] had a task error rate of 5.01% and a slot error rate of 7.67%. For comparison, the CMU Phoenix system, the best system in the 1994 ATIS evaluation, had a task error rate of 5.52% and a slot error rate of 9.94%. This evaluation metric differs from that reported in [1] in that we computed the slot error rate as the sum of slot insertions, substitutions and deletions over the total number of slots in the test set. We computed the task classification error rate as the number of incorrect task labels over the total number of sentences.
3. Statistical Classification In this section we describe briefly the three pattern recognition techniques we used in this paper: Naïve Bayes classifier, SVMs and task-dependent n-gram models.
3.1 Naive Bayes Classifier Let’s define feature vector w of dimension V, the vocabulary size, with binary elements (features): 1 if a given word is present in the query or 0 otherwise. The Naive Bayes classifier [9] assumes independence among input features. Therefore, given an input vector w, its target class can be found by choosing the one with the highest posterior probability: cˆ = arg max P (c | w ) = arg max P(c) P (w | c) c
c
= arg max P (c)∏ P ( wi | c ) c
(1)
i
where P ( wi = 1| c) is the probability that word i appears in a query of class c, and P ( wi = 0 | c ) is the probability that word i does not appear in a query of class c. Due to data sparseness, P ( wi | c) is estimated as p ( wi = 1| c) =
N ci + β , N c + 2β
(2)
p ( wi = 0 | c) = 1 − p ( wi = 1| c) where N c is the number of queries for class c in the training data, N ci is the number of times word i appeared in such queries. A single prior count β is used to smooth all probabilities, which was tuned to maximize the classification accuracy of crossvalidation data.
3.2 Support Vector Machines (SVMs) SVMs [10] learn discriminatively by finding a hyper-surface in the space of possible inputs of feature vectors. This hypersurface will attempt to split the positive examples from the negative examples. The split will be chosen to have the largest distance from the hyper-surface to the nearest of the positive and negative examples. Intuitively, this makes the classification correct for testing data that is near, but not identical to the training data. We used the Sequential Minimal Optimization, a fast method to train SVMs [11] in our experiments. The same binary features used in Naïve Bayes classifiers are used for SVMs. The cross-validation switch in the training procedure was used due to data sparseness.
3.3 Task-dependent N-gram Models If we view words as values of a random variable instead of binary features, Eq. (1) can be decomposed in a different way: cˆ = arg max P (c ) P (w | c) c
= arg max P (c)∏ P ( wi | c, wi−1 , wi− 2 ,…, w1 ) c
(3)
i
where independence assumptions can be made to use a taskspecific unigram P ( wi | c ), bigram P ( wi | c, wi −1 ) or trigram P ( wi | c, wi −1 , wi − 2 ) .
Let’s note that the task unigram and the Naïve Bayes classifier defined in Section 3.1 are not the same because the vector in the Naïve Bayes case has a length equating the vocabulary size and
thus assigns probability to a word being/not being there, whereas for the task unigram only words that are present in a given sentence contribute to the score. The n-gram probabilities for the class specific language models are estimated using linear interpolation of relative frequency estimates at different orders: 0 (uniform), …, n-1 (n-gram). The linear interpolation weights at different orders are bucketed according to context counts and their values are estimated using ML on cross-validation data [12]. The n-gram counts from the cross-validation data are then added to the counts gathered from the main data to enhance the quality of the relative frequency estimates.
4. Combining Statistical classification and grammar based understanding 4.1 Task Classification While the statistical pattern recognition techniques described in Section 3 are robust for task classification, they often face the data sparseness problem and do not generalize well. Besides, they are not portable: we cannot recognize an airport name that was not present in the training data. On the other hand, semantic grammars are very portable. A new airport can be easily introduced by adding a new rewrite rule in the grammar. They also provide a good generalization mechanism: if we know that both Seattle and Boston are cities, we can predict that Seattle can appear in the same context as Boston. Potential improvement can be achieved if we include CFG nonterminals as features in the statistical classifiers. In doing so, statistical classifiers inherit the portability and generalization offered by a rule based system. It is fairly easy to create good grammar for city names, aircrafts, airlines from the database, and it is possible to reuse domain independent grammars for frequently used phrases, like date and time. We experimented with using the following 19 non-terminals from the semantic grammar in [7] as features in the statistical classifiers: Aircraft, Airline, City, Class_Type, Date_Range, Earliest, Fare_Basis_Code, Flight_Num, Highest, Latest, Lowest, Meal_Type, Num_Stops, One_Way, Price_Range, Restriction_Code, State, Time_Range and Transport_Type
The training and test data are preprocessed with the semantic parser [6] to identify the non-terminals. The non-terminals are then introduced as features. Sometimes there may be ambiguities: multiple non-terminals may cover the same words. In this case, we include all non-terminals that match input substrings.
4.2 ROVER of Different Classification Results We can also combine the classification results in a simple ROVER system. We applied three different classifiers: SVM, ngram models and the Naïve Bayes classifier to identify the task for sentences, and used majority vote to pick the target class. When the three classifiers did not agree with each other, we
picked the task identified by SVM, which had the best task classification result among the three.
4.3 Two Stage Understanding Task classification is insufficient for many applications which require slots such as the departure/arrival city, date and time, airlines, etc. While semantic grammars are capable of this type of deep analysis, they may not be as robust as statistical classifiers in determining the task. Suppose that a grammar has the following rule: ShowCapacityCommand Î show seating capacity
This rule will not cover the trigram “show the capacity” in the sentence “show the capacity of Boeing 747” since the robust parser only skips the unparsable inputs but not the rule symbols. Therefore the sentence may not be understood correctly as a ShowCapacity sentence, and the parser will simply map part of trigram to other non-terminals, in this case, ShowFlightCmd Î show, and misunderstand the command as ShowFlight. Statistical classification may not suffer from this problem because of the capability to learn that the existence of the word “capacity” is an important feature for classification. In the two-stage SLU, we apply the statistical classifier first to obtain the task class for a command, and then we dynamically modify the grammar [2] such that the robust parser will only apply the grammatical rules related to the identified task class.
5. Experimental Results We first run the task classification experiments with the three statistical classifiers (The error rate for semantic grammar was 5.01% as reported in [8]). For both SVMs and Naïve Bayes we used 464 binary word features, augmented the feature set with the 19 semantic non-terminals or substituted those words with their nonterminals. Table 1 shows the impact of including the semantic non-terminals on task classification. We have checked the statistical significance (sign test) of the “Words only” models versus their “Substitutional” counterpart. The only significant improvements were obtained for SVM (p-level=0.09) and for Naïve Bayes (p-level=0.01). The improvement achieved by the “Substitutional” SVM over its Naïve Bayes and bigram counterparts was not significant. SVM
Naïve Bayes
unigram
bigram
Words only
2.99%
4.83%
3.68%
3.22%
Augmentative
3.45%
4.14%
3.68%
3.68%
Substitutional
1.84%
2.53%
4.37%
2.99%
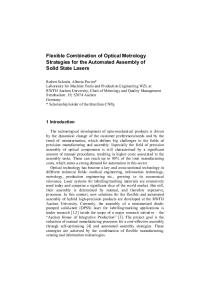
Table 1. Task Classification error rate. The baseline used word in the training samples as features. The semantic nonterminals were included in two different modes. In augmentative mode, a non-terminal was inserted in front the words covered by it. In substitutional mode, a non-terminal substituted all the terminal words covered by it. Figures 1 and 2 plot the learning curves for SVMs and the Naive Bayes Classifier as a function of training data.
We then combined the classification results of the three top classifiers, namely the SVM, n-gram models and the semantic grammar based robust parsing with the simple ROVER scheme mentioned earlier. The resulting classification error rate was 1.84%, which is the same as the SVMs. Classification error rate
10% 8%
While the ROVER experiment did not show any improvement on ATIS, we believe that it is because the SVM error rate is already very low, and the other classifiers’ performance is not good enough compared to SVM. In an experiment with another domain, we did observe that the ROVER approach decreased the classification error rate from 16% to 11.5%. We also tried including different non-terminal sets as features for statistical classification. The results show that richer nonterminals sets result in slightly better performance (1.61%) on SVM, but worse performance on Naive Bayes and bigram.
6% 4% 2%
7. Acknowledgements
0% 0
300
600 900 Number of training sentences
1200
Figure 1. SVM Learning Curve. The dashed curve is for word-only features whereas in the solid curve is semantic non-terminals replaced the corresponding words.
12%
Classification Error rate
6. Discussion and Summary
10% 8% 6% 4% 2% 0% 0
300 600 900 1200 Number of training sentences
Figure 2. Naive Bayes Classifier Learning Curve. The dashed curve is for word-only features whereas in the solid curve is semantic nonterminals replaced the corresponding words.
In the two-stage SLU experiments, we use the SVMs to identify the task class first, and then restricted the robust parser to use only the grammatical rules related to the identified task class. Table 2 shows that the two-stage approach improved the performance significantly in both task classification and slot identification. Task Classification
Slot Identification
Robust Semantic Parser
5.01%
7.67%
Two-Stage SLU
1.84%
5.98%
Table 2. Task classification and slot identification error rates of the robust semantic parser and the two-stage SLU which uses an SVM for task classification and then used the identified target class to restrict the grammatical rules used by the parser to identify the slots.
The authors would like to thank John Platt for the help with the SMOX SVM learning tool, and thank Susan Dumais, David Heckerman, X.D. Huang, Kai-Fu Lee, Scott Meredith and John Platt for their insightful suggestions.
8. References [1] Ward, W. “Recent Improvements in the CMU Spoken Language Understanding System” in Human Language Technology Workshop 1994, Plainsboro, New Jersey. [2] Wang, Y.-Y. “Robust Spoken Language Understanding in MiPad” in Eurospeech 2001, Aalborg, Denmark. [3] Carpenter, B. and J. Chu-Carol. “Natural Language Call Routing: a Robust, Self-organizing Approach” in International Conference on Speech and Language Processing, 1998, Sydney Australia. [4] Dumais, S., “Using SVMs for Text Categorization” in IEEE Intelligent Systems Magazine, Trends and Controversies, 1998. 13(4). [5] Gorin, A., “On Automated Language Acqusition” in Journal of Acoustical Society of America, 1995. 97(6): p. 3441-3461. [6] Wang, Y.-Y. “Robust Parser for Spoken Language Understanding” in Eurospeech 1999, Budapest, Hungary. [7] Wang, Y. and A. Acero. “Grammar Learning for Spoken Language Understanding” in IEEE workshop on Automatic Speech Recognition and Understanding, 2001, Madonna di Campiglio, Italy. [8] Wang, Y.-Y. and A. Acero. “Evaluation of Spoken Language Grammar Learning in ATIS Domain” in ICASSP 2002. Orlando, Florida. [9] Duda, R.O. and P.E. Hart. Pattern Classification and Scene Analysis, 1973, New York, Wiley. [10] Burger, C.J.C., “A Tutorial on Support Vector Machines for Pattern Recognition” in Data Mining and Knowledge Discovery, 1998. 2(2): p. 121-167. [11] Platt, J.C. “Fast Training of Support Vector Machines Using Sequential Minimal Optimization” in Advances in Kernel Methods -- Support Vector Learning, B. Scholkopf, C.J.C. Burger, and A.J. Smola, Editors. 1999. p. 185--208. [12] Jelinek, F. and R. Mercer. “Interpolated Estimation of Markov Source parameters from Sparse Data” in Pattern Recognition in Practice, D. Gelsema and L. Kanal, Editors. 1980, North-Holland.