Published in Proceedings of Sixth Internationl Symposium on Tools and Methods of Competitive Engineering TMCE 2006, April 18–22, 2006, Ljubljana, Slovenia
REAL-TIME MEASUREMENT OF PERCEPTUAL QUALITIES IN CONCEPTUAL DESIGN Michael Bittermann Department of Building Technology Delft Technical University The Netherlands
[email protected]
Őzer Ciftcioglu Department of Building Technology Delft Technical University The Netherlands
[email protected]
ABSTRACT Implications of design decisions are hard to oversee for designers. This is the case in particular with respect to decisions, which influence perception related qualities of designs. Such qualities are for example visual openness, visual privacy, and spatial intimacy. They are difficult to measure because of their subjective and soft nature. Measurements of such qualities are important because they are basis for user-oriented, optimal decisions in architectural and interior design. Existing attempts in the architecture domain to assess such qualities systematically are not based on models of visual space perception. Their ability to assess perception aspects of designs is limited. In this paper a novel real-time measurement system for design is presented, which is based on a computational model of visual space perception. This perception model consists of a vision model and a space cognition model. The vision model is based on retrieval of spatial depth data in scattered form. This process is termed random direction distance sampling (RDDS). The space cognition model consists of sample-wise mapping of depth data to perception data, which is space cognition, and exponential averaging, which is a time-series analysis method, for integration of the perception data to perception information, which is the measurement outcome.
KEYWORDS Visual space perception, vision, space cognition, memory-time, computational design
1. INTRODUCTION Design is a complex process. This complexity stems from ill-defined, and time-varying design
requirements, as well as voluminous solution spaces. Design requirements generally include requirements for perceptual design qualities. Systematic assessment of such qualities is a traditional bottleneck in design, in particular in architecture and interior design. Such qualities are visual openness, visual privacy, and spatial intimacy. In the domain of mechanical engineering such spatial properties are relevant for example in the design of a production facility, where visibility of certain areas for supervision is a design requirement. Assessment of such perceptual qualities of spaces is imperative to evaluate the satisfaction of design requirements, which is an essential component in design optimization. Outcomes of requirement satisfaction assessment guide the search for optimal design solutions. Real-time provision of measurement outcomes is rather necessary to ensure efficient and effective optimality search, and to allow real-time adjustment of requirements in course of design. This is necessary due to the sensitivity of design processes with respect to timely provision of information. Although real-time is originally invented in relation to computer-based process systems, it is a far reaching concept, which is valid for a variety of processes where computers may not even be involved. In process systems it pertains to a data collecting system that controls an on-going process and delivers its outputs (or controls its inputs) not later than the time when these are needed for effective control. In general, the real-time concept refers to a fast enough response that is so rapid that the interaction and the ensuing outcome appear to be timely for use. An example of a real-time application is video-conferencing. With this understanding, in this work real-time refers to measurement outcomes, which are timely delivered by a measurement system
231 1
Published in Proceedings of
for use by designers, whose design decisions are based on the measurement outcomes and still their decisions are uninterrupted. This means he/she does not have to wait in the meanwhile for the measurement outcomes, during the on-going design process. The central question addressed in this paper is the following: How can perceptual qualities of designs be measured in real-time? Existing attempts in the architectural domain to assess perceptual qualities are not based on models of visual space perception. They are generally based on conventional computations of spatial component information, such as relative amount of openings in spatial enclosures (Koile, 2004, Franz et. al, 2005). The methods in use are generally based on Isovist analyses or analyses of graph theoretic design representations (Hillier et al., 1984). Isovists, which were introduced by Benedikt in 1979 (Benedikt and Burnham, 1981), are polygons, which enclose the volume directly visible from a location within a space. In many applications they were further simplified to the horizontal slices of these volumes at eye-height (Do and Gross, 1997). These polygons are generally defined by the edges of walls and other visually occluding objects. Using Isovists for spatial analyses, some characteristic properties of visual space perception are simplified or not considered, so that the integrity of the results, which are obtained via these methods, is challenged. In isovist-based methods all spatial directions are considered equally significant in the analysis. This does not represent the phenomenon of the visual field, in which blurriness varies from a sharply perceived centre to the blur periphery of the field. Regions, which are not viewed, contribute differently to the perceived spatial property than regions, which are in visual focus. A second incompatibility of isovists with visual space perception originates from cognitive aspects in space perception. The distances between a perception location and positions in a surrounding spatial shape vary. Human space cognition apparently interprets this variation as a space with a certain perceptual property. The relation between retrieved distances and perceived spatial property must be considered non-linear. This is easily substantiated considering that distances which are very great, such as positions in the blackness of the night sky, can be accounted for together with the relatively much more proximate spatial shapes surrounding a perceiver. Isovist methods do not consider such probable non-linearity in distance interpretation in the assessment of a perceived spatial property. In the graph-theoretic
2
design representations mentioned above, design elements are represented as nodes, which are linked in a network structure. Graph properties, such as mean shortest path length, etc. can be identified. Such graph analyses results are considered to be correlated with certain perceptual qualities (Turner et al., 2001). However, graphs identify visible locations only indirectly, via an imposed network grid, and not directly in terms of physiological visibility. Both, Isovist and graph based approaches are not based on modelling the visual space perception process. Due to sensitivity of visual space perception regarding the constitution of the visual field as well as the cognitive procedure involved in the interpretation of retrieved visual data, their ability to assess perceptual design qualities is limited. Next to that, the need for real-time provision of measurement outcomes, which is typical for design, is a challenging demand for the existing methods due to the character of their computational methods. In this paper a new real-time measurement system for design is presented, which is based on a computational model of visual space perception. Before coming to the explanation of the perception model and the measurement system, firstly the perceptual qualities, which are measured in this research, are concisely defined as follows.
2. DEFINITIONS 2.1. Perceptual qualities Perceptual qualities are among the properties of a design, which influence the human perception of the design product. Examples of perceptual qualities are visual openness, visual privacy, and spatial intimacy. They are inherent to design, because their existence and constitution are immanently linked to the existence and constitution of the design. The inherence is valid provided that the geometric constitution of the design remains unchanged. Because they are inherent to a design, they can be assessed during the design in place of afterwards, and they can be verified afterwards if that would be desired so.
2.2. Visual openness Visual openness is an inherent quality of a design, which describes how much a design allows for visual perception of distant positions. In the following, firstly the definition of visual openness of a single geometric position in a design is given, secondly the visual openness of a design as a whole is defined. The visual openness of a position in a design
232
Published in Proceedings of
describes how much a design permits retrieval of visual data from distant positions. Generally, opaque spatial shapes, such as walls, columns, furniture, etc. prevent visual perception of distant positions. The visual openness of a design is the combined visual openness information coming from visual openness assessments of a number of relevant positions in a design.
2.3. Visual privacy Privacy, in general, is the ability of an individual to govern availability of his/her information. As an inherent quality of an architectural design, privacy indicates, how much a design enables government of availability of information. Information of concern, in context of architectural design, is primarily of acoustic and visual nature. Privacy in architecture is consequently including visual privacy and acoustic privacy. Visual privacy of a position in a design describes how much a design prevents retrieval of visual data of that position from other positions in the design. Generally, opaque elements, such as walls, columns, furniture, etc. prevent visual data retrieval from positions in the environment surrounding the position. The visual privacy of a design is the combined visual privacy information coming from visual privacy assessments of a number of relevant positions in a design.
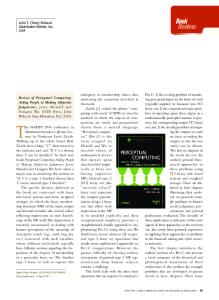
which is obtained from the environment surrounding a perceiver. It is assumed that distances of positions surrounding a perceiver can be obtained accurately by visual space perception, considering a large number visual depth cues in a perceived environment under normal spatial circumstances. Figure 1 shows the schematic setup for the visual perception model, which is the innovation in this research. VISUAL SPACE PERCEPTION MODEL VISION MODEL
SPACE COGNITION MODEL
GAUSSIAN SHAPING
RANDOM SOURCE
BUTTERWORTH/ SIGMOID MAPPING
EXPONENTIAL AVERAGING
MODEL OF VISUAL FIELD 1
*
COGNITION 1
INTEGRATION 1
MODEL OF VISUAL FIELD 2
*
COGNITION 2
INTEGRATION 2
MODEL OF VISUAL FIELD 3
*
COGNITION 3
INTEGRATION 3
DISPLAY
*INTERACTION WITH ENVIRONMENT
Figure 1 Scheme of visual space perception model Three simultaneous perception processes are shown in figure 1, each of which includes a specific model of visual field, cognition, and integration. They refer respectively to the measurement of the perceptual qualities visual openness, visual privacy, and spatial intimacy, which are defined in section 2.
2.4. Spatial intimacy
3.1. Modelling human vision
Spatial intimacy is an inherent quality of a design. Firstly the definition of spatial intimacy of a single geometric position in a design is given; secondly the spatial intimacy of a design as a whole is defined. As an inherent quality of an architectural design spatial intimacy of a position in a design describes, how much that position is enclosed by nearby opaque spatial shapes. The spatial intimacy of a design is the combined spatial intimacy information coming from spatial intimacy assessments of a number of relevant positions in a design.
Essential perception task is continuous retrieval and interpretation of distance-data coming from positions surrounding the perception position. The perception model presented here is a cyclopean model, which means the visual apparatus is represented with a single geometric point. The process of retrieving visual data from the environment is modelled in this research by a novel randomized sampling process, which is termed random direction distance sampling (RDDS). The perception model is initialized by continuous generation of sightlines with random directions. Three uniform random numbers are used as components of a 3-dimensional direction vector. The utilization of random vectors as source for the directions of the sightlines is necessary to enable real-time update of the measurement outcome, which is important in design. The vector components of the direction of each sightline are shaped by means of a Gaussian function given by (1).
3. MODELLING VISUAL SPACE PERCEPTION In line with Helmholtz’ definition of vision as a form of unconscious inference, that is a process of deriving probable interpretation for incomplete data (Wade, 2000), and Marr's definition of vision as a process of information processing and representation (Marr, 1982), visual space perception can be defined as the retrieval and interpretation of visual data,
f ( x) = ( x source + x mean ) × x dev
(1)
233 3
Published in Proceedings of
Here xmean and xdev are the mean and the variance in the x direction; xsource is a uniform random number between zero and one; similar notations apply for the other directions. The outcome for each spatial dimension f(x), f(y), and f(z) are the components of the direction vector of the sightlines. For each sightline, this vector is calculated with a new random xsource number. The visual field in this perception model is defined by the probabilistic distribution of the orientation of the generated sightlines. It can be adjusted by modifying the parameters of the Gaussian normal distribution given in (1). A number of sight lines form a field corresponding to the field of vision, so that the field has a greater density of sight lines in its centre and a reduced density in its periphery, which is shown in figure 2.
these samples are continuously processed by means of mapping functions. That is, each depth datasample is interpreted in terms of the specific space perceptual quality by means of an appropriate function, which assigns a perception value to each distance sample. This continuous process is modelling human space cognition. The mapping functions are defined in accordance with the definition of the space perceptual qualities, which are to be measured. In particular the relation between distances x obtained by the sight- lines and the space perceptual quality to be measured is expressed by (2) and (3). In visual openness measurement, preliminarily a sigmoid-based function is used as mapping function given by (2).
1
S= 1+ e
Figure 2 Model of visual space perception This Gaussian function used as probability gradation models the phenomenon of sharpness/blurriness in human vision. This phenomenon is represented in this model through retrieval of less amount of visual information per region in peripheric regions of the visual field. This is modelled by the reduced probability for sight-line direction off the centre direction of the visual field, coming from the shape of the Gaussian function. Complementarily, the sharper focal centre of human vision is modelled through a higher probability for information retrieval in the centre direction of the visual field. Any geometry of visual field can be achieved by means of the parametric adjustment of the Gaussian function.
3.2. Modelling human space cognition Each sightline delivers an individual distance datasample when intersecting surrounding shapes. In the cognition model, which is introduced in this research,
4
⎛ l −l ⎞ − ⎜ x − max min ⎟ 2 ⎝ ⎠
(2)
The variable x is the obtained distance between perception origin and point of intersection of sightline with the volume boundary involved. The parameters lmax and lmin define the sigmoid shift, which is used to adapt the function. The parameter m represents the steepness of the sigmoid curve for S=0.5. In the visual openness measurement, if no spatial shape was intersected, S is considered to be unity assuming that the distance x extends to infinity. In visual privacy and spatial intimacy assessment, preliminarily a Butterworth function is used that is given by (3), where m is the steepness parameter of the Butterworth curve for S=0.5, and l is the parameter used to adapt the function.
S=
1 ⎛ x⎞ 1+ ⎜ ⎟ ⎝l⎠
m
(3)
In the visual privacy and spatial intimacy measurement, if no spatial shape was intersected, S is considered to be zero assuming that the distance x extends to infinity. The function parameters can be modified to adjust the measurement adaptation so that it matches with different definitions of the perceptual quality to be measured. As an alternative to sigmoid and Butterworth functions, mapping functions based on fuzzy membership functions of fuzzy logic can be used. Through fuzzy membership functions the space cognition model can be adjusted in a more detailed way to match any non-linearity in definition of a distance-based space perceptual quality. Visual privacy measurement can be refined by involving accessibility information in modelling the probability of visual information retrieval.
234
Published in Proceedings of
3.3. From cognition to perception Human visual space perception establishes impressions about a perceived environment, which are relatively stabile over time. To model this phenomenon the cognition samples are processed by means of a time-series analyses method borrowed from the domain of signal processing. This method is known as exponential averaging. Exponential averaging identifies average signal-values by means of continuous weighting of signal values using a weight coefficient ω derived from a time constant τ given by (4). 1 (4) ω ≡ 1− τ
The time constant represents the size of a timewindow, in which samples are averaged. The time window moves forward in time, which corresponds to continuous update of the average value expressed by (5). Pq = ωPq −1 + (1 − ω ) S q
(5)
Here Pq is the measurement outcome at the time-step q and Sq is the value of S in (2) and (3), at the timestep q. After some time, that is as more and more samples are processed, the measurement stabilizes at a certain value as shown in figure 3. Contrasting conventional averaging methods, in exponential averaging previously obtained average information is incorporated in the computation of the current average. This way the average, which is the measurement outcome, is updated in real-time in a computationally efficient and effective way (Ciftcioglu and Peeters, 1995).
the time-duration it takes to establish the outcome increases. The value of the time-constant τ in (4) is responsible for the accuracy of the measurement outcome also in terms of reflecting details of the geometric shape of the perceived space. The higher the value used for τ is, the more accurately shape details of the environment are reflected in the measurement outcome.
3.4. Modelling actual time in perception This measurement latency of exponential averaging is proportional to the time constant, provided the processing frame rate is constant. This latency apparently corresponds to the phenomenon of spatial memory in visual space perception. This is particularly relevant concerning perception during transition conditions. Transition conditions are changes in the measurement condition over time, in our case in the form of translation and/or rotation of the cyclopean eye of the measurement system or modifications of the geometry surrounding the eye. The following example serves to illustrate the significance of this inherent property of exponential averaging in relation to visual space perception, in particular to the phenomenon of spatial memory. A person looking around or moving through an environment generally receives different openness impressions at each instance. However, the previous impressions are not forgotten immediately but apparently contribute to a perception at a specific moment in time. This effect is modelled by the latency effect of exponential averaging. Greater values for τ correspond to greater spatial memory for constant frame-rate. Alternatively, greater values of the frame rate speed up the perception process for constantτ. In order to keep spatial memory independent of the frame-rateτ has to be scaled by the frame rate as given by (6), which presents a memory-time concept denoted by µ. µ =τ ×
Figure 3 Plot of a perception process; below: space cognition samples; above: exponential average of them Greater values for the time constant yield more accurate measurement outcomes, since more data is used to identify the perception outcome, however,
1 f
(6)
By doing so, the perception measurement can be calibrated to match in actual time. This means, the measurement of perceptual qualities matches the human assessment of these qualities in actual time. In order to model human visual space perception accurately in actual time it is necessary to calibrate the memory-time µ, so that the human perception and the model assessment are matching for each moment in actual time. Experimental identification of the system variables given by (6) can be conducted,
235 5
Published in Proceedings of
which is beyond the scope of this paper, since framerate is not subject to variation in this research. The parameters of the vision model and space cognition model can be modified in real-time. Thereby the measurement system can be adapted to differently shaped visual field, and different cognition of visual openness, visual privacy, and spatial intimacy. In this work, the assessment process of human perception is particularly referred to as a measurement. The concept of measurement essentially refers to physical sciences where physical measurement systems are used for determining the magnitude, that is, size, length, frequency etc., of physical quantities in terms of related appropriate units. However, a similar act, which aims to determine the level of perception, can be performed in a systematic way, which can have all qualifications of a physical measurement. This is precisely what has been achieved in this work. In the present perception measurement system, the interaction is made with the environment via vision of an agent simulating human perception. The degree of perception is determined via averaging the normalised visual interaction results as described before. The outcome resulting from averaging is the measurement of the perception which is dimensionless due to normalisation and is subject to general measurement errors. This includes a systematic error due to random generation of sight lines, which simulates human vision.
between position1 and position2, which is shown in figure 5.
Figure 4 Real-time measurement of visual openness, visual privacy, and spatial intimacy
4. EXPERIMENT In the following, a number of measurements are presented which were taken from several positions in a design. Figure 4 shows a screenshot taken from an implementation of the measurement model, which was programmed in a C++ based environment. Figure 4 shows measurements, which are taken simultaneously at a location in a design. The measurement position that is shown in the figure is position 1. Figure 5 provides the corresponding plan view for this position and the other measurement positions. The measurement outcomes for each perceptual property are plotted on screen in real-time, which is indicated in figure 4. Although the shapes of the spaces in this implementation are relatively simple, the model deals with any shape complexity. The design contains a number of geometric details, such as facade studs and a screen made from horizontal louvers, which are visible in figure 4. The screen, which is visible in figure 4, is located
6
Figure 5 Plan view of the measurement positions Above Position 1 no ceiling is designed, above all other positions there is a ceiling at 2.65m height, which is about average room height. Height of the measurement positions was chosen to be 1.70 above floor height, which is about average eye height. The parameter settings for the measurement system are shown in table 1. The visual field was set to model 360 degree perception in the horizontal plane with some divergence in vertical direction off the plane. This is done by setting the Gaussian parameter ydev to values different from zero, as given in table 1. Based on tentative previous experiments concerning identification of model parameters, the setting of the cognition parameters, which are given in table 1, can be considered suitable for interior measurements.
236
Published in Proceedings of
Table 1
Parameter settings of system for experiments
measurement
visual openness
visual privacy
spatial intimacy
(xmean, xdev)
(0.00, 1.00)
(0.00, 1.00)
(0.00, 1.00)
(ymean, ydev)
(0.00, 0.02)
(0.00, 0.01)
(0.00, 0.50)
(zmean, zdev)
(0.00, 1.00)
(0.00, 1.00)
(0.00, 1.00)
function
sigmoid
Butterworth
Butterworth
lmax
4.5
7.5
4.0
lmin
1.8
3.0
1.8
m
-
2.0
3.0
time constant τ
400
400
400
vision
cognition
The value of the time-constant τ in (4) is responsible for the accuracy of the measurement outcome. Small values for τ result in gross representation of the perceptual quality of the spatial shape. The higher the value used for τ is, the more accurately shape details of the environment are reflected in the measurement outcome. The time constant setting of (4) in the experiments is τ=400. This setting of the time constant is rather high, which means that the accuracy of the measurement outcome is rather high. This is paid by a rather long process, which establishes the measurement outcome. After sufficient measurement time, the measurement stabilizes at a certain number. This number is the measured value of the perceptual quality given the current system settings. Figure 6 shows the measurement from the positions, which are indicated in figure 5. Figure 7 shows the horizontal section of the same measurements. Note that each perception field consists of differently long groups of rays, which originate from the same position. Each of these groups belongs respectively to the perception modelling of visual openness, visual privacy, and spatial intimacy. The sightlines in shown in figures 6 and 7 are represented with the length of lmax given in table 1, for each quality to be measured. Glass is penetrated fully in this experiment, which means that it is not considered an obstacle for sightline interaction. Interaction with materials, which have a degree of transparency, can be integrated to the cognition model by means of a factor in the space cognition model.
Figure 6 Screenshot of the measurements taken from the positions indicated in figure 5
Figure 7 Horizontal section of the measurements shown in figure 6
5. RESULTS The measurement outcomes, obtained with the model settings given in table 1, and taken from the positions indicated in figure 5 are presented in Table 2. Table 2 Measurement outcomes visual openness
visual privacy
spatial intimacy
Pos 1
0.72
0.34
0.19
Pos 2
0.50
0.48
0.33
Pos 3
0.48
0.50
0.29
Pos 4
0.52
0.49
0.36
Pos 5
0.17
0.80
0.61
Pos 6
0.73
0.33
0.21
237 7
Published in Proceedings of
The outcomes presented in Table 2 are normalized since the sample-wise mapping-functions given by (2) and (3) deliver normalized output. The measured values appear to be in accordance with expectations based on visual inspection. For example the visual openness of position 1 with its long glass façade is higher the visual openness of position 2 with a number of walls preventing sight of distant positions. Possible differences between subjective judgement and measured values may originate from various sources, namely differences in the vision model, and/or differences in the space cognition model. Exact source of such difference can be systematically identified. Such model identification, which is to establish suitable values for the measurement system parameters, can be conducted by means of evolutionary search algorithms, which are a methodology from the domain of Computational Intelligence. Details of this procedure and methodology will be published in the near future. Measurement latency of exponential averaging, mentioned earlier, can be reduced by incorporating Kalman filtering for smoothing into the measurement system. Kalman filtering is a sophisticated modelling methodology from the domain of signal processing. It essentially models the noise inherently existing in a measurement process for improved measurement outcomes. Details of this method are beyond the scope of this paper, since transition conditions are not considered here.
6. CONCLUSIONS The real-time measurement system presented in this paper models human visual space perception. It measures perceptual qualities of spatial shapes in real-time, based on the definitions of these qualities, which are provided. The measurement system can be adapted to match individually different visual perception, including different definitions of perceptual qualities. The system deals with any level of detail of spatial shapes in design. It provides measurements in real-time. Therefore it is particularly suitable for design, where fast response to design modifications is rather necessary in the search for design optimality. Methodologies from the domain of signal processing, in particular exponential averaging, proved to be suitable for computational modelling of human visual space perception. This is an important step towards provision of a suitable ontology for the handling of perceptual design qualities in collaborative, conceptual design. The setting of the time-constant,
8
which is essential in exponential averaging, can be adjusted in real-time according to the computational frame-rate to model human visual space perception in actual time. This is accomplished by introducing the concept of memory-time to perception modelling for design. Next to modelling visual space perception for static situations, in which a perceiver has a fixed position and orientation, it is possible, via application of the memory-time concept, to adapt the perception model, so that it matches the human perception in transition conditions as well. Application potential for such a model is large. In particular safety related way-finding issues in building design are a topical application area.
REFERENCES Benedikt ML, Burnham CA (1985) “Perceiving architectural space: from optic rays to isovists”, Persistence and Change, Warren WH, Shaw RE (eds.), Lawrence Erlbaum Associates, London. Ciftcioglu O, Peeters TTJM (1995) “Statistics on exponential averaging of periodigrams”, IEEE Transactions on Signal Processing, Vol.43, No.7. Do E, Gross MD (1997) “Tools for Visual and Spatial Analysis of CAD Models -- Implementing Computer Tools as a Means to Thinking about Architecture", Proc. CAAD Futures '97, Junge R (ed.), Munich, Germany, pp. 189-202. Franz GM, von der Heyde, Bülthoff H (2005) “Predicting experiential qualities of architecture by its spatial properties”, Designing Social Innovation: Planning, Building, Evaluating,. Martens B, Keul A (eds.), Hogrefe and Huber, Cambridge, MA, pp. 157-166. Hillier B, Hanson J (1984) The Social Logic of Space, Cambridge University Press. Howard I, Rogers B (2002) “Depth perception“, Seeing in Depth, Vol. 2, Porteous. Koile K (2004) “An intelligent assistant for conceptual design”, Proc. Design Computing and Cognition ‘04, Gero JS (ed.), Cambridge, USA, pp. 3-9. Marr D (1982) Vision: A Computational Investigation into the Human Representation and Processing of Visual Information, W.H. Freeman & Co, NY, pp. 29-61. Wade NJ (2000)Helmholtz's Treatise on Physiological Optics, Bristol: Thoemmes Press, pp. 5-11. Turner A, Doxa M, O’Sullivan O, Penn A (2001) “From isovists to visibility graphs: a methodology for the analysis of architectural space”, Environment and Planning B: Planning and Design volume 28, pp. 103121.
238