Bronx Community District 10
See BX 10's profile online
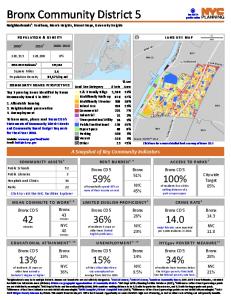
Neighborhoods1: City Island, Co-op City, Country Club, Edgewater Park, Pelham Bay, Schuylerville, Throgs Neck, Westchester Square PO P U L ATI O N & D E N S I T Y 2000-2010
115,948
120,392
+4% 124,045
6.4 18,811/sq mi
COMMUNITY BOARD PERSPECTIVES
Top 3 pressing issues identified by Bronx Community Board 10 in 2017: 1. Crime 2. Parks 3. Street flooding
Public Schools
42
Hospitals and Clinics
13
Parks
5
11
Click to visit the NYC Facilities Explorer
M E A N C O M M U T E T O W O R K 4, 8
Bronx CD 10
44 minutes
Bronx 43 minutes
NYC 40
minutes
E D U C AT I O N A L AT TA I N M E N T 4 , 1 0
Bronx CD 10
25%
of residents 25 years or older have earned a bachelor's degree or higher
y
y Ba
Cross B
Long Island Sound
ron xE xw y
Ea
Na s sa u Cou nt y
i ver st R
Source: PLUTOTM 16v2
Click here for a more detailed land use map of Bronx CD 10
A Snapshot of Key Community Indicators
CO M M U N I T Y A S S E T S 5
Public Libraries
er Exw Bruckn BX 9
m
Av
Website: www.nyc.gov/bronxcb10 Email:
[email protected]
BX 11
Rd
iew dv un So
To learn more, please read Bronx CD 10's Statements of Community District Needs and Community Board Budget Requests for Fiscal Year 2018.
% Lot Land Use Category # Lots Area 1 & 2 Family Bldgs 11,156 30% Multifamily Walk-up 1,860 6% Multifamily Elevator 54 7% Mixed Use 367 2% Commercial 391 7% Industrial 100 2% Transportation/Utility 30 <1% Public/Institutional 138 12% Open Space 82 14% Parking 2% 250 Vacant 756 17% Other 1% 52
Pelham Pkwy
ill
Pelha
EG un H
Pelham Bay Park
Riv er Pk wy
Square Miles Population Density
BX 12
0.5
Miles
We st ch es te r Cou nt y
Hutchinson
2011-2015 Estimate
rwy d Th lan ng
E
20103
Ne w
20002
4
LA N D U S E M A P
[
Bronx 19% NYC 36%
R E N T B U R D E N 4, 6
Bronx CD 10
40%
of households spend 35% or more of their income on rent
Bronx 51% NYC 45%
LI M I T E D EN GL I S H P RO FI CI EN C Y 4
Bronx CD 10
12%
of residents 5 years or older have limited English proficiency
Bronx 26% NYC 23%
U N E M P L OY M E N T 4 , 1 0
Bronx CD 10
10.1%
of the civilian labor force was unemployed on average from 2011 to 2015
Bronx 14% NYC 9.5%
A C C E S S TO PA R KS 7
Bronx CD 10
51%
of residents live within walking distance of a park or open space
C R I M E R AT E 9
Bronx CD 10
8.9
major felonies were reported per 1,000 residents in 2016
Citywide Target 85%
Bronx 14.3 NYC 11.8
N YC g o v P O V E R T Y M E A S U R E 1 1
Bronx CD 10
14%
of residents have incomes below the NYCgov poverty threshold. See the federal poverty rate here.
Bronx 28% NYC 21%
Neighborhoods may be in multiple districts. Names and boundaries are not officially designated. 22000 US Census; 32010 US Census; 4American Community Survey 2011-2015 5-Year Estimates, calculated for Public Use Microdata Areas (PUMAs). PUMAs are geographic approximations of community districts. 5NYC Dept of City Planning Facilites Database (2017); 6 Differences of less than 3 percentage points are not statistically meaningful. 7NYC Dept of Parks and Recreation (DPR) (2016). DPR considers walking distance to be 1/4 mile for parks less than 6 acres, and 1/2 mile for larger parks and pools. 8 Differences of less than 2 minutes are not statistically meaningful. 9NYPD CompStat, Historic Complaint Data (2017); 10 Differences of less than 2 percentage points are not statistically meaningful. 11 20112015 NYCgov Poverty Measure by PUMA. This metric from the Mayor's Office for Economic Opportunity accounts for NYC's high cost of housing, as well as other costs of living and anti-poverty benefits. 1