Bridging Router Performance and Queuing Theory N. Hohn
∗
D. Veitch
∗
Department of Electrical Engineering University of Melbourne, Australia {n.hohn, d.veitch}@ee.mu.oz.au
K. Papagiannaki
∗
C. Diot
Intel Research Cambridge, UK {dina.papagiannaki, christophe.diot}@intel.com
ABSTRACT
1.
This paper provides an authoritative knowledge of through-router packet delays and therefore a better understanding of data network performance. Thanks to a unique experimental setup, we capture all packets crossing a router for 13 hours and present detailed statistics of their delays. These measurements allow us to build the following physical model for router performance: each packet experiences a minimum router processing time before entering a fluid output queue. Although simple, this model reproduces the router behaviour with excellent accuracy and avoids two common pitfalls. First we show that in-router packet processing time accounts for a significant portion of the overall packet delay and should not be neglected. Second we point out that one should fully understand both link and physical layer characteristics to use the appropriate bandwidth value. Focusing directly on router performance, we provide insights into system busy periods and show precisely how queues build up inside a router. We explain why current practices for inferring delays based on average utilization have fundamental problems, and propose an alternative solution to directly report router delay information based on busy period statistics.
End-to-end packet delay is an important metric to measure in networks, both from the network operator and application performance points of view. An important component of this delay is the time for packets to traverse the different forwarding elements along the path. This is particularly important for network providers, who may have Service Level Agreements (SLAs) specifying allowable values of delay statistics across the domains they control. A fundamental building block of the path delay experienced by packets in Internet Protocol (IP) networks is the delay incurred when passing through a single IP router. Examining such ‘through-router’ delays is the main topic of this paper. Although there have been many studies examining delay statistics measured at the edges of the network, very few have been able to report with any degree of authority on what actually occurs at switching elements. In [8] an analysis of single hop delay on an IP backbone network was presented, and different delay components were isolated. However, since the measurements were limited to a subset of the router interfaces, only samples of the delays experienced by packets, on some links, were identified. In [12] single hop delays were also obtained for a router. However since the router only had one input and one output link, which were of the same speed, the internal queueing was extremely limited. This is not a typical operating scenario, and in particular it led to the through-router delays being extremely low. In this paper we work from a data set recording all IP packets traversing a Tier-1 access router over a 13 hour period. All input and output links1 were monitored, allowing a complete picture of through-router delays to be obtained. The first aim of this paper is to exploit the unique certainty provided by the data set by reporting in detail on the actual magnitudes, and temporal structure, of delays on a subset of links which experienced significant congestion: mean utilisation levels on the target output link ranged from ρ = 0.3 to ρ = 0.7. High utilisation scenarios with significant delays are of the most interest, and yet are rare in today’s backbone IP networks. From a measurement point of view, this paper provides the most comprehensive picture of endto-end router delay performance that we are aware of. We base all our analysis on empirical results and do not make any assumptions on traffic statistics or router functionalities. Our second aim is to use the completeness of the data as a tool to investigate how packet delays occur inside the router, in other words to provide a physical model of the router delay performance. For this purpose we first position ourselves in the context of the popular store & forward router architectures with Virtual Output Queues (VOQs) at the input links [6]. We are able to confirm in a
Categories and Subject Descriptors C.2.3 [Computer-communications Networks]: Network Operations – Network monitoring
General Terms Measurement, Theory
Keywords Packet delay analysis, router model ∗ This work was done when Nicolas Hohn, Darryl Veitch and Konstantina Papagiannaki were with the Sprint Advanced Technology Laboratories, in Burlingame, CA, USA.
Permission to make digital or hard copies of all or part of this work for personal or classroom use is granted without fee provided that copies are not made or distributed for profit or commercial advantage and that copies bear this notice and the full citation on the first page. To copy otherwise, to republish, to post on servers or to redistribute to lists, requires prior specific permission and/or a fee. SIGMETRICS/Performance’04, June 12–16, 2004, New York, NY, USA. Copyright 2004 ACM 1-58113-664-1/04/0006 ...$5.00.
1
INTRODUCTION
with one negligible exception.
detailed way the prevailing assumption that the bottleneck of such an architecture is in the output queues, and justify the commonly used fluid output queue model for the router. We go further to provide two refinements to the simple queue idea which lead to a model with excellent accuracy, close to the limits of timestamping precision. We explain why the model should be robust to many details of the architecture. The model focuses on datapath functions, performed at the hardware level for every IP datagram. It only imperfectly takes account of the much rarer control functions, performed in software on a very small subset of packets. The third contribution of the paper is to combine the insights from the data, and simplications from the model, to address the question of how delay statistics can be most effectively summarised and reported. Currently, the existing Simple Network Management Protocol (SNMP) focuses on reporting utilisation statistics rather than delay. Although it is possible to gain insight into the duration and amplitude of congestion episodes through a multi-scale approach to utilisation reporting [7], the connection between the two is complex and strongly dependent on the structure of traffic arriving to the router. We explain why trying to infer delay from utilisation is in fact fundamentally flawed, and propose a new approach based on direct reporting of queue level statistics. This is practically feasible as buffer levels are already made available to active queue management schemes implemented in modern routers (note however that active management was switched off in the router under study). We propose a computationally feasible way of recording the structure of congestion episodes, and reporting them back via SNMP. The statistics we select are rich enough to allow detailed metrics of congestion behaviour to be estimated with reasonable accuracy. A key advantage is that a generically rich description is reported, without the need for any traffic assumptions. The paper is organized as follows. The router measurements are presented in section 2, and analyzed in section 3, where the methodology and sources of error are described in detail. In section 4 we construct and justify the router model, measure its accuracy and discuss the nature of residual errors. In section 5 we define congestion episodes and show how important details of their structure can be captured in a simple way. We then describe how to report the statistics with low bandwidth requirements, and illustrate how such measurements can be exploited.
2.
FULL ROUTER MONITORING
In this section we describe the hardware involved in the passive measurements, present our experiment setup to monitor a full router, and detail how packets from different traces are matched.
2.1
Hardware considerations
We first give the most pertinent features of the architecture of the router we monitor, and then recall relevant physical considerations of the SONET link layer, before describing our passive measurement infrastructure.
2.1.1
Router architecture
As mentioned in the introduction, our router is of the store & forward type, and implements Virtual Output Queues (VOQ). Details of such an architecture can be found in [6]. The router is essentially composed of a switching fabric controlled by a centralized scheduler, and interfaces or linecards. Each linecard controls two links: one input and one output. A typical datapath followed by a packet crossing the router is as follows.When a packet arrives at the input link of a linecard, its destination address is looked up in the forwarding table. This does not occur however until the packet completely leaves the input link
and fully arrives in the linecard’s memory, i.e. the ‘store’ part of store & forward. Virtual Output Queuing means that each input interface has a separate First In First Out (FIFO) queue dedicated to each output interface. The packet is stored in the appropriate queue of the input interface where it is decomposed into fixed length cells. When the packet reaches the head of line it is transmitted through the switching fabric cell by cell (possibly interleaved with competing cells from VOQ’s at other input interfaces dedicated to the same output interface) to its output interface, and reassembled before being handed to the output link scheduler, i.e. the ‘forward’ part of store & forward. The packet might then experience queuing before being serialised without interruption onto the output link. In queuing terminology it is ‘served’ at a rate equal to the bandwidth of the output link, and the output process is of fluid type because the packet flows out gradually instead of leaving in an instant. In the above description the packet might be queued both at the input interface and the output link scheduler. However in practice the switch fabric is overprovisioned and therefore very little queueing should be expected at the input queues.
2.1.2
Layer overheads
Each interface on the router uses the High Level Data Link Control (HDLC) protocol as a transport layer to carry IP datagrams over a Synchronous Optical NETwork (SONET) physical layer. Packet over SONET (PoS) is a popular choice to carry IP packets in high speed networks because it provides a more efficient link layer than IP over ATM, and faster failure detection than broadcast technologies. We now detail the calculation of the bandwidth available to IP datagrams encapsulated with HDLC over SONET. The first level of encapsulation is the SONET framing mechanism. A basic SONET OC-1 frame contains 810 bytes and is repeated with a 8kHz frequency. This yields a nominal bandwidth of 51.84Mbps. Since each SONET frame is divided into a transport overhead of 27 bytes, a path overhead of 3 bytes and an effective payload of 780 bytes, the bandwidth accessible to the transport protocol, also called the IP bandwidth, is in fact 49.92 Mbps. OC-n bandwidth (with n ∈ {3, 12, 48, 192}) is achieved by merging n basic frames into a single larger frame, and sending it at the same 8kHz rate. In this case the IP bandwidth is (49.92 ∗ n) Mbps. For instance the IP bandwidth of an OC-3 link is exactly 149.76 Mbps. The second level of encapsulation is the HDLC transport layer. This protocol adds 5 bytes before and 4 bytes after each IP datagram, irrespective of the SONET interface speed [11]. These layer overheads mean that in terms of queuing behaviour, an IP datagram of size b bytes carried over an OC-3 link should be considered as a b + 9 byte packet transmitted at 149.76 Mbps. The importance of these seemingly technical points will be demonstrated in section 4.
2.1.3
Timestamping of PoS packets
All measurements are made using high performance passive monitoring ‘DAG’ cards [2]. We use DAG 3.2 cards to monitor OC-3c and OC-12c links, and DAG 4.11 cards to monitor OC-48 links. The cards use different technologies to timestamp PoS packets. DAG 3.2 cards are based on a design dedicated to ATM measurement and therefore operate with 53 byte chunks corresponding to the length of an ATM cell. The PoS timestamping functionality was added at a later stage without altering the original 53 byte processing scheme. However, since PoS frames are not aligned with the 53 byte divisions of the PoS stream operated by the DAG card, significant timestamping errors occur. In fact, a timestamp is generated when a new SONET frame is detected within a 53 byte chunk. This mechanism can cause errors of up to 2.2µs on an OC-3 link [3].
Set
Link
BB1
in out in out out in out in out in out in
BB2 C1 C2 C3 C4
# packets 817883374 808319378 1143729157 882107803 103211197 133293630 735717147 1479788404 382732458 16263 480635952 342414216
Average rate (Mbps) 83 53 80 69 3 15 77 70 64 0.003 20 36
Matched packets (% total traffic) 99.87% 99.79% 99.84% 99.81% 99.60% 99.61% 99.93% 99.84% 99.98% N/A 99.74% 99.76%
Duplicate packets (% total traffic) 0.045 0.066 0.038 0.084 0.155 0.249 0.011 0.050 0.005 N/A 0.109 0.129
Router traffic (% total traffic) 0.004 0.014 0.009 0.008 0.023 0.006 0.001 0.001 0.001 N/A 0.008 0.008
Table 1: Trace details: Each was collected on Aug. 14 2003, between 03:30 – 16:30 UTC.
monitor
monitor
in BB1 out
in
BB2 out
monitor
monitor
OC48
OC48
monitor
monitor
monitor
monitor
mutually synchronized traces, representing more than 7.3 billion IP packets or 3 Tera Bytes of traffic. The DAG cards are located physically close enough to the router so that the time taken by packets to go between them can be neglected.
OC3
out in
C1
2.3
OC3
out in
C2
OC3
out in
C3
OC12
out in
C4
The next step after the trace collection is the packet matching procedure. It consists in identifying, across all the traces, the records corresponding to the same packet appearing at different interfaces at different times. In our case the records all relate to a single router, but the packet matching program can also accommodate multi-hop situations. We describe below the matching procedure, and illustrate it in the specific case of the customer link C2-out. Our methodology follows [8]. We match identical packets coming in and out of the router by using a hash table. The hash function is based on the CRC algorithm and uses the IP source and destination addresses, the IP header identification number, and in most cases the full 24 byte IP header data part. In fact when a packet size is less than 44 bytes, the DAG card uses a padding technique to extend the record length to 64 bytes. Since different models of DAG cards use different padding content, the padded bytes are not included in the hash function. Our matching algorithm uses a sliding window over all the synchronized traces in parallel to match packets hashing to the same key. When two packets from two different links are matched, a record of the input and output timestamps as well as the 44 byte PoS payload is produced. Sometimes two packets from the same link hash to the same key because they are identical: these packets are duplicate packets generated by the physical layer [10]. They can create ambiguities in the matching process and are therefore discarded, however their frequency is monitored. Matching packets is computationally intensive and demanding in terms of storage: the total size of the result files rivals that of the raw data. For each output link of the router, the packet matching program creates one file of matched packets per contributing input link. For instance, for output link C2-out four files are created, corresponding to the packets coming respectively from BB1-in, BB2in, C1-in and C4-in (the input link C3-in has virtually no traffic and is discarded by the matching algorithm). All the packets on a link for which no match could be found were carefully analyzed. Apart from duplicate packets, unmatched packets comprise packets going to or coming from the small unmonitored link, or with source or destination at the router interfaces themselves. There could also be unmatched packets due to packet drops at the router. Since the router did not drop a single packet over the 13 hours, no such packets were found. Assume that the matching algorithm has determined that the mth
monitor
monitor
monitor
monitor
GPS clock signal
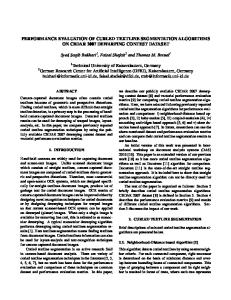
Figure 1: Experimental setup: gateway router with 12 synchronized DAG cards. DAG 4.11 cards are dedicated to PoS measurement and do not suffer from the above limitations. They look past the PoS encapsulation (in this case HDLC) to consistently timestamp each IP datagram after the first (32 bit) word has arrived. As a direct consequence of the characteristics of the measurement cards, timestamps on OC-3 links have a worst case precision of 2.2µs. Adding errors due to potential GPS synchronization problems between different DAG cards leads to a worst case error of 6µs [4]. This number should be kept in mind when we assess our router model performance.
2.2
Experimental setup
The data analyzed in this paper was collected in August 2003 at a gateway router of the Sprint IP backbone network. Six interfaces of the router were monitored, accounting for more than 99.95% of all traffic flowing through it. The experimental setup is illustrated in figure 1. Two of the interfaces are OC-48 linecards connecting to two backbone routers (BB1 and BB2), while the other four connect customer links: two trans-pacific OC-3 linecards to Asia (C2 and C3), one OC-3 (C1) and one OC-12 (C4) linecard to domestic customers. A small link carrying less than 5 packets per second was not monitored for technical reasons. Each DAG card is synchronized with the same GPS signal and outputs a fixed length 64 byte record for each packet on the monitored link. The details of the record depend on the link type (ATM, SONET or Ethernet). In our case all the IP packets are PoS packets, and each 64 byte record consists of 8 bytes for the timestamp, 12 bytes for control and PoS headers, 20 bytes for the IP header and the first 24 bytes of the IP payload. We captured 13 hours of
Packet matching
(a)
(b) 22
110 Total output C2−out input BB1−in to C2−out input BB2−in to C2−out Total input
100
18
Link Utilization (kpps)
Link Utilization (Mbps)
90 80 70 60 50
16 14 12 10
40
8
30
6
20
Total output C2−out input BB1−in to C2−out input BB2−in to C2−out Total input
20
06:00
09:00
12:00
15:00
4
06:00
09:00
12:00
15:00
Time of day (HH:MM UTC)
Time of day (HH:MM UTC)
Figure 2: Utilization for link C2-out in (a): Megabit per second (Mbps) and (b): kilo packet per second (kpps). Set C4 C1 BB1 BB2 C2
Link in in in in out
# Matched packets 215987 70376 345796622 389153772 735236757
% traffic on C2-out 0.03% 0.01% 47.00% 52.89% 99.93%
3.
Table 2: Breakdown of packet matching for output link C2-out. packet of output link Λj corresponds to the nth packet of input link λi . This can be formalized by a matching function M, obeying M(Λj , m) = (λi , n).
(1)
The matching procedure effectively defines this function for all packets over all output links. Packets that can not be matched are not considered part of the domain of definition of M. Table 1 summarizes the results of the matching procedure. The percentage of matched packets is at least 99.6% on each link, and as high as 99.98%, showing convincingly that almost all packets are matched. In fact, even if there were no duplicate packets and if absolutely all packets were monitored, 100% could not be attained because of router generated packets, which represents roughly 0.01% of all traffic. The packet matching results for the customer link C2-out are detailed in table 2. For this link, 99.93% of the packets can be successfully traced back to packets entering the router. In fact, C2-out receives most of its packets from the two OC-48 backbone links BB1-in and BB2-in. This is illustrated in figure 2 where the utilization of C2-out across the full 13 hours is plotted. The breakdown of traffic according to packet origin shows that the contributions of the two incoming backbone links are roughly similar. This is the result of the Equal Cost Multi Path policy deployed in the network when packets may follow more than one path to the same destination. While the utilization in Mbps in figure 2(a) gives an idea of how congested the link might be, the utilization in packets per second is important from a packet tracking perspective. Since the matching procedure is a per packet mechanism, figure 2(b) illustrates the fact that roughly all packets are matched: the sum of the input traffic is almost indistinguishable from the output packet count. In the remainder of the paper we focus on link C2-out because it is the most highly utilized link, and is fed by two higher capacity links. It is therefore the best candidate for observing queuing behaviour within the router.
PRELIMINARY DELAY ANALYSIS
In this section we analyze the data obtained from the packet matching procedure. We start by carefully defining the system under study, and then present the statistics of the delays experienced by packets crossing it. The point of view is that of looking from the outside of the router, seen largely as a ‘black box’, and we concentrate on simple statistics. In the next section we begin to look inside the router, and examine delays in greater detail.
3.1
System definition
Recall the notation from equation (1): the mth packet of output link Λj corresponds to the nth packet of input link λi . The DAG timestamps an IP packet on the incoming interface side as t(λi , n), and later on the outgoing interface at time t(Λj , m). As the DAG cards are physically close to the router, one might think to define the through-router delay as t(Λj , m) − t(λi , n). However, this would amount to defining the router ‘system’ in a somewhat arbitrary way, because, as we showed in section 2.1.3, packets are timestamped differently depending on the measurement hardware involved. Furthermore there are several other disavantages to such a definition, leading us to suggest the following alternative. For self-consistency and extensibility to a multi-hop scenario, where we would like individual router delays to add, arrival and departure times of a packet should be measured consistently using the same bit. It is natural to focus on the end of the (IP) packet for two reasons: (1) as a store & forward router, the output queue is the most important component to describe. It is therefore appropriate to consider that the packet has left the router when it completes its service at the output queue, that is when it has completely exited the router. (2) Again as a store and forward router, no action (for example the forwarding decision) is performed until the packet has fully entered the router. Thus the input buffer can be considered as part of the input link, and packet arrival to occur after the arrival of the last bit. The arrival and departure instants in fact define the ‘system’, which is the part of the router which we study, and is not exactly the same as the physical router as it excises the input buffer. This buffer, being a component which is already understood, does not have to be modelled or measured. Defining the system in this way can be compared with choosing the most practical coordinate system to solve a given problem. We now establish the precise relationships between the DAG timestamps defined earlier and the time instants τ (λi , n) of arrival and τ (Λj , m) of departure of a given packet to the system as just
λ i ,θ i
BB1−in to C2−out
(a)
5.5 5
Λj ,Θ j
t(λ i ,n)
time
min mean max
4.5
log10 Delay (us)
4
λ i ,θ i
(b) Λj ,Θ j
τ(λ i ,n)
time
3.5 3 2.5 2
λ i ,θ i
(c) Λj ,Θ j
1.5 1
t(Λ j ,m)
λ i ,θ i
time
τ(Λ j,m) time
defined. Denote by ln = Lm the size of the packet in bytes when indexed on links λi and Λj respectively, and let θi and Θj be the corresponding link bandwidths in bits per second. We denote by H the function giving the depth of bytes into the IP packet where the DAG timestamps it. H is a function of the link speed, but not the link direction. For a given link λi , H is defined as =
4
if
λi
=
b
if λi
is an OC-48 link, is an OC-3 or OC-12 link,
where we take b to be a uniformly distributed integer between 0 and min(ln , 53) to account for the ATM based discretisation described earlier. We can now derive the desired system arrival and departure event times as: τ (λi , n) = τ (Λj , m)
=
t(λi , n) + 8(ln − H(λi ))/θi
(2)
These definitions are displayed schematically in figure 3. The snapshots are: (a): the packet is timestamped by the DAG card monitoring the input interface at time t(λi , n), at which point it has already entered the router, but not yet the system, (b): it has finished entering the router (arrives at the system) at time τ (λi , n), and (c): is timestamped by the DAG at the output interface at time t(Λj , m). Finally (d): it fully exits the router (and system) at time τ (Λj , m). With the above notations, the through-system delay experienced by packet m on link Λj is defined as (3)
To simplify notations we shorten this to d(m) in what follows.
3.2
15:00:00
there is a constant minimum delay across time, up to timestamping precision. The fluctuations in the mean delay follow roughly the changes in the link utilization presented in figure 2. The maximum delay value has a noisy component with similar variations to the mean, as well as a spiky component. All the spikes above 10 ms have been individually studied. The analysis revealed that they are caused by IP packets carrying options, representing less than 0.0001% of all packets. Option packets take different paths through the router since they are processed through software, while all other packets are processed with dedicated hardware on the socalled ‘fast path’. This explains why they take significantly longer to cross the router. In any router architecture it is likely that many components of delay will be proportional to packet size. This is certainly the case for store & forward routers, as discussed in [5]. To investigate this here we compute the ‘excess’ minimum delay experienced by packets of different sizes, that is not including their transmission time on the output link, a packet size dependent component which is already understood. Formally, for every packet size L we compute ∆λi ,Λj (L) = min{dλi ,Λj (m) − 8lm /Θj |lm = L}. m
t(Λj , m) + 8(Lm − H(Λj ))/Θj
dλi ,Λj (m) = τ (Λj , m) − τ (λi , n).
12:00:00
Figure 4: Packet delays from BB1-in to C2-out. All delays above 10ms are due to option packets.
Figure 3: Four snapshots of a packet crossing the router.
H(λi )
09:00:00
Time of day (HH:MM UTC)
(d) Λj ,Θ j
06:00:00
Delay statistics
A thorough analysis of single hop delays was presented in [8]. Here we follow a similar methodology and obtain comparable results, but with the added certainty gained from not needing to address the sampling issues caused by unobservable packets on the input side. Figure 4 shows the minimum, mean and maximum delay experienced by packets going from input link BB1-in to output link C2-out over consecutive 1 minute intervals. As observed in [8],
(4)
Note that our definition of arrival time to the system conveniently excludes another packet size dependent component, namely the time interval between beginning and completing entry to the router at the input interface. Figure 5 shows the values of ∆λi ,Λj (L) for packets going from BB1-in to C2-out. The IP packet sizes observed varied between 28 and 1500 bytes. We assume (for each size) that the minimum value found across 13 hours corresponds to the true minimum, i.e. that at least one packet encountered no contention on its way to the output queue and no packet in the output queue when it arrived there. In other words, we assume that the system was empty from the point of view of this input-output pair. This means that the excess minimum delay corresponds to the time taken to make a forwarding decision (not packet size dependent), to divide the packet into cells, transmit it across the switch fabric and reassemble it (each being packet size dependent operations), and finally to deliver it to the appropriate output queue. The step like curve means that there exist ranges of packet sizes with the same minimum transit time. This is consistent with the fact that each packet is divided into fixed length cells, transmitted through the backplane cell by cell, and reassembled. A given number of cells can therefore correspond to a contiguous range of packet sizes with the same minimum transit time.
(a)
Minimum Router Transit Time ( µs )
40
Δ1 35
N inputs
ΔN
30
(b)
25
20
0
Δ
N inputs 500
1000
1500
packet size (bytes)
Figure 5: Measured minimum excess system transit times from BB1-in to C2-out.
4.
MODELLING
We are now in a position to exploit the completeness of the data set to look inside the system. This enables us to find a physically meaningful model which can be used both to understand and predict the end-to-end system delay very accurately.
4.1
The fluid queue
We first recall some basic properties of FIFO queues that will be central in what follows. Consider a FIFO queue with a single server of deterministic service rate µ, and let ti be the arrival time to the system of packet i of size li bytes. We assume that the entire packet arrives instantaneously (which models a fast transfer across the switch), but it leaves progressively as it is served (modelling the output serialisation). Thus it is a fluid queue at the output but not at the input. Nonetheless we will for convenience refer to it as the ‘fluid queue’. Let Wi be the length of time packet i waits before being served. The service time of packet i is simply li /µ, so the system time, that is the total amount of time spent in the system, is Si = Wi +
li . µ
(5)
The waiting time of the next packet (i + 1) to enter the system can be expressed by the following recursion: Wi+1 = [Wi +
li − (ti+1 − ti )]+ , µ
(6)
where [x]+ = max(x, 0). The service time of packet i + 1 reads Si+1 = [Si − (ti+1 − ti )]+ +
li+1 . µ
(7)
We denote by U (t) the amount of unfinished work at time t, that is the time it would take, with no further inputs, for the system to completely drain. The unfinished work at the instant following the arrival of packet i is nothing other than the end-to-end delay that that packet will experience across the queuing system. It is therefore the natural mathematical quantity to consider when studying delay. Note that it is defined at all real times t.
4.2
A simple router model
The delay analysis of section 3 revealed two main features of the system delay which should be taken into account in a model: the minimum delay experienced by a packet, which is size, interface, and architecture dependent, and the delay corresponding to the time spent in the output buffer, which is a function of the rate of the output interface and the occupancy of the queue. The delay across
Figure 6: Router mechanisms: (a) Simple conceptual picture including VOQs. (b) Actual model with a single common minimum delay. the output buffer could by itself be modelled by the fluid queue as described above, however it is not immediately obvious how to incorporate the minimum delay property in a sensible way. Assume for instance that the router has N input links λ1 , ..., λN contributing to a given output link Λj and that a packet of size l arriving on link λi experiences at least the minimum possible delay ∆λi ,Λj (l) before being transferred to the output buffer. A representation of this situation is given in figure 6(a). Our first problem is that given different technologies on different interfaces, the functions ∆λ1 ,Λj , ..., ∆λn ,Λj are not necessarily identical. The second is that we do not know how to measure, nor to take into account, the potentially complex interactions between packets which do not experience the minimum excess delay but some larger value due to contention in the router arising from cross traffic. We address this by in fact simplifying the picture still further, in two ways. First we assume that the minimum delays are identical across all input interfaces: a packet of size l arriving on link λi and leaving the router on link Λj now experiences an excess minimum delay ∆Λj (l) = min{∆λi ,Λj (l)}. i
(8)
In the following we drop the subscript Λj to ease the notation. Second, we assume that the multiplexing of the different input streams takes place before the packets experience their minimum delay. By this we mean that we preserve the order of their arrival times and consider them to enter a single FIFO input buffer. In doing so, we effectively ignore all complex interactions between the input streams. Our highly simplified picture, which is in fact the model we propose, is shown in figure 6(b). We will justify these simplifications a posteriori in section 4.3 where the comparison with measurement shows that the model is remarkably accurate. We now explain why we can expect this accuracy to be robust. Suppose that a packet of size l enters the system at time t+ and that the amount of unfinished work in the system at time t− was U (t− ) > ∆(l). The following two scenarios produce the same total delay: (i) the packet experiences a delay ∆(l), then reaches the output queue and waits U (t) − ∆(l) > 0 before being served, or (ii) the packet reaches the output queue straight away and has to wait U (t) before being served. In other words, as long as there is more than an amount ∆(l) of work in the queue when a packet of size l enters the system, the fact that the packet should wait ∆(l) before reaching the output queue can be neglected. Once the system is busy, it behaves exactly
450
data model
160
data model
400
140
queue size ( µs )
queue size ( µs )
350
120 100 80 60
300 250 200 150
40
100
20
50
0 0
0.2
0.4
0.6
0.8
1
1.2
0 0
time ( ms )
0.1
0.2
0.3
0.4
0.5
0.6
0.7
0.8
time ( ms )
Figure 7: Comparisons of measured and predicted delays on link C2-out: Grey line: unfinished work U (t) in the system according to the model, Black dots: measured delay value for each packet. like a simple fluid queue. This implies that no matter how complicated the front end of the router is, one can simply neglect it when the output queue is sufficiently busy. The errors made through this approximation will be strongly concentrated on packets with very small delays, whereas the more important medium to large delays will be faithfully reproduced. Apart from its simplicity, this robustness is the main motivation for the model. A system equation for our two stage model can be derived as follows. Assume that the system is empty at time t− 0 and that packet k0 of size l0 enters the system at time t+ 0 . It waits ∆(l0 ) before reaching the empty output queue where it immediately starts being served. Its service time is l0 /µ and therefore its total system time is l0 (9) S0 = ∆(l0 ) + . µ Suppose a second packet enters the system at time t1 and reaches the output queue before the first packet has finished being served, i.e. t1 + ∆(l1 ) < t0 + S0 . It will start being served when packet k0 leaves the system, i.e at t0 + S0 . Its system time will therefore be: l1 S1 = S0 − (t1 − t0 ) + . µ The same recursion holds for successive packets k and k + 1 as long as the amount of unfinished work in the queue remains above ∆(lk+1 ) when packet k + 1 enters the system: tk+1 + ∆(lk+1 ) < tk + Sk .
(10)
Therefore, as long as equation (10) is verified, the system times of successive packets are obtained by the same recursion as for the case of a busy fluid queue: Sk+1 = Sk − (tk+1 − tk ) +
lk+1 . µ
(11)
Suppose now that packet k + 1 of size lk+1 enters the system at time t+ k+1 and that the amount of unfinished work in the system at − time t− k+1 is such that 0 < U (tk+1 ) < ∆(lk+1 ). In this case, the output buffer will be empty by the time packet k + 1 reaches it after having waited ∆(lk+1 ) in the first stage of the model. The service time of packet k + 1 therefore reads Sk+1 = ∆(lk+1 ) +
lk+1 . µ
(12)
A crucial point to note here is that in this situation, the output queue can be empty but the system still busy with a packet waiting in the front end. This is also true of the actual router.
Once the queue has drained, the system is idle until the arrival of the next packet. The time between the arrival of a packet to the empty system and the time when the system becomes empty again defines a system busy period. In this brief analysis, we have assumed an infinite buffer size. It is a reasonable assumption since it is quite common for a line card to be able to accommodate up to 500 ms worth of traffic.
4.3
Evaluation
We now evaluate our model and compare its results with empirical delay measurements. The model delays are obtained by multiplexing the traffic streams BB1-in to C2-out and BB2-in to C2-out and feeding the resulting packet train to the model in an exact trace driven ‘simulation’. Figure 7 shows two sample paths of the unfinished work U (t) corresponding to two fragments of real traffic destined to C2-out. The process U (t) is a right continuous jump process where each jump marks the arrival time of a new packet. The resultant new local maximum is the time taken by the newly arrived packet to cross the system, that is its delay. The black dots represent the actual measured delays for the corresponding input packets. In practice the queue state can only be measured when a packet enters the system. Thus the black dots can be thought of samples of U (t) obtained from measurements, and agreement between the two seems very good. In order to see the limitations of our model, we focus on a set of busy periods on link C2-out involving 510 packets all together. The top plot of figure 8 shows the system times experienced by incoming packets, both from the model and from measurements. The largest busy period on the figure has a duration of roughly 16 ms and an amplitude of more than 5 ms. Once again, the model reproduces the measured delays very well. The lower plot in figure 8 shows the error of our model, that is the difference between measured and modeled delays at each packet arrival time, plotted on the same time axis as the upper plot. There are three main points one can make about the model accuracy. First, the absolute error is within 30µs of the measured delays for almost all packets. Second, the error is much larger for a few packets, as shown by the spiky behaviour of the error plot. These spikes are due to a local reordering of packets inside the router that is not captured by our model. Recall from figure 6(b) that we made the simplifying assumption that the multiplexing of the input streams takes place before the packets experience their minimum delay. This means that packets exit our system in the exact same order as they entered it. However in practice local reordering can happen when a large packet arrives at the system on one interface just before a small packet on another interface. Given that the minimum transit time of a packet depends linearly on its size (see
6000 measured delays model
delay ( µs )
5000 4000 3000 2000 1000 0 0
5
10
15
20
25
20
25
time ( ms )
150
error ( µs )
100
50
0
−50 0
5
10
15
time ( ms )
Figure 8: Measured delays and model predictions (top), Absolute error between data and model (bottom). figure 5), the small packet can overtake the large one and reach the output buffer first. Once the two packets have reached the output buffer, the amount of work in the system is the same, irrespectively of their arrival order. Thus these local errors do not accumulate. Intuitively, local reordering requires that two packets arrive almost at the same time on two different interfaces. This is much more likely to happen when the links are busy. This is in agreement with figure 8 which shows that spikes always happen when the queuing delays are increasing, a sign of high local link utilization. The last point worth noticing is the systematic linear drift of the error across a busy period duration. This is due to the fact that our queuing model drains slightly faster than the real queue. We could not confirm any physical reason why the IP bandwidth of the link C2-out is smaller than what was predicted in section 2.1.2. However, the important observation is that this phenomenon is only noticeable for very large busy periods, and is lost in measurement noise for most busy periods. The model presented above has some limitations. First it does not take into account the fact that a small number of option packets will take a ‘slow’ software path through the router instead of being entirely processed at the hardware level. As a result, option packets experience a much larger delay before reaching the output buffer, but as far as the model is concerned, transit times through the router only depend on packet sizes. Second, the output queue stores not only the packets crossing the router, but also the ‘unmatched’ packets generated by the router itself, as well as control PoS packets. These packets are not accounted for in the model. Despite its simplicity, our model is considerably more accurate than other single-hop delay models. Figure 9(a) compares the errors made on the packet delays from the OC-3 link C2-out presented in figure 8 with three different models: our two stage model, a fluid queue with OC-3 nominal bandwidth, and a fluid queue with OC-3 IP bandwidth. As expected, with a simple fluid model, i.e. when one does not take into account the minimum transit time, all the delays are systematically underestimated. If moreover one chooses the nominal link bandwidth (155.52 Mbps) for the queue instead of a carefully justified IP bandwidth (149.76 Mbps), the errors inside a busy period build up very quickly because the queue drains too fast. There is in fact only a 4% difference between the nominal and effective bandwidths, but this is enough to create errors up 800µs inside a moderately large busy period.
Figure 9(b) shows the cumulative distribution function of the delay error for a 5 minute window of C2-out traffic. Of the delays inferred by our model, 90% are within 20µs of the measured ones. Given the timestamping precision issues described in section 2.1.3, these results are very satisfactory. We now evaluate the performance of our model over the entire 13 hours of traffic on C2-out as follows. We divide the period into 156 intervals of 5 minutes. For each interval, we plot the average relative delay error against the average link utilization. The results are presented in figure 9. The absolute relative error is less than 1.5% for the whole trace, which confirms the excellent match between the model and the measurements. For large utilisation levels, the relative error grows due to the fact that large busy periods are more frequent. The packet delays therefore tend to be underestimated more often due to the unexplained bandwidth mismatch occurring inside large busy periods. Overall, our model performs very well for a large range of link utilizations.
4.4
Router model summary
Based on the observations and analysis presented above, we propose the following simple approach for modeling store and forward routers. For each output link Λj : (i) measure the minimum excess (i.e. excluding service time) packet transit time ∆λi ,Λj between each input λi and the given output Λj , as defined in equation (4). These depend only on the hardware involved, not the type of traffic, and could potentially be tabulated. Define the overall minimum packet transit time ∆Λj as the minimum over all input links λi , as described in equation (8). (ii) calculate the IP bandwidth of the output link by taking into account the different levels of packet encapsulation, as described in section 2.1.2. (iii) obtain packet delays by aggregating the input traffic corresponding to the given output link, and feeding it to a simple two stage model, illustrated in figure 6(b), where packets are first delayed by an amount ∆Λj before entering a FIFO queue. System equations are given in section 4.2. A model of a full router can be obtained by putting together the models obtained for each output link Λj . Although very simple, this model performed remarkably well for our data set, where the router was lightly loaded and the output buffer was clearly the bottleneck. As explained above, we expect the model to continue to perform well even under heavier load where interactions in the front end become more pronounced, but not dominant. The accuracy would drop off under loads heavy enough to shift the bottleneck to the switching fabric, when details of the scheduling algorithm could no longer be neglected.
5. 5.1
DELAY PERFORMANCE: UNDERSTANDING AND REPORTING Motivation
From the previous section, our router model can accurately predict delays when the input traffic is fully characterized. However in practice the traffic is unknown, which is why network operators rely on available simple statistics, such as curves giving upper bounds on delay as a function of link utilization, when they want to infer packet delays through their networks. The problem is that these curves are not unique since packet delays depend not only on the mean traffic rate, but also on more detailed traffic statistics.
(a)
(b)
(c)
1
200 0
1
0.8
0.5
Relative error (%)
−200
error ( µs )
0.6 −400
0.4 −600 −800 −1000 0
10
15
20
−0.5
0.2
model fluid queue with OC−3 effective bandwidth fluid queue with OC−3 nominal bandwidth 5
0
25
0 −200
−1
−100
time ( ms )
0
100
−1.5 50
200
error (µs)
60
70
80
90
100
110
Link utilization (Mbps)
Figure 9: (a) Comparison of error in delay predictions from different models of the sample path from figure 8. (b) Cumulative distribution function of model error over a 5 minute window on link C2-out. (c) Relative mean error between delay measurements and model on link C2-out vs link utilization.
5.2
Busy periods
(a)
(b) 1
1
0.8
0.8
0.6
0.6
0.4
0.4
0.2
0.2
0 0
200
400
600
800
Definition
Recall from section 4 that we defined busy periods as the time between the arrival of a packet in the empty system and the time when the system goes back to its empty state. The equivalent definition in terms of measurements is as follows: a busy period starts when a packet of size l bytes crosses the system with a delay ∆(l) + l/µ, and it ends with the last packet before the start of another busy period. This definition, which makes full use of our measurements, is a lot more robust than an alternate definition based solely on packet inter-arrival times at the output link. For instance, if one were to detect busy periods by using timestamps and packet sizes to group together back-to-back packets, the following two problems would occur. First, timestamping errors could lead to wrong busy periods separations. Second and more importantly, according to our system definition from section 4.2, packets belonging to the same busy period are not necessarily back to back on the output link (see equation 12).
5.2.2
Statistics
To describe busy periods, we begin by collecting per busy period statistics, such as duration, number of packets and bytes, and amplitude (maximum delay experienced by a packet inside the busy period). The cumulative distribution functions (CDF) of busy period amplitudes and durations are plotted in figures 10(a) and 10(b) for a 5 minute traffic window. For this traffic window, 90% of busy
0 0
0.5
1
1.5
(c)
2.5
3
(d) 7
6.5
6.5 6
busy period amplitude (ms)
6 5.5 5 4.5 4 3.5
5.5 5 4.5 4 3.5
3
3
2.5
2.5
2 0
2
Duration (ms)
7
10
20
30
40
50
busy period duration (ms)
5.2.1
1000
Amplitude (µs)
busy period amplitude (ms)
In fact, link utilization alone can be very misleading as a way of inferring packet delays. Suppose for instance that there is a group of back to back packets on link C2-out. This means that packets follow each other on the link without gaps, i.e. the local link utilization is 100%. However this does not imply that these packets have experienced large delays inside the router. They could very well be coming back to back from the input link C1-in with the same bandwidth as C2-out. In this case they would actually cross the router with minimum delay in the absence of cross traffic. Inferring average packet delays from link utilization only is therefore fundamentally flawed. Instead, we propose to study performance related questions by going back to the source of large delays: queue build-ups in the output buffer. In this section we use our understanding of the router mechanisms obtained from our measurements and modelling work of the previous sections to first describe the statistics and causes of busy periods, and second to propose a simple mechanism that could be used to report useful delay information about a router.
60
70
80
2 0
0.5
1
1.5
2
2.5
3
3.5
4
median delay (ms)
Figure 10: (a) CDF of busy period amplitudes. (b) CDF of busy period durations. (c) Busy period amplitudes as a function of busy period durations. (d) Busy period amplitudes as a function of median packet delay. periods have an amplitude smaller than 200µs, and 80% last less than 500µs. Figure 10(c) shows a scatter plot of busy period amplitudes against busy period durations for amplitudes larger than 2ms on link C2-out (busy periods containing option packets are not shown). There does not seem to be any clear pattern linking amplitude and duration of a busy period in this data set, although roughly speaking the longer the busy period the larger its amplitude. A scatter plot of busy period amplitudes against the median delay experienced by packets inside the busy period is presented in figure 10(d). One can see a linear, albeit noisy, relationship between maximum and median delay experienced by packets inside a busy period. This means intuitively that busy periods have a ‘regular’ shape, i.e. busy periods where most of the packets experience small delays and only a few packets experience much larger delays are unlikely.
5.2.3
Origins
Our full router measurements allow us to go further in the characterization of busy periods. In particular, we can use our knowledge about the input packet streams on each interface to understand
(a)
(b) C2−out BB1−in to C2−out BB2−in to C2−out
5
4
delay ( ms )
3
3
3
2
2
2
1
1
1
0 0
5
10
15
20
0 0
25
5
10
15
0 0
20
(d)
(e) 5
5
4
4
4
delay ( ms )
5
delay ( ms )
6
3
3
2
2
1
1
1
15
20
25
0 0
5
10
20
3
2
time ( ms )
15
(f)
6
10
10
time ( ms )
6
5
5
time ( ms )
time ( ms )
0 0
C2−out BB1−in to C2−out BB2−in to C2−out
5
4
delay ( ms )
delay ( ms )
6 C2−out BB1−in to C2−out BB2−in to C2−out
5
4
delay ( ms )
(c)
6
6
15
time ( ms )
20
25
0 0
5
10
15
20
25
time ( ms )
Figure 11: (a) (b) (c) Illustration of the multiplexing effect leading to a busy period on the output link C2-out. (d) (e) (f) Collection of largest busy periods in each 5 min interval on the output link C2-out. the mechanisms that create the busy periods observed for our router output links. It is clear that, by definition, busy periods are created by a local aggregate arrival rate which exceeds the output link service rate. This can be achieved by a single input stream, the multiplexing of different input streams, or a combination of both phenomena. A detailed analysis can be found in [9]. We restrict ourselves in this section to an illustration of these different mechanisms. To create the busy periods shown in figure 11, we store the individual packet streams BB1-in to C2-out and BB2-in to C2-out, feed them individually to our model and obtain virtual busy periods. The delays obtained are plotted on figure 11(a), together with the true delays measured on link C2-out for the same time window as in figure 8. In the absence of cross traffic, the maximum delay experienced by packets from each individual input stream is around 1ms. However, the largest delay for the multiplexed inputs is around 5ms. The large busy period is therefore due to the fact that the delays of the two individual packet streams peak at the same time. This non linear phenomenon is the cause of all the large busy periods observed in our traces. A more surprising example is illustrated in figure 11(b) that shows one input stream creating at most a 1ms packet delay by itself and the other a succession of 200µs delays. The resulting congestion episode for the multiplexed inputs is again much larger than the individual episodes. A different situation is shown on figure 11(c), where one link contributes almost all the traffic of the output link for a short time period. In this case, the measured delays are almost the same as the virtual ones caused by the busy input link. It is interesting to notice that the three large busy periods plotted in figures 11(a), 11(b) and 11(c) all have a roughly triangular shape. Figures 11(d), 11(e) and 11(f) that show that this is not due to a particular choice of busy periods. They were obtained as follows. For each 5 min interval, we detect the largest packet delay, store the corresponding packet arrival time t0 , and plot the delays
experienced by packets in a window 10ms before and 15ms after t0 . The resulting sets of busy periods are grouped according to the largest packet delay observed: figure 11(d) when the largest amplitude is between 5ms and 6ms, figure 11(e) between 4ms and 5ms, and figure 11(f) between 2ms and 3ms. Other amplitude ranges were omitted for space reasons. For each of the plots 11(d), (e) and (f), the black line highlights the busy period detailed in the plot directly above it. The striking point is that most busy periods have a roughly triangular shape. The largest busy periods have slightly less regular shapes, but a triangular assumption can still hold. These results are reminiscent of the theory of large deviations, which states that rare events happen in the most likely way. Some hints on the shape of large busy periods in (Gaussian) queues can be found in [1] where it is shown that, in the limit of large amplitude, busy periods tend to be antisymmetric about their midway point, in agreement with what we see here.
5.3
Modelling busy period shape
Although a triangular approximation may seem very crude at first, we now study how useful such a model could be. To do so, we first illustrate in figure 12 a basic principle: any busy period of duration D seconds is bounded above by the busy period obtained in the case where the D seconds worth of work arrive in the system at maximum input link speed. The amount of work then decreases with slope −1 if no more packets enter the system. In the case of the OC-3 link C2-out fed by the two OC-48 links BB1 and BB2 (each link being 16 times faster than C2-out), it takes at least D/32 seconds for the load to enter the system. From our measurements, busy periods are quite different from their theoretical bound. The busy period shown in figures 8 and 11(a) is again plotted in figure 12 for comparison. One can see that its amplitude A is much lower than the theoretical maximum, in agreement with the scatter plot of figure 10(c). In the rest of the paper we model the shape of a busy period of
D
2
measured busy period theoretical bound modelled busy period
1.8
delay
Mean duration (ms)
1.6
A
1.4 1.2 1 0.8
Data 0.7 utilization Equation (15) Equation (17) Data 0.35 utilization Equation (15) Equation (17)
0.6
L 0.4 0
0.5
1
1.5
2
2.5
3
3.5
L (ms)
0 0
D
time
Figure 12: Modelling of busy period shape with a triangle. duration D and amplitude A by a triangle with base D, height A and same apex position as the busy period. This is illustrated in figure 12 by the triangle superposed over the measured busy period. This very rough approximation can give surprisingly valuable insight into packet delays. We define our performance metric as follows. Let L be the delay experienced by a packet crossing the router. A network operator might be interested in knowing how long a congestion level larger than L will last, because this gives a direct indication of the performance of the router. Let dL,A,D be the length of time the workload of the system remains above L during a busy period of duration D and amplitude (T ) A, as obtained from our delay analysis. Let dL,A,D be the approximated duration obtained from the shape model. Both dL,A,D and (T ) dL,A,D are plotted with a dashed line in figure 12. From basic geometry one can show that L D(1 − A ) if A ≥ L (T ) dL,A,D = (13) 0 otherwise. (T )
In other words, dL,A,D is a function of L, A and D only. For the metric considered, the two parameters (A, D) are therefore enough to describe busy periods, the knowledge of the apex position does not improve our estimate of dL,A,D . Denote by ΠA,D the random process governing {A, D} pairs for successive busy periods over time. The mean length of time during which packet delays are larger than L reads Z TL = dL,A,D dΠA,D . (14) TL can be approximated by our busy period model with Z (T ) (T ) TL = dL,A,D dΠA,D .
(15)
We use equation (15) to approximate TL on the link C2-out. The results are plotted on figure 13 for two 5 minute windows of traffic with different average utilizations. For both utilization levels, the measured durations (solid line) and the results from the triangular approximation (dashed line) are fairly similar. This shows that our very simple triangular shape approximation captures enough information about busy periods to answer questions about duration of congestion episodes of a certain level. The small discrepancy between data and model can be considered insignificant in the context of Internet applications because a service provider will be realistically only interested in the order of magnitude (1ms, 10ms, 100ms) of a congestion episode greater than L. Our simple approach therefore fulfills that role very well.
Figure 13: Average duration of a congestion episode above L ms defined by equation (15), for two different utilization levels (0.3 and 0.7) on link C2-out. Solid lines: data, dashed lines: equation (15), dots: equation (17). Let us now qualitatively describe the behaviours observed on figure 13. For a small congestion level L, the mean duration of the congestion episode is also small. This is due to the fact that, although a large number of busy periods have an amplitude larger than L, as seen for instance from the amplitude CDF in figure 10(a), most busy periods do not exceed L by a large amount, so the mean duration is small. It is also worth noticing that the results are very similar for the two different link utilizations. This means that busy periods with small amplitude are roughly similar at this time scale, and do not depend on average utilization. As the threshold L increases, the (conditional on L) mean duration first increases as there are still a large number of busy periods with amplitude greater than L on the link, and of these, most are considerably larger than L. With an even larger values of L however, fewer and fewer busy periods qualify. The ones that do cross the threshold L do so for a smaller and smaller amount of time, up to the point where there are no busy periods larger than L in the trace.
5.4
Reporting busy period statistics
The study presented above shows that one can get useful information about delays by jointly using the amplitude and duration of busy periods. Now we look into ways in which such statistics could be concisely reported using SNMP. We start by forming busy periods from the queue size values and collecting (A, D) pairs during 5 minutes intervals. This is feasible in practice since the queue size is already accessed by other software such as active queue management schemes. Measuring A and D is easily performed on-line. In principle we need to report the pair (A, D) for each busy period in order to recreate the process ΠA,D and evaluate equation (15). Since this represents a very large amount of data in practice, we instead assume that busy periods are independent and therefore that the full process ΠA,D can be described by the joint marginal distribution FA,D of A and D. Thus, for each busy period we need simply update a sparse 2-D histogram. The bin sizes should be as fine as possible consistent with available computing power and memory. We do not consider these details here. They are not critical since at the end of the 5 minute interval a much coarser discretisation is performed in order to limit the volume of data finally exported via SNMP. We control this directly by choosing N bins for each of the amplitude and the duration dimensions. As we do not know a priori what delay values are common, the discretisation scheme must adapt to the traffic to be useful. A simple and natural way to do this is to select bin boundaries for D and
packet delays than presently available statistics based on average link utilization. Moreover, it is only based on measurements and is therefore traffic independent.
1100 0.09
1000 0.08
Amplitude ( µs )
900 800
0.07
700
0.06
600
0.05
500
0.04
400
6.
0.03
300 0.02
200 0.01
100 200
400
600
800
1000
0
Duration ( µs )
Figure 14: Histogram of the quantized joint probability distribution of busy period amplitudes and durations with N = 10 equally spaced quantiles along each dimension for a 5 minute window on link C2-out. A separately based on quantiles, i.e. on bin populations. For example a simple equal population scheme for D would define bins such that each contained (100/N )% of the measured values. Denote by M the N × N matrix representing the quantized version of FA,D . The element p(i, j) of M is defined as the probability of observing a busy period with duration between the (i − 1)th and ith duration quantile, and amplitude between the (j − 1)th and j th amplitude quantile. Given that for every busy period A < D, the matrix is triangular, as shown in figure 14. Every 5 minutes, 2N bin boundary values for amplitude and duration, and N 2 /2 joint probability values, are exported. The 2-D histogram stored in M contains the 1-D marginals for amplitude and duration, characterizing respectively packet delays and link utilization. In addition however, from the 2-D histogram we can see at a glance the relative frequencies of different busy period shapes. Using this richer information, together with a shape model, M can be used to answer performance related questions. Applying this to the measurement of TL introduced in section 5.3, and assuming independent busy periods, equation (15) becomes « „ Z Z L (T ) (T ) dFA,D . (16) TL = dL,A,D dFA,D = D 1− A A>L To evaluate this, we need to determine a single representative amplitude Ai and average duration Dj for each quantized probability density value p(i, j), (i, j) ∈ {1, ..., N }2 , from M . One can for instance choose the center of gravity of each of the tiles plotted in figure 14. For a given level L, the average duration TL can then be estimated by j N 1 X X (T ) ] (T ) TL = d p(i, j), nL j=1 i=1 L,Ai ,Dj
(17)
Ai >L
where nL is the number of pairs (Ai , Dj ) such that Ai > L. Estimates obtained from equation (17) are plotted in figure 13. They are fairly close to the measured durations despite the strong assumption of independence. Although very simple and based on a rough approximation of busy period shapes, this reporting scheme can give some interesting information about the delay performance of a router. In this preliminary study we have only illustrated how TL could be approximated with the reported busy period information, but other performance related questions could be answered in the same way. In any case, our reporting scheme provides a much more valuable insight about
CONCLUSION
In this paper we have explored in detail ‘through-router’ delays. We first described a unique experimental setup where we captured all IP packets crossing a Tier-1 access router and presented authoritative empirical results about packet delays. Second, we used our dataset to provide a physical model of router delay performance, and showed that our model could very accurately infer packet delays. Our third contribution concerns a fundamental understanding of delay performance. We gave the first measured statistics of router busy periods that we are aware of, and presented a simple triangular shape model that can capture useful delay information. We then proposed a scheme to export router delay performance in a compact way. There is still a large amount of work to be done to fully understand our dataset and its implications. For instance it provides a unique opportunity to validate traffic models in considerable detail.
7.
ACKNOWLEDGEMENTS
We thank Gianluca Iannacone and Tao Ye for designing and writing the packet matching program.
8.
REFERENCES
[1] R. Addie, P. Mannersalo, and I. Norros. Performance formulae for queues with Gaussian input. In Proc. 16th International Teletraffic Congress, 1999. [2] DAG network measurement card. http://dag.cs.waikato.ac.nz/. [3] S. Donnelly. High Precision Timing in Passive Measurements of Data Networks. PhD thesis, University of Waikato, 2002. [4] C. Fraleigh, S. Moon, B. Lyles, C. Cotton, M. Khan, D. Moll, R. Rockell, T. Seely, and C. Diot. Packet-level traffic measurements from the Sprint IP backbone. IEEE Networks, 17(6):6–16, 2003. [5] S. Keshav and S. Rosen. Issues and trends in router design. IEEE Communication Magazine, 36(5):144–151, 1998. [6] N. McKeown. iSLIP: A scheduling algorithm for input-queued switches. IEEE transactions on Networking, 7(2):188–201, 1999. [7] K. Papagiannaki, R. Cruz, and C. Diot. Network performance monitoring at small time scales. In Proc. ACM Internet Measurement Conference, pages 295–300, Miami, 2003. [8] K. Papagiannaki, S. Moon, C. Fraleigh, P. Thiran, F. Tobagi, and C. Diot. Analysis of measured single-hop delay from an operational back bone network. In Proc. IEEE Infocom, New York, 2002. [9] K. Papagiannaki, D. Veitch, and N. Hohn. Origins of microcongestion in an access router. In Proc. Passive and Active Measurment Workshop, Antibes, Juan Les Pins, France, 2004. [10] V. Paxson. Measurements and analysis of end-to-end Internet dynamics. PhD thesis, University of California, Berkley, 1997. [11] W. Simpson. PPP in HDLC-like Framing. RFC 1662, 1994. [12] Waikato Applied Network Dynamics. http://wand.cs.waikato.ac.nz/wand/wits/.