Molecular Ecology (2006) 15, 781– 793
doi: 10.1111/j.1365-294X.2006.02836.x
Biogeographic patterns and phylogeography of dwarf chameleons (Bradypodion) in an African biodiversity hotspot
Blackwell Publishing Ltd
K R Y S T A L A . T O L L E Y ,* M A R I U S B U R G E R ,* A N D R E W A . T U R N E R † and C O N R A D A . M A T T H E E * *Evolutionary Genomics Group, Department of Botany and Zoology, University of Stellenbosch, Matieland 7602, South Africa, †Scientific Services, CapeNature, Stellenbosch 7600, South Africa
Abstract The southern African landscape appears to have experienced frequent shifts in vegetation associated with climatic change through the mid-Miocene and Plio–Pleistocene. One group whose historical biogeography may have been affected by these fluctuations are the dwarf chameleons (Bradypodion), due to their associations with distinct vegetation types. Thus, this group provides an opportunity to investigate historical biogeography in light of climatic fluctuations. A total of 138 dwarf chameleons from the Cape Floristic Region of South Africa were sequenced for two mitochondrial genes (ND2 and 16S), and resulting phylogenetic analyses showed two well-supported clades that are distributed allopatrically. Within clades, diversity among some lineages was low, and haplotype networks showed patterns of reticulate evolution and incomplete lineage sorting, suggesting relatively recent origins for some of these lineages. A dispersal-vicariance analysis and a relaxed Bayesian clock suggest that vicariance between the two main clades occurred in the mid-Miocene, and that both dispersal and vicariance have played a role in shaping present-day distributions. These analyses also suggest that the most recent series of lineage diversification events probably occurred within the last 3–6 million years. This suggests that the origins of many present-day lineages were founded in the Plio–Pleistocene, a time period that corresponds to the reduction of forests in the region and the establishment of the fynbos biome. Keywords: Cape Floristic Region, Chamaeleonidae, fynbos, phylogeography, reticulated evolution Received 24 June 2005; revision received 12 October 2005; accepted 4 November 2005
Introduction Climatic fluctuations are thought to be catalysts for evolution, promoting diversification and adaptation to new environmental conditions (Potts 1996; deMenocal 2004). For some African fauna and flora, lineage turnover through time (speciation, extinction, and distributional shifts) seems to have been substantially influenced by climatic fluctuations during the Pliocene and Pleistocene (Vrba 1995a, 1999; Behrensmeyer et al. 1997; Denton 1999; Linder 2003). For example, in the last 2–3 million years (Myr), African bovids, birds, and hominids have expanded and diversified as a result of climatic fluctuations and long-term shifts towards Correspondence: Krystal A. Tolley, Present address: Molecular Systematics Lab, South African National Biodiversity Institute, Private Bag X7, Claremont 7735, Cape Town, South Africa. Fax: +27-21-808-2405; E-mail:
[email protected] © 2006 Blackwell Publishing Ltd
cooler and drier conditions in East and Central Africa with gradual replacement of forests by open savannah and savannah-like woodlands (Foley 1991; deMenocal 1995, 2004; Kimbel 1995; Vrba 1995b; Potts 1996; Behrensmeyer et al. 1997; Bobe et al. 2002; Bobe & Behrensmeyer 2004; Jacobs 2004). Prior to the mid-Miocene, a mixture of forest vegetation seems to have dominated southern Africa, but with the start of a general cooling trend into the Pliocene, these biomes were less favoured as the region became more arid (Linder et al. 1992; Scott 1995; Linder 2003). Presently, southern Africa is characterized mainly by xeric and mesic vegetation types. In particular, the southern Cape region of Africa is dominated by ‘fynbos’, a Mediterranean-type heathland that is the major vegetation component of the Cape Floristic Region (CFR; Fig. 1). It is thought that the fynbos became established as a major biome in southern Africa between 3 and 5 million years ago (Ma) (Linder et al.
782 K . A . T O L L E Y E T A L .
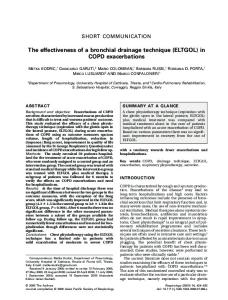
Fig. 1 Map of sampling localities for Bradypodion in the Cape Floristic Region (CFR). The solid line bounds the CFR, and sampling localities are indicated by white circles. Geographic areas used in diva are bounded by dashed lines and indicated by letter.
1992; Cowling & Richardson 1995; Scott 1995). The CFR has a high degree of floral endemism and is recognized as a major hot spot for biodiversity (Meadows & Sugden 1993; Cowling & Richardson 1995; Cowling et al. 1996; Myers et al. 2000; Latimer et al. 2005). It has been suggested that the remarkable endemicity of the CFR is due in part to the shifting and fragmentation of the landscape brought on by climatic fluctuations (Linder et al. 1992; Midgley et al. 2001). Some floral clades found in the CFR are considered to be ‘Cape clades’ whose evolutionary history, especially since the Pliocene, has been limited to and originated within the CFR (Linder 2003). If this process has promoted such extraordinary speciation in the floral assemblage, could climatic change also have influenced lineage turnover for the CFR fauna, and are there faunal ‘Cape clades’? Fauna that are tightly linked to vegetation or otherwise sensitive to climatic fluctuations may show historical biogeographic patterns that match general patterns in floral assemblage. Dwarf chameleons (Bradypodion) are highly dependent on vegetation, as their survival relies upon camouflage and stealth to obtain food, and for protection from predators. Changes to the structure of the vegetation in which they conceal themselves would be expected to have direct consequences for survival. Thus, this group provides an opportunity to examine lineage diversification associated
with major changes in vegetation. In the CFR, there are four endemic chameleons (Bradypodion pumilum, Bradypodion damaranum, Bradypodion taeniabronchum, Bradypodion gutturale) with a fifth currently being described (Branch, Tolley & Tilbury in prep.). Two additional species are not CFR endemics, but have ranges that extend partly into the CFR (Bradypodion occidentale, Bradypodion ventrale), and another eight species (Bradypodion kentanicum, Bradypodion caffrum, Bradypodion thamnobates, Bradypodion melanocephalum, Bradypodion dracomontanum, Bradypodion nemorale, Bradypodion setaroi, Bradypodion transvaalense) occur outside the CFR (Branch 1998; Tolley & Burger 2004a; Tolley et al. 2004). The genus is endemic to South Africa, and all species have allopatric distributions, although contact zones between geographically adjacent species are likely. An initial phylogenetic analysis of mitochondrial DNA for Bradypodion suggests that there are several distinct clades with close evolutionary relationships within each of the clades (Tolley et al. 2004). Despite the advances in our understanding of this group, some taxonomic uncertainties remain for these closely related lineages (Tolley & Burger 2004a; Tolley et al. 2004). The confusion arises largely from discrepancies between the mitochondrial gene tree, and the traditional taxonomic classification based on morphology. In some instances, these are incompatible (Tolley & © 2006 Blackwell Publishing Ltd, Molecular Ecology, 15, 781– 793
D W A R F C H A M E L E O N P H Y L O G E O G R A P H Y 783 Burger 2004a), suggesting that the processes that shape morphology are dissimilar to those that influence evolution of mitochondrial lineages. The objective of this study was to obtain a better understanding of the evolutionary relationships within Bradypodion by exploring phylogeographic patterns in the CFR. The underlying evolutionary processes leading to the phylogeographic patterns were considered by examining parallels between phylogeography and information on palaeo-vegetation, and by constructing ancestral area hypotheses and estimates of divergence times for the wellsupported clades. We hypothesized that the genus contains ‘Cape clades’ whose evolutionary history originated in, and has been limited to the CFR. We predicted that lineage diversification of the Cape clades has been driven by the emergence of the Cape flora, specifically the fynbos, and thus the majority of lineages in the Cape clades will be (i) restricted to the CFR and (ii) associated with fynbos. To examine these predictions, we investigated whether the timing of the diversification of Bradypodion Cape clades corresponded temporally to the emergence of fynbos as the dominant vegetation type of the CFR, and whether the emergence and diversification of Cape clades could be reconciled with corresponding biogeographic areas mapped onto a Bradypodion phylogeny. We also hypothesized that if lineage extinctions are associated with the post-Miocene reduction of closed habitats across southern Africa, that any clades whose biogeographic history is associated with pre-Pliocene closed habitats (e.g. forest, woodland) instead of fynbos, will contain fewer number of lineages than Cape clades.
Materials and methods Sampling and laboratory protocols Tissue samples were obtained from 138 dwarf chameleons (96 tail clips, liver from 42 voucher specimens) from the CFR (Supplementary materials). Sequences from 56 of these individuals have been published previously (Tolley & Burger 2004a, b; Tolley et al. 2004). DNA extraction, polymerase chain reaction (PCR) amplification, and cycle sequencing of two mitochondrial gene fragments (580 bp of ND2 and 460 bp of 16S rRNA) were carried out following standard procedures formerly outlined in Tolley et al. (2004). All sequences have been deposited in GenBank and voucher specimens have been deposited in the Port Elizabeth Museum, South Africa (Supplementary materials).
Phylogenetic and phylogeographic analyses Although the current investigation focuses on understanding phylogeographic patterns within a region, a phylogenetic analysis was carried out to ensure that the current data © 2006 Blackwell Publishing Ltd, Molecular Ecology, 15, 781–793
set is congruent with the original phylogenetic hypothesis (Tolley et al. 2004). This data set excluded all duplicate haplotypes, and included at least one individual from each described species plus one individual from new sampling localities (n = 41). The data set also included the 10 species (17 individuals) that are not endemic to the CFR (B. ventrale, B. melanocephalum, B. transvaalense, B. dracomontanum, B. thamnobates, B. kentanicum, B. occidentale, B. nemorale, B. caffrum, B. setaroi). Sequence alignment gaps were treated as a 5th character (none for ND2, 14 characters for 16S), and alignments were carried out in clustal_x using default parameters. A 40-bp portion of the 16S gene could not be aligned unambiguously so these bases were removed from the data set. A partition homogeneity test did not indicate conflicting phylogenetic signal between the mitochondrial genes (P > 0.05, 100 repartitions), so both genes were analysed together (Farris et al. 1994; Hipp et al. 2004). Four species of chameleons were used as outgroup taxa (Calumma hilleniusi, Chamaeleo dilepis, Chamaeleo fischeri, and Furcifer labourdi). An examination of uncorrected p distances against K2P (Kimura 2-parameter) distances revealed no saturation among ingroup taxa and thus no differential weighting schemes were used. An unweighted parsimony analysis with heuristic search [tree-bisection-reconnection (TBR) branch swapping] was performed using 1000 random addition replicates [accelerated transformation (ACCTRAN) character optimization] using paup*4.0b10 (Swofford 2002). Confidence in the nodes was assessed by 1000 bootstrap replicates with an initial random addition of taxa. Bayesian inference was used to investigate optimal tree space using mrbayes 3.1.0 (Huelsenbeck & Ronquist 2001) specifying six rate categories with uniform priors for the gamma distribution and invariable sites. Several data partitions were created, and each was allowed to run with separate values for the model parameters. There were three partitions for ND2: 1st, 2nd, and 3rd codons separately. For 16S, the first 258 bases were partitioned, the next 40 bases were removed from the analysis, and the final partition consisted of the last 162 bases. Markov chain Monte Carlo (MCMC) was run five times for 5 million generations each, sampling trees every 100 generations. The first 40 000 generations (400 trees) were removed as burn-in (after examination of log-probabilities) before constructing a 50% majority rule tree. Parsimony median-joining networks were constructed separately for each of the two main CFR clades recovered from the initial phylogenetic analyses using network version 4.1.0.0 (Bandelt et al. 1999), as branch connection between these two clades could not be reconstructed with 95% confidence (tcs; Clement et al. 2000). Network construction included all individuals, but because of missing data at the ends of 13 of the 16S sequences, the consensus region was shortened to 431 bases for that gene.
784 K . A . T O L L E Y E T A L .
A dispersal-vicariance analysis (diva) was carried out to examine possible biogeographic scenarios, and to generate hypotheses for dispersal or vicariance events given the branching pattern in the phylogenetic tree (Ronquist 1996, 1997). diva allows biogeographic hypotheses to be made, and differs from traditional ancestral character state reconstruction (Cunningham et al. 1998; Omland 1999) because it uses a two-dimensional cost matrix that applies a cost of 1 to dispersal/extinction and no cost to vicariance (Ronquist 1996, 1997). Interpretations of biogeographic reconstructions of ancestral areas are limited for deeper nodes because lineages may have undergone historical changes in geographic distribution that do not correspond to contemporary distributions, and because there is a lack of information on the distribution of ancestral lineages (Ronquist 1997; Losos & Glor 2003). However, this analysis can be useful for examining plausible dispersal and vicariance events among the more recent nodes where reasonable assumptions regarding distributions can be made. diva analysis requires a simple, bifurcating tree, hence one individual from each lineage/taxon and four representative taxa from outside the CFR were used to construct a parsimony tree (n = 14, plus 4 outgroup taxa). The resulting topology is congruent with the complete phylogenetic analysis (this study; Tolley et al. 2004). Each lineage was coded as being present/absent in specific geographic areas (Fig. 1) that were defined according to major vegetation communities (Cowling & Holmes 1992; Low & Rebelo 1996; Barrable et al. 2002; Linder 2003) and were defined as: A, west coast; B, southwest CFR; C, central CFR; D, eastern CFR; E, eastern vegetation mosaic; F, northeast; G, Other (Madagascar/East Africa). The inclusion of regions F–G was only for producing a complete tree, but biogeographic patterns within those regions were not considered here.
d.f. = 124, P < 0.001). In light of recent concerns over the application of constant molecular clocks (e.g. Bromham et al. 1999; Bromham & Penny 2003; Graur & Martin 2004; Hugall & Lee 2004), a relaxed Bayesian clock was used to estimate divergence times between clades (Thorne et al. 1998). The tree topology used for diva was input in the ‘baseml’ module of the package pmal version 3.14 to estimate the model parameters (F81 + Γ as the only available option; Yang 1997). The branch lengths were then estimated using the ‘estbranches’ module from the Multidistribute package (Thorne et al. 1998; Thorne & Kishino 2002). The resulting tree with branch lengths (plus the variance/covariance matrix) was input into the Multidivtime module and used to produce estimates of node divergences and associated standard deviations and confidence intervals (Thorne et al. 1998; Thorne & Kishino 2002). Two calibration points were included in the analysis, each with upper and lower limits. The oldest known fossil chameleon (Chamaeleo caroliquarti) is estimated to be c. 26 Myr old (Moody & Rocek 1980). Although fossil fragments suggest that early acrodont iguanians were present in the Jurassic, a diversity of acrodont fossils appears only by the late Cretaceous (Frost & Etheridge 1989; Evans 2003). Thus, we assumed that the origin of the Chamaeleonidae was between 26 and 100 Myr. Based on a Bayesian molecular clock, the split between most chameleon genera has been dated at approximately 25–45 Myr (Matthee et al. 2004). Raxworthy et al. (2002) generated a less reliable estimate for the same split (28–68 Myr) using a constant clock. Given the fossil record and the best available molecular dating, the upper and lower limits between outgroup taxa [(Ch. fischeri + Ca. hilleniusi) + Ch. dilepis)] were set at 25 and 45 Myr, and the maximum time allowed to reach the base of the tree (‘big time’) was set at 100 Myr. The second calibration point was for the split between Bradypodion and all other chameleons, and was assumed to be at least 6 Myr based on the presence of ∼5.2-Myr-old fragments of fossil Bradypodion skulls in the Langebaan fossil bed, South Africa (J. van den Worm, Stellenbosch University, personal communication, 2004). In the absence of any other information, the upper limit for this calibration point was also set to 45 Myr. Given that the upper limits are actually secondary calibration points with their own intrinsic uncertainty (Graur & Martin 2004), the analysis was run an additional time with only the single lower limit calibration point obtained from the fossil record for the Bradypodion. Both runs produced similar divergence estimates, but the run with two calibration points produced lower standard errors, so only those estimates are discussed.
Molecular clock
Results
As evaluated using a likelihood-ratio test, the data violated the assumption of a constant molecular clock (LRT = 194.8,
Of the 1000 characters included in the analysis, 229 were parsimony informative (624 were constant). Both
To allow an assessment of the degree of differentiation among the sampling areas, a spatial analysis of molecular variance (samova; Dupanloup et al. 2002) was conducted post hoc after identification of reticulated clades in the network. The samova takes into consideration geographic locations of sampling, and maximizes the proportion of genetic variance among K groups of populations (Dupanloup et al. 2002). As such, this analysis was useful for statistically differentiating between historically isolated groups in the network. samova was run with several different group structures to determine the maximum value for FCT (the maximized proportion of total genetic variance due to differences between groups).
Dispersal-vicariance analyses
© 2006 Blackwell Publishing Ltd, Molecular Ecology, 15, 781– 793
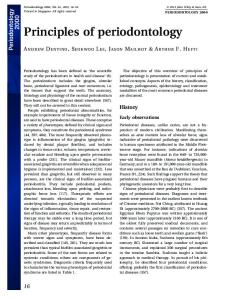
D W A R F C H A M E L E O N P H Y L O G E O G R A P H Y 785 Fig. 2 A parsimony phylogram for Bradypodion from South Africa. Parsimony bootstraps (1000 replicates) for each node are above the branches, and the range of Bayesian posterior probabilities (5 runs, 5 million generations each) are below the branches. Values are not given for nodes with < 50% bootstrap or < 0.95 posterior probability. The main clades are indicated (I and IIa, IIb, IIc) and species names are given at the terminal tips. Clades I and IIa occur in the CFR.
phylogenetic methods produced the same basic topology (Fig. 2) and the parsimony analysis recovered 144 equally parsimonious trees with 847 steps (CI = 0.497, RI = 0.767, HI = 0.503) with differences confined to terminal branch swapping. There is a deep split resulting in two distinct evolutionary lineages of dwarf chameleons (Fig. 2), separated by 7– 8% sequence divergence for ND2 and 3–4% sequence divergence for 16S rRNA (see Supplementary materials). Clade II can be subdivided into a clade (IIa) that is endemic to the CFR (except for B. ventrale and B. kentanicum), and those that occur outside the CFR (B. occidentale, B. dracomontanum, B. melanocephalum, B. transvaalense, B. thamnobates, B. caffrum, B. setaroi, B. nemorale). These results are consistent with the original phylogenetic hypothesis (Tolley et al. 2004). © 2006 Blackwell Publishing Ltd, Molecular Ecology, 15, 781–793
The median-joining network showed three lineages in clade I (also recovered in the phylogenetic analysis with high support). Notably, the lineage from the Kouga and Tsitsikamma mountains (B. sp1) is closely related to B. damaranum (Figs 2 and 3a). Despite being closely related and geographically adjacent to each other, these two lineages are morphologically distinct (Tolley & Burger 2004a; K. Tolley, unpublished) and occur in different habitats. In short, B. damaranum occurs in relict indigenous forest, has a high casque, is brilliantly coloured, and has a tail that is longer than the body. B. sp1 occurs in the fynbos, has a reduced casque, dull coloration, and has a tail that is shorter than the body. The network also shows a highly divergent mitochondrial allele (KTH131) that is represented by a single specimen (B. cf. damaranum) found in an isolated
786 K . A . T O L L E Y E T A L .
Fig. 3 Median-joining haplotype networks for the two Bradypodion clades in the Cape Floristic Region (a) clade I and (b) clade IIa. Dashed lines surround species, or geographic locations for those not described as species. Habitat types are given for each grouping. The sizes of the circles indicate the frequency of the haplotypes, and the length of the branches indicates distance between haplotypes. In cases where branch lengths are not drawn to proportion, the number of mutations along those branches is given.
© 2006 Blackwell Publishing Ltd, Molecular Ecology, 15, 781– 793
D W A R F C H A M E L E O N P H Y L O G E O G R A P H Y 787 patch of relict indigenous forest (Grootvadersbosch) several hundred kilometres to the west (Figs 3a and 5). Clade IIa presents a more complicated pattern (Figs 2 and 3b). There are two divergent lineages (B. gutturale, B. sp2) with the remainder of the lineages forming a shallow structure that generally lacks support in the phylogenetic analyses (Fig. 2). Several of these lineages correspond to described species (e.g. B. ventrale, B. taeniabronchum, B. kentanicum, but the presence of additional lineages is evident (i.e. B. cf. taeniabronchum; B. sp3). There is also a group of mitochondrial alleles originating from the chameleons collected in the montane fynbos of the Groot Winterhoek Mountains that are central in the network (B. sp4). These chameleons have a distinct appearance, although their morphology has not been investigated quantitatively (Tolley & Burger 2004a). In contrast, two individuals collected from the Albany thicket vegetation at the base of the same mountains were identified in the field as B. ventrale (KTH158, KTH160) yet they share mitochondrial alleles with Bradypodion sp4. The samova was run on the lineages from clade IIa (B. taeniabronchum, B. cf. taeniabronchum, B. ventrale, B. kentanicum, B. sp3, B. sp4) to investigate the possibility that these lineages can be defined as distinct groups that are not well supported in the phylogenetic tree. samova shows a large increase in FCT when the clade is divided into the six lineages identified by the network (Table 1). Although FCT increases as more groups are specified, it does so at a slow rate and is most likely a function of the corresponding decrease in FSC (Dupanloup et al. 2002) that would continue until all sampling areas are considered as separate. The samova suggests that the lineages in the network have been historically isolated, despite lack of resolution in a phylogenetic context. Dispersal-vicariance analysis and the relaxed Bayesian clock (Fig. 4) point to an initial vicariance between clades I and II into the eastern/southwest CFR and the west coast/ interior CFR/northeast in the mid-Miocene (c. 14 Myr, SD 4.4 Myr). The next series of events indicated would be vicariance of IIc (northeast) from the remainder of clade II, followed by vicariance of IIb (west coast) and clade IIa (interior CFR). These events could have occurred between c. 9–11 Myr (Fig. 4). Several dispersal events are then hypothesized to have occurred during the last c. 6 Myr within clade IIa. diva suggests an ancestral area for clade IIa in the central CFR (area C), with dispersal from this area to the eastern CFR (area D) during the last c. 3 – 6 Myr. Additional dispersal of B. gutturale to the southwest CFR (area B) is also suggested by diva. In addition, it appears there were two separate dispersals out of the CFR to the Eastern Cape vegetation mosaic (area E; B. ventrale, B. kentanicum). Dates for the most recent dispersal events were not considered, as the nodes were not well supported in the phylogenetic analysis but would have occurred © 2006 Blackwell Publishing Ltd, Molecular Ecology, 15, 781–793
Table 1 Results from a spatial analysis of molecular variance (samova) showing F values given different numbers of groupings. Sets of lineages that were combined within the groups are indicated 3 groups 1. taeniabronchum 2. kentanicum + cf. taeniabronchum + sp3 + sp4 3. ventrale 4 groups 1. taeniabronchum 2. kentanicum + sp3 + sp4 3. ventrale 4. cf. taeniabronchum 5 groups 1. taeniabronchum 2. kentanicum + sp4 3. ventrale 4. cf. taeniabronchum 5. sp3 6 groups 1. taeniabronchum 2. kentanicum 3. ventrale 4. cf. taeniabronchum 5. sp3 6. sp4 7 groups 1. taeniabronchum 2. kentanicum 3. ventrale 1 4. ventrale 2 5. cf. taeniabronchum 6. sp3 7. sp4 8 groups 1. taeniabronchum 2. kentanicum 3. ventrale 1 4. ventrale 2 5. ventrale 3 6. cf. taeniabronchum 7. sp3 8. sp4
FSC = 0.621 FST = 0.756 FCT = 0.435 FSC = 0.540 FST = 0.778 FCT = 0.519
FSC = 0.418 FST = 0.774 FCT = 0.612
FSC = 0.220 FST = 0.773 FCT = 0.710
FSC = 0.099 FST = 0.769 FCT = 0.744
FSC = 0.026 FST = 0.768 FCT = 0.762
within the last c. 3–4 Myr given the split for B. gutturale at c. 3.8 Myr.
Discussion Consistent with the original phylogenetic hypothesis (Tolley et al. 2004), dwarf chameleons from the Cape Floristic Region (CFR) are found in two well-supported clades that are allopatric in distribution (Fig. 2). Clade I is endemic to the southern Cape Floristic Region (Fig. 5), while clade IIa is near endemic to the central CFR (except for B. ventrale and B. kentanicum). The timing of the radiation of lineages in clade IIa corresponds to the emergence of the Cape
788 K . A . T O L L E Y E T A L . Fig. 4 Phylogenetic tree based on parsimony showing inferred dispersal events (circles) and vicariance events (triangles) for Bradypodion in the Cape Floristic Region. Areas of present distribution (A–G) are given for each terminal taxon with assumed ancestral areas given at each node. Estimated ages (million years) of nodal splits are indicated, with standard deviations given in parentheses. Dispersal–vicariance events and node times are not shown for taxa outside the study area.
Flora c. 3–5 million years ago (Ma), suggesting that this is a ‘Cape clade’ with the majority of its evolutionary history associated with the Cape Floristic Region (CFR). Conversely, the origin of clade I appears to reach back to a time prior to the emergence of the CFR vegetation, perhaps as early as c. 8.6 Ma (±3.6 Myr) suggesting the radiation of lineages in clade I did not correspond with the emergence of the CFR. Thus, clade I may not be a characteristic Cape clade, despite its present geographic distribution within the CFR. To a large extent, the evolutionary and biogeographic histories of clades I and IIa are dissimilar, pointing to different historical processes that have operated on the
groups. Members of clade I are typically forest forms with large bodies, bright colouration, high casques, and long tails. They are found in Afromontane forest along the south coast (Knysna Forest), and in a mosaic of closed canopy habitats (e.g. forest patches and riverine thicket) in the southwest. The exception is Bradypodion sp1, which is a typical fynbos adapted form with a small body, dull coloration, reduced casque, and short tail (Tolley & Burger 2004a). Unlike other lineages in this clade, it occurs in the fynbos vegetation of the Kouga Mountains and northern slopes of the Tsitiskamma, and not in the adjacent Knysna Forest of the southern slopes (Fig. 5). The median-joining network, phylogenetic analysis, and low sequence divergence © 2006 Blackwell Publishing Ltd, Molecular Ecology, 15, 781– 793
D W A R F C H A M E L E O N P H Y L O G E O G R A P H Y 789
Fig. 5 A map of the study area showing the geographic distribution of the two clades of Bradypodion. Open circles indicate localities for clade I and filled circles indicate localities for clade IIa. Triangles show the locations of clade IIb. Clade IIc occurs outside the study area and is not shown.
indicate that B. sp1 is closely related to B. damaranum (Figs 2 and 3a, Supplementary materials), suggesting recent divergence between these lineages (Fig. 4). It is possible that B. sp1 has recently taken advantage of the fynbos, a move that was accompanied by morphological adaptation to that vegetation type. In complete contrast, an individual found in an isolated patch of relict indigenous forest (Grootvadersbosch) over 150 km to the west of the Kynsna Forest had a highly divergent mitochondrial allele (KTH131). This chameleon was indistinguishable in the field from other forest-dwelling B. damaranum, yet was genetically divergent (Fig. 3a). No other samples have been obtained for genetic analysis, but an additional specimen in the South African Museum (Iziko Museums of Cape Town) collected from Grootvadersbosch also displays the forest morph (SAM ZR47811). Presumably the Knysna and the Grootvadersbosch forests were once connected, but became fragmented and separated as fynbos encroached into the region. If so, then chameleons in Grootvadersbosch would represent a relictual, but genetically divergent, lineage of the original B. damaranum lineage. These results suggest that dwarf chameleon morphology strongly reflects adaptation to vegetation type, despite their evolutionary relationships. In forest habitats, chameleons © 2006 Blackwell Publishing Ltd, Molecular Ecology, 15, 781–793
appear to be under pressure to retain the forest morphology, even with mtDNA divergence in complete allopatry. In differing habitats (i.e. closed canopy forest vs. open canopy fynbos), they differ morphologically despite little genetic divergence. It has been suggested that morphology corresponds to habitat type for some chameleons (Bickel & Losos 2002), but the rate at which such diversification occurs is not known. Rapid morphological diversification in connection with vegetation structure changes has been demonstrated empirically for several lizards (e.g. Losos et al. 1997; Vitt et al. 1997; Jordan et al. 2005), but in some cases this can be the result of phenotypic plasticity (Losos et al. 2000) rather than adaptive radiation. While not tested empirically, the morphological changes for dwarf chameleons appear to be associated with long-term shifts in vegetation structure, and could be indicative of an adaptive radiation that mirrors the vegetation shifts linked to climate fluctuations. Some clades may not have had the opportunity to adjust to vegetation changes during climatic shifts, reflected by the paucity of lineages in clade I, and the relatively substantial divergence between extant lineages (e.g. B. pumilum and B. damaranum). This pattern could be the result of lineage extinctions as other vegetation types replaced forests and
790 K . A . T O L L E Y E T A L . woodlands. The presence of chameleons with the ‘forest morph’ in the isolated patch of forest (i.e. Grootvadersbosch), but not in the surrounding open fynbos, certainly suggests that some members of this clade are tightly linked to forest vegetation. Thus, the historical reduction of forests since the Miocene could mark the disappearance of some forest chameleon lineages. Within clade I, adaptation and dispersal into the fynbos has occurred only for the Kouga/Tsitsikamma lineage (B. sp1) and to some extent, for B. pumilum. The latter species shows considerable morphological variation in association with habitat, and occurs in a mosaic of open and closed canopy including fynbos, dune thicket, and pockets of indigenous and riparian forest. Chameleons of this species that are found in open habitats lack the characteristic forest morphology, and generally resemble fynbos species (e.g. reduced casque, short tail, small body; K. A. Tolley, unpublished). Some areas of its range may have been substantially forested as recently as 10 000 years ago (see Linder 2003) and its occurrence in open habitats such as fynbos may be a result of very recent vegetation changes that have been accompanied by morphological adaptation to the open habitat. Many phylogenetic relationships within clade IIa are not well resolved, with short internal branch lengths, low bootstrap support, and low divergences (Fig. 2, Supplementary materials). This is suggestive of relatively recent origins accompanied by a rapid radiation of these lineages. In addition, there is a cluster of centrally located haplotypes (B. sp4) corresponding to chameleons from the Groot Winterhoek Mountains in the eastern CFR (Fig. 3b). Given its position in the network, this group seems to be central to a radiation of chameleons into the eastern CFR fynbos. Members of clade IIa occur almost exclusively in the fynbos biome, although two lineages (B. ventrale, B. kentanicum) can be found in the eastern vegetation types outside the CFR. The diva analysis and Bayesian clock suggest that the lineages of clade IIa moved into the fynbos between ∼3– 6 Ma. Timing of this event corresponds with the establishment of the fynbos as the dominant vegetation type during the Pliocene, approximately 3 – 5 Ma (Linder et al. 1992; Cowling & Richardson 1995). In addition, the possible establishment of B. sp1 (clade I) in the fynbos would have occurred within this same time frame (∼3.6 Myr, Fig. 4). Thus, it appears that radiation in association with the encroaching fynbos was not limited to clade IIa, although members of that clade dominate the radiation. Due to considerable climatic fluctuation throughout the Plio–Pleistocene and into the Quaternary, vegetational changes in the region are thought to be more complex than a simple reduction of forest and establishment of fynbos and other mesic and arid vegetation types (Scott 1995; Midgley et al. 2001; Barrable et al. 2002). Instead, it seems that climatic fluctuations have periodically created islands of differing vegetation types, some of which may have
persisted as isolated patches for periods of time. It is likely that for chameleons in the CFR, several episodes of repeated allopatry and subsequent contact have occurred as a result of these vegetation fluctuations and changes. Periods of contact between lineages could have led to repeated periods of hybridization or introgression, followed by episodes of diversification in allopatry. The situation is perhaps even more complicated, with some lineages in allopatry while others may be contemporaneously in contact. For example, four individuals observed in the transition zone between montane fynbos and mesic succulent thicket on the lower slopes of the Groot Winterhoek Mountains were identified as B. ventrale based on morphological appearance. The DNA sequences for two of those individuals (KTH158, KTH160) grouped with Groot Winterhoek chameleons (B. sp4) found on the upper slopes in fynbos, all of which have typical ‘fynbos morph’ (Figs 3b and 5). This haplotype sharing could suggest that lineage sorting is incomplete, but a more likely explanation is that recent hybridization of B. sp4 with B. ventrale has occurred. The B. sp4 haplotypes in the B. ventrale morphotypes have been discovered only in individuals from the transition zone between the fynbos and the thicket biome. If lineage sorting were incomplete, we would expect to find shared haplotypes across other geographic regions and not just in the transition zone between these two areas. The presence of these B. sp4 haplotypes with the B. ventrale morphotypes supports the hypothesis that contact zones exist between lineages and that interbreeding may occur at these zones. It is important to consider that the evolutionary patterns observed here are based on mitochondrial DNA only, and as a single unit of inheritance, it is simply the first step in resolving the evolutionary history of this group. The mtDNA haplotype sharing and reticulated evolution may be partly the result of hybridization or perhaps introgression at contact zones resulting in dynamic and complex phylogeographic patterns. The future inclusion of nuclear markers seems to be critical to fully reconstruct the recent history of this group. Regardless, wholesale biogeographic patterns seem to be the result of changes beginning in the mid-Miocene, followed by diversification, dispersal and rapid radiation as the fynbos biome became established in the Plio–Pleistocene. Biogeographic scenarios such as those suggested here must be interpreted with caution when there are no estimates of confidence for such scenarios, and when information is lacking on the geographic distribution and phylogenetic relationships of ancestral species (Losos & Glor 2003; Crisp & Cook 2005). However, the diva analysis allows some initial hypotheses to be made regarding distribution shifts that may have fragmented clades geographically (clade I), and allowed other clades to take advantage of the emergence of novel habitats (clade IIa). At this stage, these must remain hypotheses, although it is important to note that the hypothesized biogeographic © 2006 Blackwell Publishing Ltd, Molecular Ecology, 15, 781– 793
D W A R F C H A M E L E O N P H Y L O G E O G R A P H Y 791 scenario corresponds well to the timing of major vegetation shifts. The timing of the radiation of dwarf chameleons into fynbos corresponds roughly to other major changes in faunal assemblages across Africa, suggesting that shifts in climate and vegetation have had continent-wide effects on faunal biogeography. Presently, most lineages of clade IIa are distributed in the eastern CFR throughout the most complex mosaic of vegetation types in Southern Africa. Five major biomes are currently in contact in this region, perhaps fuelling geographic fragmentation of fynbos lineages, creating a dynamic landscape that provides opportunities for some lineages to diversify in allopatry, while others come into contact. It remains to be tested whether the radiation of these mitochondrial lineages represents an adaptive radiation (Losos & Miles 2002), but the future addition of morphological characters and nuclear markers to the present mitochondrial data will be extremely useful for fully understanding the taxonomy, evolutionary relationships, historical biogeography, and the tempo and mode of the radiation in this group.
Acknowledgements We would like to thank all those who have assisted in the field with collections: B. Beyer, D. Beyer, D. Clark, M. Cunningham, A. de Villiers, C. Henderson, G. Lombardi, A. Moussalli, A. Page, H. Smit, R. Smith, S. Stoffburger, D. Stuart-Fox, B. Swart, K. Whitaker. CapeNature, the Eastern Cape Department of Tourism and Economic Affairs, Vogelgat Nature Reserve, MTO Forestry Ltd, Churchill Dam, Hudson Vale Farm, and Jagersbos Farm kindly allowed access to their reserves or properties. We would like to thank all the reserve managers and field rangers for their assistance, as well D. Hamerton at the South African Museum for access to the chameleon collection. Thanks to W. Branch, M. Cunningham, F. Forest, L. Mucina, S. van Noort, and B. van Vuuren for advice on the manuscript, and to N. Solomons for assistance in the laboratory. This work was funded by the South African National Research Foundation (GUN 2053617), and the University of Stellenbosch with grants to C.A.M and K.A.T, with fieldwork partly funded through a WWF-Table Mountain Fund grant to M. Cunningham. This work was conducted under Eastern Cape permits # WRO25/02WR, WRO15/03WR, and Western Cape # 423/2002.
Supplementary materials The supplementary materials are available from http:// www.blackwellpublishing.com/products/journals/suppmat/ MEC/MEC2836Sm.htm Appendix S1 GenBank and museum voucher accession numbers for chameleons used in this study (PEM-R, Port Elizabeth Museum, South Africa). Sampling locality details are given as decimal degrees for chameleons from the Cape Floristic Region. Clade membership corresponds to Fig. 2 (clades I, IIa, IIb, IIc). K. A. Tolley field series: specimens deposited but marked ‘PEM’ have not yet received museum accession numbers. © 2006 Blackwell Publishing Ltd, Molecular Ecology, 15, 781–793
Appendix S2 Sequence divergences (uncorrected p distances) within and among the mtDNA lineages for Bradypodion for (a) ND2 and (b) 16S. Values on the diagonal are within-lineage sequence divergences [not calculated (n/c) for lineages with only one individual].
References Bandelt H-J, Forster P, Röhl A (1999) Median-joining networks for inferring intraspecific phylogenies. Molecular Biology and Evolution, 16, 37–48. Barrable A, Meadows ME, Hewitson BC (2002) Environmental reconstruction and climate modelling of the Late Quaternary in the winter rainfall region of the Western Cape, South Africa. South African Journal of Science, 98, 611–616. Behrensmeyer AK, Todd NE, Potts R, McBrinn GE (1997) Late Pliocene faunal turnover in the Turkana Basin, Kenya and Ethiopia. Science, 278, 1589–1594. Bickel R, Losos JB (2002) Patterns of morphological variation and correlates of habitat use in chameleons. Biological Journal of the Linnean Society, 76, 91–103. Bobe R, Behrensmeyer AK (2004) The expansion of grassland ecosystems in Africa in relation to mammalian evolution and the origin of the genus Homo. Palaeogeography, Palaeoclimatology, Palaeoecology, 207, 399–420. Bobe R, Behrensmeyer AK, Chapman RE (2002) Faunal change, environmental variability, and late Pliocene hominin evolution. Journal of Human Evolution, 42, 475–497. Branch WR (1998) Field Guide to Snakes and Other Reptiles of Southern Africa. Revised Edition. Struik, Cape Town, South Africa. Bromham L, Penny D (2003) The modern molecular clock. Nature Reviews Genetics, 4, 216–224. Bromham L, Phillips MJ, Penny D (1999) Growing up with dinosaurs: molecular dates and the mammalian radiation. Trends in Ecology & Evolution, 14, 113–118. Clement M, Posada D, Crandall KA (2000) tcs: a computer program to estimate gene genealogies. Molecular Ecology, 9, 1657–1659. Cowling RM, Holmes PM (1992) Flora and vegetation. In: The Ecology of Fynbos, Nutrients, Fire and Diversity (ed. Cowling RM), pp. 23–61. Oxford University Press, Oxford, UK. Cowling RM, MacDonald IAW, Simmons MT (1996) The Cape Peninsula, South Africa: physiological, biogeographical and historical background to an extraordinary hot-spot of biodiversity. Biodiversity and Conservation, 5, 527–550. Cowling RM, Richardson D (1995) Fynbos, South Africa’s Unique Floral Kingdom. Fernwood Press, Cape Town, South Africa. Crisp MD, Cook LG (2005) Do early branching lineages signify ancestral traits? Trends in Ecology & Evolution, 20, 122–128. Cunningham CW, Omland KE, Oakley TH (1998) Reconstructing ancestral character states: a critical reappraisal. Trends in Ecology & Evolution, 13, 361–366. deMenocal PB (1995) Plio-Pleistocene African climate. Science, 270, 53–59. deMenocal PB (2004) African climate change and faunal evolution during the Pliocene-Pleistocene. Earth and Planetary Science Letters, 220, 3–24. Denton GH (1999) Cenozoic climate change. In: African Biogeography, Climate Change and Human Evolution (eds Bromage TG, Schrenk F), pp. 94–114. Oxford University Press, Oxford, UK. Dupanloup I, Schneider S, Excoffier L (2002) A simulated annealing approach to define the genetic structure of populations. Molecular Ecology, 11, 2571–2581.
792 K . A . T O L L E Y E T A L . Evans SE (2003) At the feet of dinosaurs: the early history and radiation of lizards. Biological Reviews, 78, 513 –551. Farris JS, Källersjö M, Kluge AG, Bult C (1994) Testing significance of incongruence. Cladistics, 10, 315 – 319. Foley KA (1991) How many species of hominid should there be? Journal of Human Evolution, 20, 413 – 427. Frost D, Etheridge R (1989) A Phylogenetic Analysis and Taxonomy of Iguanian Lizards (Reptilia: Squamata). University of Kansas Museum of Natural History, Miscellaneous Publications, 81, 65 pp. Graur D, Martin W (2004) Reading the entrails of chickens: molecular timescales of evolution and the illusion of precision. Trends in Ecology & Evolution, 20, 80 – 86. Hipp AL, Hall JC, Sytsma KJ (2004) Congruence versus phylogenetic accuracy: revisiting the incongruence length difference test. Systematic Biology, 53, 81– 89. Huelsenbeck JP, Ronquist F (2001) mrbayes: Bayesian inference of phylogenetic trees. Bioinformatics, 17, 754 – 755. Hugall AF, Lee MSY (2004) Molecular claims of Gondwanan age for Australian Agamid lizards are untenable. Molecular Biology and Evolution, 21, 2102 – 2110. Jacobs BF (2004) Palaeobotanical studies from tropical Africa: relevance to the evolution of forest, woodland and savannah biomes. Philosophical Transactions of the Royal Society of London. Series B, Biological Sciences, 359, 1573 –1583. Jordan MA, Snell HL, Snell HM, Jordan WC (2005) Phenotypic divergence despite high levels of gene flow in Galápagos lava lizards (Microlophus albemarlensis). Molecular Ecology, 14, 859– 867. Kimbel WH (1995) Hominid speciation and Pliocene climate change. In: Paleoclimate and Evolution, with Emphasis on Human Origins (eds Vrba ES, Denton GH, Partridge TC, Burckle LH), pp. 425–437. Yale University Press, New Haven, Connecticut. Latimer AM, Silander JA, Cowling RM (2005) Neutral ecological theory reveals isolation and rapid speciation in a biodiversity hot spot. Science, 309, 1722 –1725. Linder HP (2003) The radiation of the Cape flora, southern Africa. Biological Reviews, 78, 597– 638. Linder HP, Meadows ME, Cowling RM (1992) History of the Cape flora. In: The Ecology of Fynbos, Nutrients, Fire and Diversity (eds Cowling RM), pp. 113 –134. Oxford University Press, Oxford, UK. Losos JB, Glor RE (2003) Phylogenetic comparative methods and the geography of speciation. Trends in Ecology & Evolution, 18, 220–227. Losos JB, Miles DB (2002) Testing the hypothesis that a clade has adaptively radiated: iguanid lizard clades as a case study. American Naturalist, 160, 147 –157. Losos JB, Warheit KI, Schoener TW (1997) Adaptive differentiation following experimental island colonization in Anolis lizards. Nature, 387, 70 – 73. Losos JB, Creer DA, Glossip D et al. (2000) Evolutionary implications of phenotypic plasticity in the hindlimb of the lizard Anolis sagrei. Evolution, 54, 301– 305. Low AB, Rebelo AG (1996) Vegetation of South Africa, Lesotho and Swaziland. Department of Environmental Affairs and Tourism, Pretoria, South Africa. Matthee CA, Tilbury CR, Townsend T (2004) A phylogenetic review of the African leaf chameleons: genus Rhampholeon (Chamaeleonidae): the role of vicariance and climate change in speciation. Proceedings of the Royal Society of London. Series B, Biological Sciences, 271, 1967 –1976.
Meadows ME, Sugden JM (1993) The late Quaternary palaeoecology of a floristic kingdom: the southwestern Cape South Africa. Palaeogeography, Palaeoclimatology, Palaeoecology, 101, 271–281. Midgley GF, Hannah L, Roberts R, MacDonald DJ, Allsopp J (2001) Have Pleistocene climatic cycles influenced species richness patterns in the greater Cape Mediterranean Region? Journal of Mediterranean Ecology, 2, 137–144. Moody S, Rocek Z (1980) Chamaeleo caroliquarti: a new species from the Lower Miocene of Central Europe. Vestnik Ustredniho Ustavu Geologickeho, 55, 85–92. Myers N, Mittermeier RA, Mittermeier CG, da Fonseca GAB, Kent J (2000) Biodiversity hotspots for conservation priorities. Nature, 403, 853–858. Omland KE (1999) The assumptions and challenges of ancestral state reconstructions. Systematic Biology, 48, 604–611. Potts R (1996) Evolution and climate variability. Science, 273, 922 – 923. Raxworthy CJ, Forstner MRJ, Nussbaum RA (2002) Chameleon radiation by oceanic dispersal. Nature, 415, 784–787. Ronquist F (1996) DIVA version 1.1. Computer program and manual available by anonymous FTP from Uppsala University (ftp.uu.se or ftp.systbot.uu.se). Ronquist F (1997) Dispersal-vicariance analysis: a new approach to the quantification of historical biogeography. Systematic Biology, 46, 195–203. Scott L (1995) Pollen evidence for vegetational and climatic change in Southern Africa during the Neogene and Quaternary. In: Paleoclimate and Evolution, with Emphasis on Human Origins (eds Vrba ES, Denton GH, Partridge TC, Burckle LH), pp. 65 – 67. Yale University Press, New Haven, Connecticut. Swofford DL (2002) PAUP* Phylogeny Analysis Using Parsimony (*and Other Methods), version 4.0b10. Sinauer Associates, Sutherland, Massachusetts. Thorne JL, Kishino H (2002) Divergence time and evolutionary rate estimation with multilocus data. Systematic Biology, 51, 689 –702. Thorne JL, Kishino H, Painter IS (1998) Estimating the rate of evolution of the rate of molecular evolution. Molecular Biology and Evolution, 15, 1647–1657. Tolley KA, Burger M (2004a) Distribution of Bradypodion taeniabronchum (Smith, 1831) and other dwarf chameleons in the eastern Cape Floristic Region of South Africa. African Journal of Herpetology, 53, 123–133. Tolley KA, Burger M (2004b) Geographical distribution Bradypodion gutturale (A. Smith 1849). African Herp News, 37, 29 – 32. Tolley KA, Tilbury CR, Branch WR, Matthee CA (2004) Evolutionary history and phylogenetics of the southern African dwarf chameleons, Bradypodion. Molecular Phylogenetics and Evolution, 30, 354–365. Vitt LJ, Caldwell JP, Zani PA, Titus T (1997) The role of habitat shift in the evolution of lizard morphology: evidence from tropical Tropidurus. Proceedings of the National Academy of Sciences, USA, 94, 3828–3832. Vrba E (1995a) On the connections between paleoclimate and evolution. In: Paleoclimate and Evolution, with Emphasis on Human Origins (eds Vrba ES, Denton GH, Partridge TC, Burckle LH), pp. 24–45. Yale University Press, New Haven, Connecticut. Vrba E (1995b) The fossil record of African antelopes (Mammalia: Bovidae) in relation to human evolution and paleoclimate. In: Paleoclimate and Evolution, with Emphasis on Human Origins (eds Vrba ES, Denton GH, Partridge TC, Burckle LH), pp. 385 – 424. Yale University Press, New Haven, Connecticut. © 2006 Blackwell Publishing Ltd, Molecular Ecology, 15, 781– 793
D W A R F C H A M E L E O N P H Y L O G E O G R A P H Y 793 Vrba E (1999) Habitat theory in relation to the evolution in African Neogene biota and hominids. In: African Biogeography, Climate Change and Human Evolution (eds Bromage TG, Schrenk F), pp. 19–34. Oxford University Press, Oxford, UK. Yang Z (1997) paml: a program package for phylogenetic estimation from DNA sequences with variable rates over sites: approximate methods. Journal of Molecular Evolution, 39, 306– 314.
© 2006 Blackwell Publishing Ltd, Molecular Ecology, 15, 781–793
Krystal Tolley’s research focuses on investigating historical biogeography, taxonomy, and systematics of African herpetofauna, focusing on chameleons. Marius Burger and Andrew Turner are herpetologists interested in the conservation of African herpetofauna, and Conrad Matthee’s research focuses on the phylogeography and systematics of African fauna.