BIOELECTRONICAL NEURONAL NETWORKS Towards chemical analysis by coupling neurobiological entities to capacitive or capacitive-optical transducers
DISSERTATION
der Fakultät für Chemie und Pharmazie der Eberhard-Karls-Universität Tübingen zur Erlangung des Grades eines Doktors der Naturwissenschaften
1999 vorgelegt von
AXEL BLAU
Tag der mündlichen Prüfung:
4. August 1999
Dekan:
Prof. Dr. U. Nagel
1. Berichterstatterin:
PD Dr. Ch. Ziegler
2. Berichterstatter:
Prof. Dr. G. Gauglitz
In awe of nature and its marvelous secrets
ABSTRACT This thesis depicts the development of an autonomous in vitro recording system for neuronal cell cultures. It is intended to be used in analytical chemistry and sensorics as a transportable system independent from laboratory facilites. As the sensing entity, a neuronal network is cultured in a perfusion chamber mounted on a passive 60-electrodes multimicroelectrode array. The response behavior of that network to analytes will be recorded, amplified, and analyzed mathematically in the sub-millisecond range. Besides the portrayal of the mechanical and electronical design of a modular, temperature controlled perfusion chamber, of a life-maintaining support system, and of a 60-channel amplifier for signal recording, various secondary problems have been addressed and partly solved in this context. These include post-modification procedures of the recording electrodes with respect to the improvement of their electrical as well as adhesion mediating properties. Neuronal cultures from embryonic chicken may survive in the modular, temperature controlled perfusion chamber for up to three weeks. Their development and differentiation cannot be distinguished from cultures grown on cell culturing trays in CO2-incubators. Cell survival turned out to be strongly dependent on perfusion parameters. While a constant fastvolume flow (15 µl/hour, equivalent to approx. 1/5th of the total chamber volume) of fresh medium through the chamber stressed the cultures noticably, timed perfusion of about 30 µl once or twice a day kept the cultures viable. Longevity was limited rather by mechanical and electronical problems with the perfusion chamber and the controlling unit than by principle faults in the concept. A 60-channel amplifier in a sandwich configuration (32 + 28 channels) with very good noise and speed characteristics may amplify neuronal signals by a factor of 990 or 1551, respectively. However, for not yet understood reasons, the offset of that system is pulled to the lower supply potential of –5 V. The amplifier is connected to a high-speed (333 ksamples per second) data acquisition board with a total of 64 A/D-channels. A signal recording program in a virtual-instruments programming environment (Testpoint™ by Keithley Instruments, Inc.) has been developed. The electrical behavior of the recording (and stimulation) electrodes with respect to a high capacitance, a high charge delivery capacity, a low impedance, and biocompatibility, has been improved by electrochemical iridium deposition (and iridium oxide formation) onto platinum from an aqueous solution of H2IrCl6. It turned out that various iridium layers of different and decreasing stabilities with increasing thicknesses will form on the electrodes. To enhance mechanical stability of those deposits, iridium may be embedded in a polypyrrole matrix. The total impedance could be lowered by almost two orders of magnitude in the low frequency range below 1 kHz with respect to a plain platinum electrode while the increase of electrode capacitance by almost two orders of magnitude did not suffer from the matrix environment.
Neuronal cultures from embryonic chicken may be grown in serum-free medium and will survive in some cases for up to 6 months in a standard CO2-incubator. Cell development in serum-free medium lags noticably behind that of cells grown in medium that contains 10% (v/v) fetal bovine serum within the first two weeks. However, if the density of seeded cells surpasses a certain threshold (at least complete surface coverage of the substrate), cell networks grown in different media cannot be distinguished thereafter. New adhesion strategies on the base of electroactive phenol and pyrrole derivatives for the selective coverage of electrodes have been developed. Besides mimicking standard laminin related adhesion promoting procedures with the help of a peptide fragment from laminin (SRARKQAASIKVAVSADR) that is linked to an electroactive monomer (e.g. 3hydroxyphenylacetic acid), electropolymers of 2-(3-hydroxyphenyl)-ethanol and of 3hydroxybenzyl hydrazine have proven to promote cell adhesion (and neuron differentiation) in serum-free medium. Furthermore, it has been observed that laminin or a combination of laminin and polylysine will not promote cell adhesion and neuron differentiation in serumfree culture while they work perfectly well in medium with serum. This finding might hint at an indirect adhesion mechanism of laminin that depends on secondary 'mediating' factors found in the medium, while the adhesion promoting properties of polymeric films mentioned above might be based on a more direct cell-film interaction. As an alternative to capacitive-electrical electrode arrays with limited areal resolution, especially when studying signal spread, principle characteristics of a new capacitive optical recording array based on potential sensitive fluorescent dyes have been investigated. To circumvent common problems with membrane-bound potential sensitive dyes, the dyes will be trapped in a polymeric film on a suitable electrode material instead and thus stay in direct contact with the neurons. It could be shown that this strategy is working in principle by exhibiting voltage dependent fluorescence quenching. However, probably due to polymer thicknesses in the range of micrometers, the potentials necessary for generating noticable signals are still beyond capacitively detectable neuronal signals by almost four orders of magnitude.
TABLE OF CONTENTS ACKNOWLEDGMENTS
I
CONSTANTS
III
ABBREVIATIONS
IV
INTRODUCTION, CONTEXT, AND OBJECTIVES
1
Outline
1
Introduction
1
Context
2
Motivation
4
Objectives
4
FUNDAMENTALS IN NEUROBIOLOGY Biology of the nerve cell Description of the cell-electrode junction
EXPERIMENTAL METHODS AND STRATEGIES
7 7 26
29
Methods
29
Materials
41
Strategies
51
RESULTS AND DISCUSSION
70
Electrochemical iridium deposition from aqueous solution of H2IrCl6
70
Potential sensitive dyes: Preliminary results from a macro-model
80
Perfusion culturing chamber and live-maintaining controlling unit
87
Biocompatibility study of materials in contact with cells
94
Surface modification for promoted cell adhesion
95
Characterization of the cell networks
100
Amplifier for recording signals of low amplitudes
114
SUMMARY AND OUTLOOK
118
Summary
118
Outlook
119
APPENDIX
123
Protocols and procedures
123
Alternative devices for electropolymerization
135
Alternative cell culturing chambers
139
Circuit boards for photoreproduction
142
LITERATURE
147
I
ACKNOWLEDGMENTS I sincerely thank my two dissertation advisors for their invaluable support and guidance. Prof. Dr. Dr. h.c. mult. Wolfgang Göpel kindly offered to me this great and refreshingly interdisciplinary challenge and provided all necesseary support for this research project, extra lab space, and generous funding. I am also very grateful for having had the opportunity to get to know and use a multitude of techniques and apparatuses during the past three years thanks to the excellent infrastructure at his institute. His openness, his wits and kindness will always stay alive in my memory. With great interest, helpful advice and ample encouragement PD Dr. Christiane Ziegler guided and accompanied this work right from the beginning. I am very thankful to her for her unquestioned support, for her confidence in its success, and for always granting unconditional freedom in approaching and realizing the whole project. I was also very glad about her offer to assist the practical course for biochemist in physical chemistry for it became a welcomed and stimulating experience. Many thanks also to Prof. Dr. Günter Gauglitz for offering to be a referee and advisor in the defense of the thesis. I am also very indebted to many people who accompanied this work and contributed to its success in the one or other way. Special thanks are due to Prof. Dr. Guenter Gross and his crew, who taught me the fundamentals and tricks in cell culturing techniques and recording procedures, and whose enthusiasm set roots in my own work on this topic. In the same respect I would also like to thank Dr. Andreas Offenhäusser for sharing his experience in this field, especially for his encouraging and congenial simplistic and pragmatic, yet solid approaches and suggestions, which helped me a lot in finding the right solutions to many problems. I greatly appreciate the work of Christine Weinl, who devoted her diploma thesis on the details of the different adhesion strategies and facilitated the accomplishment of the inflationary manifold of those experiments. I am also indebted to Elke Nadler for taking all those wonderful SEM pictures and for performing the EDX measurements. Many thanks to the people from the mechanical workshop, especially to Johannes Seidel and Michael Jäger, for their skills and interest in giving shape to sometimes so minute and theoretical entities. Some of the adhesion strategies would have stayed mere theory without the skills of Dr. Stefan Kienle and Dr. Jürgen Mack in organic and peptide chemistry. Thanks to the two of them for providing us with modified laminin fragments, for promptly synthesizing the ManLev, and for their very patience regarding the outcome of their efforts. The realization of most of the electronic gadgets would have taken at least another century without the help and the experience of Dr. Gerd Noetzel and Andreas Krauß. I very much appreciate their often demanded and ingenious help in mastering electronics with its so endlessly many traps and peculiarities (for a chemist). Many thanks also to Christian Bauer, Dr. Ralph Burckardt, Michael Kaspar, Reiner Krapf, and Dr. Jan Rickert, with whom I shared the lab and office space, and to the present and past Ziegler-crew, to Thomas Ertl, Stefan Lach, Matthias Mondon, Eckhard Müller, Dr. Jochen Murr, Dr. Berthold Reusch, Dr. Ralph-Michael Rummel, Frank Rupp, Hartmut Stadler, Dirk Then, Aleksandar Vidic, and Christine Weinl. Their interest in this somewhat exotic work, their different opinions and perspectives, and the inspiring discussions helped so many times to reconsider the sheer endless possibilities, and to find the (hopefully) best approaches.
II
Thanks to Prof. Dr. Dieter Oelkrug and his coworkers for giving me the chance to use their fluorescence spectrometer. Thanks also to Prof. Dr. Rolf Gebhardt for providing his laboratory space and cell culturing infrastructure at the very beginning of the project. Many thanks also to Dr. Peter Heiduschka for teaching me some basics and first steps in laminin adhesion strategies. I am very thankful to Dr. Steve Potter for sharing his knowledge and thoughts that are based on many more years of experience in this field. I also appreciate the help of Frank Hofmann at the NMI who provided one of his slice cultures to test the performance of the amplifier. Thanks also to Dr. Marko Burghard for spreading LANGMUIR-BLODGETT films onto ITO-glass slides. Life is stuffed with daily obstacles. Therefore many thanks to Dr. Tilo Weiss, Mr. Egon Merz and Ms. Karin Vanesse for their quick and uncomplicated help in mastering those sometimes annoying distractions. Not to forget the computer crew with helping out so many times with network inconsistencies and other computer oddities. Thanks to all the people in our institute for their friendly, open, and helpful attitude, which made life and research a lot easier. Finally my very thanks to my parents for their continuous and unquestioned support in every respect. My life has also been made immeasurably better by my very friends. Thanks to all of them for their good company over all these years.
III
CONSTANTS Basic constants
R = NA·k
gas constant
F = NA·e
FARADAY constant
NA
AVOGADRO or LOSCHMIDT constant: # of particles per mol
e
elementary charge: charge of one electron
k
BOLTZMANN constant
T
Temperature
h
PLANCK constant
ε0
permittivity of the vacuum
8.31441 J·mol-1·K-1 m2·kg·s-2·mol-1·K-1 96484.56 C·mol-1 A·s·mol-1 6.022045·1023 mol-1 1.6021892·10-19 C A·s-1 1.380662·10-23 J·K-1 m2·kg·s-2·K-1 K 0°C = 273.16 K 6.62608·10-34 J·s m2·kg·s-1 8.854187817·10-12 F·m-1 C·V-1·m-1 C2·J-1·m-1
IV
ABBREVIATIONS Amino acids
One-letter code and three-letter notation [KOO 95 · MAL 98] codes
amino acid
molecular formula
FW
polarity
pKa*
G
Gly
glycine
C2H5NO2
75.1
+2.4
A
Ala
alanine
C3H7NO2
125.6
+1.9
V
Val
valine
C5H11NO2
117.2
+2.0
L
Leu
leucine
C6H13NO2
131.2
+2.3
I
Ile
isoleucine
C6H13NO2
131.2
+2.2
C
Cys
cysteine
C3H7NO2S
121.2
-1.2
M
Met
methionine
C5H11NO2S
149.2
-1.5
F
Phe
phenylalanine
C9H11NO2
165.2
-0.8
Y
Tyr
tyrosine
C9H11NO3
181.2
-6.1
W
Trp
tryptophane
C11H12N2O2
204.2
-5.9
P
Pro
proline
C5H9NO2
115.1
-6.0
S
Ser
serine
C3H7NO3
105.1
-5.1
T
Thr
threonine
C4H9NO3
119.1
-4.9
N Asn/Asx
asparagine
C4H8N2O3
132.1
-9.7
Q
Gln
glutamine
C5H10N2O3
146.1
-9.4
D
Asp
aspartic acid
C6H14N4O2
174.2
-11.0
4.0
E
Glu/Glx
glutamic acid
C5H9NO4
147.1
-10.2
4.3
H
His
histidine
C6H9N3O2
155.2
-10.3
6.0
K
Lys
lysine
C6H14N2O2
146.2
-15.0
10.8
R
Arg
arginine
C6H14N4O2
174.2
-20.0
12.5
8.3
10.1
*Note: The change in free enthalpie ∆G for the transfer of the side-chain from a rather non-polar solvent (ethanol) to a very polar solvent (water) is a measure for polarity of the side-chain. The more negative the value for ∆G the more polar is the side-chain.
V
Other abbreviations 2(3HPE)
2-(3-hydroxyphenyl)-ethanol
DMAP
4-dimethylaminopyridine
3HBA
3-hydroxybenzaldehyde
DMF
N,N'-dimethylformamide
3HBH
3-hydroxybenzylhydrazine
E
embryonic day
3HPA
3-hydroxyphenylacetic acid
EIS
electrochemical impedance spectroscopy
3PPA
3-(pyrrole-1-yl)-propionic acid
EP
electroplated
a
activity
ES
embryonic stem (cells)
AC / a.c.
alternating current
F
farad [F] = C·V-1 = s·Ω-1
ACA
ε-aminocapronic acid
FET
field effect transistor
ADP
adenosine diphosphate
FIA
flow injection analyser
AIROF
(anodically) activated iridium oxide formation
GB
gigabyte = 1·109 bytes = 8·109 bits
GC
gas chromatography
APS
active pixel sensors (CMOS-based digital camera chip)
HPLC
high performance liquid chromatography
ATG
β-alanine-tetraethylene glycole-glycine
HTS
high throughput screening
Hz
HERTZ [Hz] = s-1
I
current [I] = A
i
imaginary unit: i ≡ − 1 ≡ e
IC
integrated circuit
ID
inner diameter
IHP
inner HELHOLTZ plane
IME
interdigitated microstructured electrode
IS
impedance spectroscopy
ISA
industrial standard adaptor
ISFET
ion sensitive field effect transistor
ITO
indium-doped tin oxide
J
JOULE [J] = kg·m2·s-2
l
liter
L
inductance [L] = HENRY = V·s·A-1
LAPS
light addressable potentiometric sensor
LSD
lysergic acid diethylamide
M
molar concentration [M] = mol⋅l-1
m
meter
ATP
adenosine triphosphate
ATR-IR
attenuated total reflection infrared (spectroscopy)
BDNF
brain derived neurotrophic factor
C
electrical capacity [C] = F = C·V-1
CAM
cell adhesion molecule
CCD
charge coupled device
CDC
charge delivery capacity [CDC] = C·cm-2
CE
counter electrode
CMOS
complementary metal-oxide semiconductor
CNS
central nervous system
CNTF
ciliary neurotrophic factor
iπ 2
CoA
coenzyme A
CV
cyclovoltammetry
CVD
chemical vapor deposition
d
postnatal day
D
constant of diffusion [D] = cm2·s-1
Da
Dalton = MW
DC / d.c.
direct current
DCC
dicyclohexylcarbodiimide
m (as prefix)
milli (10-3)
Di I
DilC18(3) or 1,1'-dioctadecyl-3,3,3',3'tetramethylindocarbocyanine perchlorate
ManLev
N-laevulinic acid-D-mannosamide
dic
days in culture
MB
megabyte = 1·106 bytes = 8·106 bits
VI MEA
micro electrode array
RE
reference electrode
MEM
minimum essential medium
RH 421
MMEP
multi micro electrode plate
potential sensitive dye; N-(4-sulfobutyl)-4(4-(4-(dipentylamino)phenyl) butadienyl)pyridinium, inner salt
mol
mole: number of particles in a sample: 1 mole of a substance contains as many particles as there are atoms in exactly 12 grams of carbon (12C).
RIE
reactive ion etching
RIFS
reflectometric interference spectroscopy
s
second
S/N
signal-to-noise ratio
SCE
saturated calomel electrode (E0 = +0.242V @ 25°C)
SCIL
save charge injection limit = RCDC
SEM
scanning electron microscopy
SFM
scanning force microscopy
SFM
serum-free medium
SMD
surface mounted device
SOT23
small outline transistor: a standardized packaging size for CMOS devices
SP
sputtering / sputter deposition
T
absolute temperature [T] = K, 1 K = 1°C
THF
tetrahydrofuran
UV
ultra-violet radiation
V
volt [V] = J·C-1 = W·A-1 = kg·m2·s-3·A-1
VD
vapor deposition
VIS
visible light
WE
working electrode
XPS
X-ray photoelectron spectroscopy
z
valency of an ion
MOS
metal oxide semiconductor
MOSFET metal oxide semiconductor field effect transistor Mr
relative molar mass [Mr] = g⋅mol-1
MW (FW)
molecular weight [MW] = g⋅mol-1
n
nano (10-9)
NCAM
neuronal cell adhesion molecule
NGF
nerve growth factor
NHE
normal hydrogen electrode (E0 = +0.242V @ 25°C by definition)
OD
outer diameter
OHP
outer HELHOLTZ plane
opamp
operational amplifier
PC
personal computer
PCA
principle component analysis
PCR
principle component regression
PDL
poly-D-lysine
PEA
planar electrode array
PECVD
plasma enhanced chemical vapor deposition
PEG
poly-ethylene glycole
ZC
ractance of a capacitor
pH
potentia hydrogenii: -log [H+]
ZL
reactance of an inductance
PNS
peripheral nervous system
ZW
WARBURG impedance
PTFE
polytetrafluorethylene (Teflon™, Fluoron™)
ΒΑΕΕ
Nα-benzoyl-L-arginine ethyl ester
εr
relative electrical permittivity = relative dielectric constant
PVD
plasma vapor deposition
R
resistance [R] = Ω
ϕ
GALVANI potential
RAM
random access memory
µ
micro (10-6)
RCDC
reversible charge delivery capacity = RCIL = SCIL
ν
frequency [ν] = s-1
ω
angle velocity [w] = s-1
RCIL
reversible charge injection limit = SCIL = RCDC
Bioelectronical Neuronal Networks Towards chemical analysis by coupling neurobiological entities to capacitive or capacitive-optical transducers
Introduction, context, and objectives Outline In the context of a neurobionic approach to chemical analysis, this thesis depicts the development of a miniaturized autonomous perfusion chamber setup for the growth and the electrical as well as optical investigation of (neural) cell cultures in vitro, in this case of neural cell cultures from the dissociated brain of embryonic chicken between day 7 and day 10. Several related problems as well as various new strategies for the enhancement of the physico-electrical electrode features, the promotion of local cell adhesion, some tricks and traps with the technical realization of the perfusion chamber, especially its sealing as well as its temperature and nutrient flow control, and the development of a suitable amplifier unit for signal recording are discussed in some detail. Mathematical analysis algorithms are addressed only briefly for they are already partly presented in a preceding thesis by HARSCH [HAR 97A] and have not been applied to signals from the described cell cultures yet. At the end of the text, open issues of the presented system are discussed which require some more investigation and
1
optimization. In addition, suitable alternative signal recording approaches are sketched as a future prospect. The reader may find various additional ideas presented in the methodological sketches of the preceding theoretical paragraphs which have only partly or not been realized yet and therefore will not appear in the experimental sections of this work. They are only mentioned for the sake of completeness. Furthermore, the appended protocols are intended to serve as a cell culturing lab manual for non-biologists, who are not yet familiar with cell culturing techniques.
Introduction If our brain were simple enough to be understood, we would be too simple to understand it. (Saying) With the growing insight in long term effects of toxines and endocrine disruptors in waste waters and soil, the awareness of their impact on human health and child development has dramatically inreased, and with it demands for capable sensitive devices in pharmaceutical, medical, and environmental analysis.
INTRODUCTION, CONTEXT, AND OBJECTIVES
2
Chemical, electrochemical, optochemical as well as mass-sensitive sensor devices have been developed over the passed ten years. Some of them are already commercially available in various designs. Most of these systems are so mature that they can detect a single substance with an acceptable sensitivity. [PEN 97] Mixtures of different compounds can be recognized by using a parallel setup of different transducer principles and/or different transducer coatings (e.g. electonic nose), [DOD 91 · GÖP 94 · SWZ 95 · ULM 99] and separated afterwards by mathematical analysis (e.g. principal component analysis for linear problems, computational neural nets or (nonlinear) time series analysis for moredimensional correlations). Sometimes, limiting factors of those sensor systems are their still insufficient or non-uniform detection limits, their susceptibility towards reversible or irreversible disturbances, longterm drift phenomena, and the rather high expenditure to couple different sensor principles in order to characterize mixtures qualitatively as well as quantitatively with sufficient reproducibilities (e.g. quality control of aroma mixtures). In an alternative neurobionic approach, biocompatible electronic transducers with living neuronal cell cultures as sensitive entities can be imagined to supplement already existing non-biological analytical designs. For their evolutionary determined sensitivity (inherent biochemical amplification cascades) and selectivity (specific receptors), e.g. addressable electrogenic cell types (nerve cells, cardiac muscle cells, pancreatic β-cells) are suitable candidates to not only react to environmental changes with fast response times as well as high sensitivities but also to establish the transductional link to the post-processing
microelectronics, and to the mathematical analysis apparatus. Some of the mentioned limitations of conventional sensing and transduction principles will not be overcome, yet might not be that severe with self-adaptable or conditionable biotransductional devices.
Context As has been shown by various groups, cultured neural networks show complex signal patterns as a specific answer to external stimulation (in a similar way as it happens in the brain). [HAR 97A · GRO 97 · EGG 90 · MRT 93 · PIN 80 · REG 88 · WLK 92]
Neural cell cultures therefore seem to be the candidates of choice for the development of a hybrid bioelectrical sensor system. The scope of such a bioelectronic device reaches easily beyond the initially mentioned analytical detection and testing of toxicities of neurotoxins (from bacteria or fungus), herbicides, or heavy metals, towards •
studying fundamentals in learning processes, aging, and mental diseases (PARKINSON, ALZHEIMER) on a small and defined network,
•
drug discovery pharmacological neurologically complementary screening (HTS)
through screening of effects of active compounds to high throughput and to animal testing,
[FEN 96]
•
qualitative und quantitative detection and investigation of neuroactive compounds (neuropharmaceuticals, neurotransmitters, drugs, narcotics, ...) for basic (memory effects, addiction phenomena) as well as applied research and daily routine (customs, police, selfmedication, ...),
CONTEXT •
odor analysis in a co-culture with olfactory epithelium and olfactory bulb for quality control (e.g. foods, cosmetics, ...), and for medical diagnostics. [HOL 98]
With a little imagination, not only the electrical response of such neural cultures may be exploited as a sensor signal, but any other biochemical reaction as well. Therefore, various additional tests may be combined and implemented in a biohybrid sensor system, ranging from (local) pH-
3
shifts of the medium to changes in ionic or metabolic concentrations. [BRI 96A· BRI 96B] For orientation, table I (below) lists a few common detection principles for liquid analytes and allows a comparison of their detection limits. A more detailed comparative chart can be found in [RIC 97 · KAS 98].
methods
electrochemical
cyclic voltammetry [BRT 96] (IMEs) chronoamperometry [BDT 98] (IMEs, enzyme doped pastes) differential pulse voltammetry
< 100 nM 50 nM < 50 nM
impedance spectroscopy [SRG 96] (IMEs or nanostructured electrodes)
10 µM
electro-chemoluminescence [LIA 96 · JAM 96] (IMEs)
< 1 µM
ion selective field effect transistors (ISFET) [YAC 95]
1 µM
surface plasmon resonance (angle dependent) [KAR 95]
optical
detection limits
0.3 – 5.0 pg·mm
surface plasmon resonance (wavelength dependent) [HSR 95]
2 pg·mm
-2
attenuated total reflection [EDW 95]
5 pg·mm
-2
grating coupler (angle dependent) [LUK 95]
5 – 10 pg·mm
integrated optics [HEI 93]
some pg·mm
interferometry [FAT 93] reflectometric interference spectroscopy (RIFS) [BRE 94] fluorescence polarization [JOL 96]
-2
-2
1 – 5 pg·mm < 1 ng·ml
-2
-1
mechanical calorimetric
a few molecules
microcalorimeter [TAK 92 · LER 97]
< 10 nM
micromechanics (cantilevers) [BRG 96 · FLO 94]
ng to fg
bacterial cultures
yes/no
neuronal networks [HAR 97A]
20 nM
I Some detection principles and their detection limits for analyzing substances in solution.
-2
< 2 pg·mm
biological
fluorescence correlation spectroscopy [EIG 94]
-2
INTRODUCTION, CONTEXT, AND OBJECTIVES
4
Motivation Characterization of analytes with bioelectrical cellular networks in vitro
"In those regions of the brain in which we understand how the components of a mental process are represented, the logical operations performed by a group of neurons only become comprehensible when the flow of information through the interconnections of the network is specified. ... It is the connections between the many elements, not the contribution of individual components, which make complex information processing possible.“ [KSJ 91]
Analyzing mixtures of substances by means of transducer coupled biological entities, minimal changes in their chemical environment probably will be first amplified in the cells themselves and then mirrored in the recorded signals due to the naturally determined high sensitivity of receptive mechanisms in biology which has been optimized during a lengthy evolutionary process. Qualitative separation of single components from a mixture could be achieved by co-culturing different cell types (with different receptors) on the same transducer. Alternatively, different cell types could be cultured separately on the same type of transducer. Their varying response behavior to analyte mixtures of different composition could be used to discriminate different components and/or varying concentrations. As a requirement for the construction of neurobionic sensors, neuronal cells have to
be coupled to the (electrical) transducer in a defined, reproducible way with respect to an increase of the signal-to-noise ratio (S/N). Then, on the one hand, reproducible signal characteristics during the resting mode of the biological system have to be pinpointed or generated artificially (e.g. with the addition of synchronizing agents). On the other hand, characteristic deviations from those resting signals as a reaction to the addition of different analytes have to be detectable unambiguously. In this respect, effects of changes in parameters like pH and temperature have to be determined and separated carefully. As could be shown already in a preceding dissertation by HARSCH, [HAR 97A] neuronal networks in vitro are capable of distinctively detecting reproducibly different concentrations of model substances (e.g. strychnine). [GRO 97 · HAR 97B · ZIE 98A] This result will be used as a directive starting point for the proposed project.
Objectives Portable recording system for signal recording from cultured neuronal networks in vitro
Although the focus of this thesis is directed onto the realization of the biological and electro-mechanical setup of an autonomous neurobionic sensor system, the main intentions of such a device as well as the necessary requirements for the neurobionic detection of analytes are sketched briefly to define the context, to display the conditions under which the developed system will operate, and to indicate its prospective possibilities. Before looking onto primary, intentionally applied external influences onto the neural network (e.g. chemical stimulation for
OBJECTIVES chemical analysis and electrical stimulation for learning about signalling pathways), secondary effects have to be taken into account for optimal timing of experiments and correct data evaluation, which might for instance require a preceding calibration. Internal parameters of the cell network will not only determine longevity, but also count for variations in signal pattern and signal stability. Main parameters like local changes in pH due to metabolic activity, and changes in activity dictated to by the individual biological clock of the network will probably lead to a different response behavior of the network at different times. In addition to internal variables, more global, external factors like changes in temperature, shifts in global pH, and nutrient supply have to be considered for correct data interpretation as well. Characterization and standardization of signal patterns in cultured neural networks
Therefore the cell networks have to be characterized, and to be calibrated in advance with respect to the mentioned variations in internal and global external parameters. For that purpose, a data set of signal patterns has to be generated as a reference or background which might be substracted from pattern deviations originating from added analytes lateron (as it is common with other analytical methods as well). If calibration is not possible for too many unpredictable, biologically determined parameters, a standardization procedure has to be applied (e.g. by application of pattern synchronizing chemicals) in order to start with analytical signal recording from a defined, predictable origin.
5
Induction of stationary extracellular signal patterns
Results from GROSS et al. clearly show that neural networks can be settled in a defined state by means of neuroactive compounds like bicuculline or strychnine with a characteristic, reproducible pattern. The network can be veered from that ’state of mind‘ by external stimuli. [GRO 97 · HAR 97A] On the one hand, those stationary states, which in many cases resemble epileptic seizures, may serve as origins and as internal references for subsequent external, analyte related changes in signal pattern. On the other hand, the sensitivity of those excited networks may be attenuated for the extreme amount of overall stimuli. (It may be interpreted in analogy to the definition of the change in entropy, dS = dQrev/T: a small change in heat dQrev (applied stimulus) at low temperatures T (state of excitement of the network) will lead to a larger increase in entropy dS (a higher degree of excitation) than the same change in heat (same applied stimulus) at higher temperatures.) Signal recording from cultured neural networks in presence of different neuroactive chemicals
The neural network can be stimulated by means of neuroactive substances, or alternatively, with electrical pulses fed into the network through the electrodes of the microelectrode array (MEA). Exemplary network responses shall be studied and categorized with model substances such as the psychodysleptic lysergic acid diethylamide (LSD), and the herbicide atrazine. Due to the well known strong influence of LSD onto the central nervous system, the signal patterns should be characteristic and easily detectable. With the help of the collected data, the neural
6
networks may be characterized by means of a general model. Furthermore, general communication pathways may be revealed. Atrazine, as a substance with an unknown impact onto the central nervous system, shall be investigated to test the selectivity, and the resolution of the quantitative detection limits of the neural network in vitro in contrast and complementary to LSD. In addition a new realm of herbizide detection could be opened to predict the impact of those substances onto (mental) health and its related consequences. Determination of correlation factors by impedance spectroscopy
In addition to extacellular electrical signal recording, impedance spectroscopic detection of signals between separate electrodes and a reference electrode shall be performed for automatic drift correction due to reorganizational changes in the spatial arrangement of the cells themselves over time. On the one hand, this will allow a correlation of seal resistances (between the electrodes and the attached cell(s) and/or axon(s)) and the recorded signal amplitudes. Those correlation parameters may be used as weighing factors for the signals of the different electrodes with respect to normalization of the signals. On the other hand, this information may be exploited to find a trend in changing adhesion strengths of the cells to the underlying substrate as a function of time. Influence of generated memory effects
It can be anticipated that neural networks will be conditioned after a repetitive amount of the same stimulus which may be a specific substance or a whole class of
INTRODUCTION, CONTEXT, AND OBJECTIVES substances. On the one hand, this could lead to a disadvantageous loss of sensitivity to that certain stimulus (desensitization, adaption). On the other hand, one could also expect a desirable learning effect that might result in a stable, recurring, and typical response pattern for that stimulus (memory). One has to investigate the conditions which will lead to those memory effects, and how they influence the ability of the network to act as a sensor device. In this context, one also has to consider the impact of glial cells onto the learning process of the network. According to LURIJA, stimuli induced changes on a cellular level (like induced RNA-synthesis) will lead to short-term and long-term memory in neural as well as glial cells. [LUR 92] Cross-sensitivities
An important issue in sensorics is crosssensitivity towards similar substances as well as vulnerability of the sensor to contamination. On the one hand, it is of interest whether the response of the neural network will vary with a mixture of chemically similar or in its biological activity related analytes. On the other hand, the influence of simultaneously offered chemically or biologically unrelated substances on the stability and predictability of the signal pattern has to be determined as well. In this context, it will become clear whether a neural network is capable of selective analysis right from the start or rather dependent on a pretreatment of the sample (e.g. sample separation and/or purification by GC, HPLC or other preconditioning processes).
Fundamentals in neurobiology
Biology of the nerve cell [JAT 78 · DIA 85 · ADE 87 · REI 92 · NIC 95 · KSJ 96 ]
Elements of the vertebrate neuron
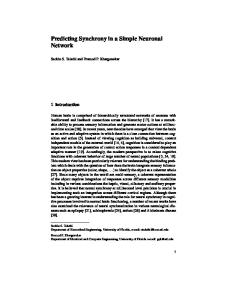
The human nervous system consists of about 1012 nerve cells. 10% of those cells are attributed to the central nervous system (CNS) which is the brain and the spinal cord (brain: approx. 100 billion nerve cells, cerebral cortex: 10-14 billion nerve cells). The remaining nerve cells constitute the peripheral nervous system (PNS), including the vegetative or autonomous nervous system. To our knowledge, the most important cells for the processing of information are the nerve or ganglia cells, also called neurons. They are the elements of the origin and of the conduction of electrical pulses. A neuron has four morphologically distinct regions: 1.) the cell body (soma) with a diameter of 10 to 50 µm and up, the center of of metabolism, containing the nucleus with
2
the genetic material and the smooth as well as the rough endoplasmatic reticulum; proteins are synthesized on its surface; 2.) up to 100 branched dendrites, which receive signals from other neurons through an average of 100 to 10 000 synapses (boutons); 3.) the axon (neurite) with a length of 0.1 mm up to 2 m. It is a tubelike appendix with a diameter of 0.2 to 20 µm, originating at the axon hillock, a specialized region of the soma. Through the axon, signals are sent to other neurons; 4.) up to 1000 presynaptic terminals at the usually branched axon endings which transfer the information onto the dendrites or the soma of other neurons or other target cells like muscle fibres, either chemically by means of neurotransmitters, or, less often, electrically through direct contact of the terminals with the target cell.
FUNDAMENTALS IN NEUROBIOLOGY
output zone
conductive zone
integrative zone
< 50 µm
local input zone
8
< 0.5 µm
< 2 mm
1 Schematic view of the morphology of a neuron and its functional regions. The cell body (soma) with several dendrites (apical and basal), which collect the incoming information from axons of other neurons, contains the genetic material and the organelles responsible for metabolic events. Depending on the stimulation by incoming information, which can either be excitatory or inhibitory, the cell may generate a signal by itself, originating at the axon hillock and travelling from thereon through the axon to the axon terminals with its synapses. There, they are either transformed into chemical signals, the neurotransmitters, or directly transferred onto the target cell(s) electrically. In case of chemical transmission, the neurotransmitters, which are stored in vesicles within the axon terminals, are expelled into the synaptic cleft through fusion of those vesicles with the cell membrane. The neurotransmitters can interact with receptors of the target cell and thus trigger a transduction pathway within that target cell. To avoid continuous stimulation of the target cell, enzymes within the synaptic cleft degrade and thereby inactivate the neurotransmitters after a certain time. Sometimes those fragments are resorbed either by the signalling cell or adjacent glial cells and are recycled to new neurotransmitter molecules. (Adapted from [KSJ 96].)
BIOLOGY OF THE NERVE CELL Glial cells
In addition to neurons (grey matter), glial cells (gr. glue) (white matter) can be found in the central nervous system which are also called neuroglia or just glia. They surround the soma and axons of the neurons and are metabolically coupled to neurons. [TSA 96] There are 10 to 50 times more glial cells in the central nervous system of vertebrates than neurons. They can be distinguished by their form and function. There are astroglia (astrocytes) and oligodendroglia with support and presumably feeding functionality for the neurons. Then there are microglia which act as mobile removers of cell debris under pathological conditions, and therefore are similar to macrophages. Astroglia extend processes towards blood capillaries and can act as morphological elements of the blood-brain barrier through the formation of tight junctions. Fascicular or fibrillar astrocytes with numerous thin processes are found predominantly in the white matter, protoplasmatic with fewer processes in the grey matter. Axons
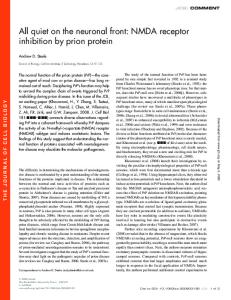
Neurites of several neurons may combine to nerve fibres. A white, 3 to 10 µm thick myelin sheath surrounds a single axon in (higher) vertebrates as an additional insulator towards the extracellular space. The signal transduction speed in myelinated axons reaches approx. 100 m·s-1 at 37°C, and is a 100-fold higher than in unmyelinated axons (e.g. giant axon of the squid). The axons of humans have a length between 0.1 mm and 2 m with diameters between 0.2 µm and 20 µm. In the CNS, the oligodendroglia form the myelin through proliferation of their cell membrane. One oligodendroglia cell can contribute to the myelination of an average of 15 different
9
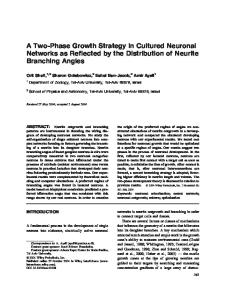
axons. The SCHWANN-cells are responsible for the myelination of axons in the PNS. However, only one of them wraps around a single axon at a length of 1 mm. Every axon is myelinated by several SCHWANN-cells.
3 Each oligodendrocyte is myelinating several axons in the CNS at the same time.
Nodes of RANVIER
Myelin sheath SCHWANN cell Nucleus Inner tongue Axon 4 In the PNS, SCHWANN-cells build up the myelin sheath. In contrast to the oligodendrocytes, each SCHWANN-cell is myelinating only one axon over a distance of about 1 mm. (Comparative sizes not to scale, both figures adapted from [KSJ 96])
Some classes of glial cells steer the migration of neurons during the development of the brain and direct axon growth by the secretion of nerve growth factors and nutrient metabolites. Glial cells also regulate the composition of the interand intracellular environment and keep constant the concentration of potassium ions in the extracellular space (spatial buffering). Some glial cells absorb the neurotransmitters which have been released at the synaptic transmission of the neurons.
10
The relative size of a neuron can be visualized with the example of a motor neuron from the anterior root of the spinal cord; its axon has a length of one meter: with a 100-fold magnification it would have a cell body with diameter of 1 cm, a dendridic tree with a spacial extension of 10 cm to 20 cm, and an axon with a length of 100 m and a diameter of 1 mm. During the development of the nervous system, the neurons grow first, followed by myelination. While the amount of positive and negative charges at the membrane of the myelin cancel out, the outer membrane of the neuron carries a net negative charge, resulting from the gangliosides at the lipid layer and the glycoproteins at its surface. The myelin sheath of a single myelinated axon does not extent over the entire length of the axon but is interrupted by nodes of RANVIER in regular distances of 0.2 µm to 2 mm. At these myelin-free locations, the ion channels of the axon membrane are in contact to the extracellular space over a distance of 0.5 µm to 2 µm. There are approx. 20 sodium ion channels per µm2; therefore the Na+-channels are separated on the average by a distance of 220 nm. The nodes of RANVIER lead to a saltatory signal conduction mechanism (lat. salere, to jump) with high speeds. Synapses
At its end, the axon branches in piston-like swellings, the synapses, which dock onto the dendrites (axodendridic), or less often onto the cell body (axosomatic) or onto a different axon (axoaxonic) of a different neuron, only separated by the synaptic cleft with a width of 15 nm to 25 nm. The synapse is the location of signal transduction as well as signal integration. At the synapse, a signal may be amplified or weakened.
FUNDAMENTALS IN NEUROBIOLOGY With the exception of electrical synapses, where the electrical signal travels directly via gap junctions from one cell to the other without the involvement of any transmitter substances, in chemical synapses the electrical signal will be transformed into a chemical signal by the excretion of neurotransmitters from synaptic vesicles at the axon ending into the synaptic cleft. The neurotransmitters attach to receptors of the postsynaptic cells, thereby triggering a signal cascade in these target cells. This process is sensitive to pharmaceutical manipulation. On a spinal cord motor neuron, there are about 10 000 synapses, 2 000 of them attached directly to the cell body, the others to the dendrites. The dendridic tree of a PURKINJE cell in the cerebellum is much bigger, and the number of synapses is much higher there – up to 150 000. That way, a single neuron does not only receive signals from one other neuron but from thousands of different neurons. Although the genetic information of an animal is immense – approx. 100 000 genes for a vertebrate – it is not sufficient to specify all of the neuronal connections. Its number reaches 1014. The expansion of the neuronal network reaches 300 000 – 400 000 km, which corresponds to the distance of the earth to the moon. However, neurons do not connect indiscriminately forming random networks. Every neuron rather communicates with a specific postsynaptic target cell. Decisive for the formation of such controlled and exclusive connections are not only genetically determined factors (e.g. expression of certain receptors) but special extracellular signposts (e.g. growth factors) which become active in epigenetical processes at certain times during the development of the nervous system.
BIOLOGY OF THE NERVE CELL
11
5 Synapse and postsynaptic receptors: At a chemical synapse, messages are transmitted across a synaptic cleft by a chemical messenger, the neurotransmitter. When an electrical signal arrives at the presynaptic membrane of an axon terminal, synaptic vesicles release the neurotransmitter. The neurotransmitter then diffuses across the synaptic cleft (15 nm to 25 nm) and binds to a neurotransmitter receptor, triggering a conformational change in that receptor that allows an influx of cations into the postsynaptic cell. This influx causes a change in the electrical properties of the postsynaptic membrane. (Adapted from [RAW 89].)
Aspects of neuron metabolism
On the one hand, the weight of the brain of an adult counts with its approx. 1 300 g for only 2.5% of the entire body weight. One third of that weight results from the membranes of the oligodendroglia. On the other hand, 750 ml of blood perfuse the brain per minute which accounts for 15% of the total volume of 5 500 ml of blood circulating the body. In addition, the brain uses 20% to 25% of the inhaled oxygen in a resting person (3.3 ml oxygen per 100 g of brain matter per minute). Since the ratio of
brain-to-body weight in children under age four is higher than in adults, the oxygen consumption may rise up to 50%. Glucose accounts for the main nutrient for the correct functioning of the brain with an uptake of 9.8 mg per 100 ml of blood. Glucose is mainly transformed to carbon dioxide and in minor quantities to lactate and some pyruvate (approx. 1/6th of the lactate). Under normal conditions, 85% of the glucose are oxidized and only 15% show up as lactate. The brain uses approx. 120 µmol of oxygen per gram and hour and
FUNDAMENTALS IN NEUROBIOLOGY
12
extracts approx. 20 µmol glucose per gram and hour from the arterial bloodstream. The oxygen is used almost exclusively for the fixation of chemical energy in the respiration chain. That way, it produces 720 µmol of enriched phosphate (as adenosine triphosphate, ATP). The ATP-turnover of an average human brain therefore reaches 9 kg in 24 hours. Approx. 25% to 40% are used to stabilize the non-equilibrium state of the ionic concentrations over the neuronal cell membrane. From continuous starvation or diabetes, ketone bodies like D-3hydroxybutyrate and acetacetate are emerging in the blood as products of the fatty acid metabolism. However, those substances cannot sustain normal function of the brain in the absence of glucose. Paths of signal transmission
Functionally, the neuron may be devided into four entities with its corresponding types of signals according to the principle of dynamic polarization by RAMÓN Y CAJAL (compare figure 1): 1. Local input zone (receptive zone, consisting of certain proteins at the dendridic tree (mostly excitatory) or at the soma (mostly inhibitory); local, graduate receptor potential, a passively spreading input signal, variable in amplitude and duration, decreasing with increasing distance from the receptive surface) passive graduate
0.1 - 10 mV
5 - 100 ms
2. Integrative zone (origin of the impuls, trigger zone at the axon hillock; trigger signal)
3. Conductive zone (signal conduction zone, axon; conductive digital signal, often not present in local interneurons) active all-ornothing
70 - 110 mV
1 - 10 ms
0.1 mm - 2 m -1 → 100 m·s
4. Output zone (secretory zone at the synapses; graduate output signal with an amplitude as a function of the released neurotransmitter (whose amount is a function of the number and frequency of the action potentials), and with a duration as a function of the time of activity of the neurotransmitter); digitalto-analog signal conversion. passive graduate
0.1 -10 mV
5 ms - 20 min
20-40 nm cleft -1 → 4 – 8 µm·s
According to the principle of dynamic polarization, electrical signals always move from the receptive areas of the neuron (dendrites and soma) to the origin of the action potential at the axon hillock. From there, the action potential continues unidirectionally along the axon with a speed of 1 m·s-1 to 100 m·s-1 towards the presynaptic endings of the axon, where the neurotransmitter will be released from vesicles. Information transfer
If the potential of the extracellular space is set to zero by definition, the resting potential within the cytoplasm usually is about -65 mV, varying between -40 mV and -80 mV for different neurons. For triggering off the action potential, the stimulus current has to depolarize the resting potential above a certain threshold which in most cases lies 10 mV to 20 mV above (-55 mV to -45 mV). Sub-threshold stimuli do not trigger any event. This behavior is called the all-ornothing rule. To reach the threshold, the stimuli within the soma may simply add up, taking into account that inibitory stimuli
BIOLOGY OF THE NERVE CELL
13
transmitted information
physiological correlation
from inhibitory synapses have to be subtracted from excitatory stimuli. Superthreshold stimuli do not affect the amplitude, the duration or the shape of the triggered action potential which always stay constant (stereotypism); neither do prolonged threshold stimuli; they rather increase the number of triggered action potentials that run along the axon per time (frequency). The information of a transmitted signal therefore is not contained in the amplitude, the duration, or the shape of the action potential, but 1. in the neuronal pathway, along which the signal is transmitted coming from the brain (labeled line-coding), 2. in the target (types of neurons and receptors: excitatory or inhibitory), 3. in the number of potentials per time,
action
4. as well as in their temporal spacing. [WEH 96 · MLR 96]
The resting potential
The formation of the resting and action potentials result from the selective permeability of the cell membrane for different ions, and from the unequal local distribution of ions at the cytoplasmic side of the axon membrane and its extracellular side. On the one hand, the concentration of potassium cations (K+) within the axon is 400 mmol·l-1. Therefore, it is approximately fourty times higher than outside the axon (10 mmol·l-1). On the other hand, the concentration of sodium cations (Na+) is 460 mmol·l-1 in the extracellular space. Therefore, it is ten times higher than in the cytoplasm of the axon with a concentration of 50 mmol·l-1. In the resting state, the cell membrane is 25 times more permeable for potassium cations than it is for sodium cations, and rather impermeable for chloride and organic anions. Due to the laws of diffusion, the potassium cations travel through open potassium channels within the axon membrane along the potassium gradient from the cytoplasm with high concentrations of K+ towards the extracellular space on the outside of the axon.
FUNDAMENTALS IN NEUROBIOLOGY
14
6 Uneven distribution of ionic concentrations (in mM) in the axoplasm and the extracellular space. If those concentrations were inserted into the NERNST equation for concentration cells, the resulting potential would be about +130 mV at the inner side of the membrane. However, experimentally one finds values of –50 mV to -80 mV, with the inner side of the membrane being negatively charged. This can only be explained, if local countercharging processes directly at the membrane due to ionic currents through the membrane via ion channels are assumed. The same is true for the action potential: only a locally confined recharging of the membrane defines the action potential. There would be no action potential if that recharging phenomenon due to ionic currents through the membrane were immediately compensated by counter ions from the bulk. One approach to describe that situation is based on the assumption of a stationary nonequilibrium state that is goverened by a passive local diffusion of ions through specific ion channels in the membrane on the one hand, and by an active transport of ions into the counter direction by sodium-potassium pumps on the other hand. For mathematical simplification, the rates of those two opposing ionic currents are combined to a net diffusion rate that is expressed in terms of a certain permeability of the membrane for each different ion. (Adapted from [BOE 75].)
This causes sort of a momentary diffusion potential on the surface of the axon membrane, since there are not enough anions travelling with them, or sodium cations travelling into the counter direction towards the cytoplasm. As a result, the
kind of ion
cytoplasm = axoplasm [mM]
extracellular space [mM]
K+
124
2
Na+
10
145
Ca2+
5
2
Mg2+
14
1
total positive charge
134 + 2·19 = 172
147 + 2·3 = 153
Cl-
2
77
HCO3-
12
27
A-
74
13
other
(84)
(36)
total negative charge
172
153
II Ionic composition of intracellular and extracellular fluids (in the state of a resting neuron). Thereby, the concentration of one bivalent cation has to be compensated by twice the concentration of monovalent anions. The table does not name bi- or multivalent anions (e.g. proteins, ... ). Although the bulk solutions at both sides of the membrane are electrically neutral, ionic diffusion processes will charge the membrane locally. Only this local phenomenon leads to the final membrane potential that can be described by the GOLDMAN equation. It is discussed below. (Adapted from [REI 92].) Other textbooks quote different ionic distributions as done within the text section above, often neglecting electroneutrality.
extracellular surface of the cell membrane carries a net positive charge (for an excess of K+), whereas the cytoplasmic side of the membrane (axoplasm) has a net negative charge (for an excess of Cl- that outweighs the inflow of Na+). After a short while, the building up net potential counteracts the
BIOLOGY OF THE NERVE CELL
15
diffusional outflow of potassium cations and the diffusional inflow of sodium and chloride ions, respectively (due to the emerging electrostatic field). In other words, the two counterdirected driving forces will compensate each other: the magnitude of the local electrical field and that of the opposing concentration gradient will equilibrate for each ionic species. The effective net potential is called the resting potential. This transmembrane potential has been measured in the squid giant axon by CURTIS and COLE and by HODGKIN and HUXLEY in the late
n
RT ln Vm (t ) = V (t ) i − V (t ) o = 1⋅ F
∑ c =1 n
The GOLDMAN equation has been accepted as a general mathematical description of the membrane potential Vm at a specific moment t. It has been developed by GOLDMAN, HODGKIN, HUXLEY, and KATZ for the rest potential of the axon membrane, based on the assumption that the electric field strength in a thin membrane is constant and that the ion transport in the membrane can be described by the NERNST-PLANCK equation for electrodiffusion processes of ionic currents through a membrane.
z c ⋅ P(t ) c ⋅ [X c ]o +
∑z c =1
1930's. [ADE 87] Generally, it lies between -50 mV and -80 mV.
c
⋅ P (t ) c ⋅ [X c ]i +
for n different positively charged ionic (cationic:c) species X, and m different negatively charged ionic (anionic:a) species Y, with their respective valencies zc (> 0) or za (< 0), respectively, and their membrane permeabilities Pc or Pa at the time t of observation, respectively. i and o designate the location as within or outside of the axon, respectively, V is the potential, R is the gas constant, T is the absolute temperature, F is the FARADAY constant, and square brackets are indicating concentrations. The potential is time-dependent for the permeabilities which are changing drastically during an action potential as described below. The rest membrane potential cannot be derived from the NERNST equation for concentration cells with respect to the bulk concentrations, as might be assumed at first glance. As already sketched above, it rather results from the formation of a local space charge layer at the membrane due to
m
a
⋅ P(t ) a ⋅ [Ya ]i
a
⋅ P (t ) a ⋅ [Ya ]o
∑z a =1 m
∑z a =1
diffusion processes along a concentration gradient over the membrane of those ions for which the membrane is permeable, namely for K+, Na+, and Cl- (since, in first approximation, there are only ion channels for these ions). This diffusion process is slowed down by the formation of an electrical field due to a resulting charge separation. It will therefore be ceasing when those two driving forces are compensating each other. Then, the system has settled in a quasi-equilibrium state which is defined by the fact that the electrochemical potentials µ~ j for each of the mentioned ionic species j, namely K+, Na+, and Cl-, are equal at both sides of the membrane, and that there is no net flow of electric current across the membrane. As a result, the charge distribution right at the membrane is not equilibrated as it is in the surrounding bulk solution.
FUNDAMENTALS IN NEUROBIOLOGY
16
For potassium, this condition may be developed as µ K0 i+ + R ⋅ T ⋅ ln(a Ki + − da K + ) + z ⋅ F ⋅ ϕ i = µ K0 o+ + R ⋅ T ⋅ ln(a Ko + + da K + ) + z ⋅ F ⋅ ϕ o 7 A Charge distribution if all ionic channels are closed: There is electroneutrality at any location on either side of the membrane; B Charging of the membrane after opening of selective ion channels for potassium, sodium, + and chloride ions: K cations have passed through the membrane from the axoplasm (I or i) to the extracellular + space (II or o), while Na and Cl ions have diffused into opposite direction along their concentration gradients. As a result, a space charge layer has formed locally at either side of the membrane. It is positive at the extracellular side of the membrane (II) and negative at its axoplasmic side (I). The DONNAN description of membrane potentials is similar to this picture. [HAV 98]
In a more complex picture, the action of the sodium-potassium pump has to be taken into account as well. But its only effect is a subtle shift of the ionic concentration gradients of Na+ and K+, respectively. This systematic deviation may be incorporated into the mathematical expressions for the permeabilities of the membrane for those two cations. The derivation of the GOLDMAN equation is very incoherent and confusing in many standard textbooks. It is therefore attempted to derive it conclusively with the help of two simple assumptions: 1. Only those ions will contribute to the resting (or to the action) potential that may pass through specific ion channels at the time of observation. 2. At the time of observation, the 'system' is at quasi-equilibrium. On the one hand, it means that the electrochemical potential µ~ j for each ionic species j is equal at both sides of the membrane. µ~ ij = µ~ oj
In this equation, µ K0i+ = µ K0 o+ with µ K0 + being the chemical potential of the potassium cations at a standard state. Furthermore, aK+ is the bulk activity of potassium ions, daK+ is its change due to their outward diffusion through the membrane, ϕ is the GALVANI potential, z is the valency (z = 1 for K+), R is the gas constant, T is the absolute temperature, F is the FARADAY constant, and i and o designate the intracellular (axoplasm) and the extracellular space, respectively. On the other hand, no net electric current will flow across the membrane. This may be expressed in terms of the fluxes of ionic currents across the membrane. The flux JK+ of outward bound charges associated with the diffusion of K+ from the axoplasm to the extracellular space is compensated by the inward fluxes JNa+ and JCl- of Na+ and Cl-, respectively. This net current of zero is expressed as J K + − J Na + + J Cl − = 0 .
The signs will make sense if one considers that the inward flow of positive charges (with Na+) is counterdirected to the outflow of positive charges (with K+), the latter being regarded as the 'reference' direction of flow in this discussion. Since the flow of chloride ions is inward-bound as well, but the carried charge is negative in that case, its resulting sign is positive. (To visualize the directions, please refer to figure 7B.) A flow Jj of a component j
BIOLOGY OF THE NERVE CELL has the dimension of mol·m-2·s-1. In this case, one can write Jj =
da j dt
⋅ δ = da j ⋅ Pj ,
If the equations for electrochemical equilibrium are solved for daj for each ionic species j, the result will be
da Na + =
da Cl − =
a Ki + ⋅ e Ξ − a Ko + 1 + eΞ o i ⋅ eΞ a Na + − a Na +
1 + eΞ Ξ o i − a Cl a Cl − ⋅e −
1 + eΞ
for potassium,
for sodium, and
for chloride,
with Ξ=
z ⋅F R ⋅T
o i PK + ⋅ a Ko + + PNa + ⋅ a Na + + P − ⋅a R ⋅T Cl Cl − ⋅ ln Vm = . o z ⋅F PK + ⋅ a Ki + + PNa + ⋅ a iNa + + PCl − ⋅ a Cl −
Voltage gated ion channels and the action potential
with daj once again being the change of the bulk activity of component j across the membrane during a time interval dt, and δ being the width of the membrane. The quotient δ/dt may be regarded as the permeability Pj of the membrane for the component j. This assumption is coherent with the original description of the permeability as found in [KAT 87]. (Note that Pj has the dimension of a velocity.)
da K + =
17
⋅ ∆ϕ ,
and with ∆ϕ = ϕ i − ϕ o ,
being the membrane potential Vm. Insertion of each of these three equations into the definition of the flux Jj, and solving the given relation for a net current of zero for Vm = ∆ϕ will give the GOLDMAN equation in the form of
At the instance of the stimulus, the axon membrane becomes 500 times more permeable for sodium cations for about one millisecond due to the stimulus-triggered opening of sodium channels. Sodium cations enter the axon along the inward directed sodium cation gradient like an avalanche. The number of entering cations is sufficient to countercharge the membrane during the rising slope of the action potential: the outer surface of the membrane temporarily becomes charged negatively, and the inner surface positively. Per millisecond, approx. 1 000 Na+ cations enter the axon through one of the 2·109 Na+ channels per cm2. This number is equivalent to 2·1012 Na+ cations per cm2 or 628 000 per node of RANVIER, respectively. The rising potential causes the closing of the sodium channels and the simultaneous opening of the potassium channels in the membrane. As a result, the inflow of sodium cations is stopped, whereas potassium cations start rushing towards the extracellular space, now driven not only by the osmotic gradient but also by the new potential gradient. The inversion of the membrane permeability for sodium and potassium cations finally leads to a decrease in the membrane potential which will even briefly become lower than the resting potential of -65 mV by approx. 10 mV (hyperpolarization). With restitution of the original potential gradient after a total duration of the action potential of approx. 1 ms to 4 ms, the neuron cannot be stimulated for a period of usually another millisecond (refractory period).
FUNDAMENTALS IN NEUROBIOLOGY
18
sodium equilibrium potential at +60 mV
membrane potential [mV]
depolarization
action potential
conductivity of open sodium channels
conductivity of open potassium channels
resting potential potassium equilibrium potential at - 85 mV hyperpolarization
4ms
0 2
8 Form of an action potential generated by voltage+ + dependent Na and K channels. The variation of membrane potential with time, as well as the number of
open channels per µm of membrane surface are shown for a given axon region (adapted from [NIC 95] after HODGKIN and HUXLEY, and HILLE).
One milliliter of the cerebral cortex has a membrane surface of approx. 10 m2. The amount of Na+ cations (4·10-9 mmol·cm-2 Na+ = 2.4·1012 Na+ cations), and the number of K+ cations (3·10-9 mmol·cm-2 K+ = 1.8·1012 K+ cations), which pass through one cm2 of that surface, are only a fraction of the total number of cations available of that sort. Therefore, several tenthousand action potentials can travel along an axon without running out of the driving gradient in cations. To reconstitute the non-equilibrium state in cation distribution between the inner
and outer space of the axon in the resting state of the neuron, sodium cations are pumped from the inside to the outside of the axon, and potassium cations from the outside into the axon. The so called sodiumpotassium pump is responsible for this active transport which consumes metabolic energy through the hydrolysis of the energy carrier adenosine triphosphate (ATP). The hydrolytic cleavage of ATP to ADP will result in a simultaneous net transport of three Na+ cations into the extracellular space and of two K+ cations back into the axon.
BIOLOGY OF THE NERVE CELL
19
+
Na
+
Na
Cl
Na
Na
+ ++ + ++
Cl
Na+
+
K+
+ + + + + + + + + + + + ++ + + + +++
+ ++ + ++
Na+ K+
K+ Cl
K+
Na+
ATP ADP + P
i
A
K+
K+
+ ++ + ++
K+
Na+ A
Na+
Cl
+
K+
K+ A
K+
extracellular side
Cm
+ +
g Na E
Na
+ _
g
EK
K
_ +
E Cl +
axoplasm = cytoplasmic side
g Cl
IK
INa
_ +
+
Na - K pump
9 Schematic representation of the axon membrane, e.g. at a node of RANVIER, which is selectively permeable to + + Na , K , and Cl , and its representation by an equivalent circuit. There are passive and active potassium channels, active sodium channels, passive chloride channels, and a + + Na -K pump. While potassium cations and chloride anions at any time are free to pass through the passive potassium and chloride channels, respectively, sodium cations will only enter the axoplasm after potential sensitive sodium channels have opened during an action
potential. In a description using equivalent circuits, the total conductance and the electromotive driving force for each ionic species are represented by a resistor with conductance g and a battery E whose potential represents the equilibrium potential for the ionic species. Cm is the capacitance of the membrane and is + + represented by a capacitor. A Na -K pump maintains the concentration gradients across the membrane and may be depicted as a battery charger. (Adapted from [KAN 91].)
Synaptic transmission
between the cells, or chemical synapses, characterized by the synaptic cleft (20 nm to 40 nm), which separates the two cells from each other. While electrical synapses allow an almost undelayed and synchronous signal transduction through ionic currents (electrotonic transmission), which usually has bidirectional character, chemical
Once the stereotypic electrical action potential has arrived at the synaptic terminal, it may either be transmitted to the adjacent target cell by electrical synapses with a cytoplasmatic, non-ion-selective gap junction (3.5 nm, with a pore size of 1.5 nm and a electrical conductivity of 100 pS)
FUNDAMENTALS IN NEUROBIOLOGY
20
synapses are unidirectional and much slower with a time frame of 0.3 ms to 5 ms or more. This synaptic delay is goverened by the release of neurotransmitters after fusion of synaptic vesicles with the synaptic membrane, the laws of diffusion of the transmitters through the synaptic cleft, their binding kinetics to the target receptors, and the correlated activation of ion channels. Electrical synapses usually connect some motoneurons to induce a fast behavioral response (escape, defense). The advantage of the more abundant chemical synapses is their ability to gradually amplify the incoming electrical signals chemically. Morphologically, neurons can be categorized in three major groups according to the number of neurites originating from the cell body: unipolar (a single primary, usually very branched neurite; one branch has the function of the axon, the other branches act as dendrites: nervous system of invertebrates, ganglia of the autonomous nervous system of vertebrates), bipolar (oval soma with two neurites, a dendrite and an axon: retina, olfactory epithelium, sensory neurons for touch, pressure, and pain (pseudo unipolar)), and multipolar neurons (with a single axon and several dendrites, which arise from all over the soma: predominantly in the nervous system of vertebrates).
into the nervous system, motor (efferent) neurons, transmitting orders to muscles and glands, and interneurons which represent the largest class of neurons, and which act as relais stations locally (local interneurons) or over larger distances (relais or projection interneurons). Besides the information transfer pathway, which is always passing the brain, there is a second category of spinal reflexes which are transmitted more or less locally through monosynaptic or polysynaptic neuronal circuits. They can be found in the spinal cord and control elementary reflex functions Neurotransmitters [MAL 98 · REI 92]
Neurotransmitter substances relay signals at chemical synapses. In a broader sense, every substance that is released at the synapses of a neuron and influences another nerve or effector cell in a specific way, can be considered as a transmitter. In order to qualify as a transmitter substance in a more narrow sense, however, a substance must satisfy several strict criteria. It should ·
be synthesized in the neuron;
·
be found in concentration at terminal;
·
have the same effect on a target cell when applied externally in physiologically appropriate concentrations;
·
be blocked in its action by the same pharmacological substances as block synaptic transmission;
·
be removed in a specific way from the extracellular synaptic space.
Types of neurons
The most important signalling functions of the brain – interpretation of sensory information, programming of motor and emotional reactions, learning and memory – are processed by interconnected groups of neurons. Functionally, neurons can be categorized into three groups as well: sensory (afferent) neurons feeding cognitive as well as motor-coordinative information
sufficiently high the presynaptic
BIOLOGY OF THE NERVE CELL Neurotransmitters are attributed to one of two classes due to their chemical and biochemical differences: ·
·
Charged, low molecular weight transmitters (acetylcholine, catechol amines, indolamines, imidazoles, and amino acids). They are products of relatively short biosynthesis pathways that in general are controlled by typical key enzymes. Those control enzymes are characteristic for one type of neuron and do not appear in others. Neuropeptides, consisting of short chains of approximately 2 to 50 amino acids. Currently about 100 neuroactive peptides are known. But the constant discovery of new neuropeptides suggests that there could be thousands. Neuropeptides can be grouped into more than ten families according to the similarities in their amino acid sequences. Several of these substances are known as hormones. If there is a continuous transition in the action of a neuroactive peptide as a hormone or as a transmitter, it is called a neuromodulatory peptide.
Although there are many chemically different neurotransmitters, their effect depends rather on the properties of the receptor they bind to than on the chemical structure of the transmitter itself. Some neurotransmitters can therefore act excitatory or/and inhibitory depending on the receptive mechanisms of the target cell.
21
Depending on the type of neurotransmitter, it is either produced locally in the synapses themselves (low molecular weight transmitters) or in membrane-bound polysomes of the cell body (neuropeptides). After several molecular post-processing steps, neuropeptides are incorporated into vesicles and must be transported from the cell body to the synaptic terminals, while low molecular weight transmitters are stored in vesicles directly in the synapses. After transmitters have bound to the receptors of the postsynaptic cell, there are three mechanisms to remove them from the synaptic cleft: by diffusion, by enzymatic degradation (in the cholinergic system) and/or by reabsorption into the synapse or adjacent glial cells. There, the fragments are recycled to form new neurotransmitter molecules. Besides these neurotransmitters, there are extra-corporal effectors which may act directly onto the nervous system, either by modifying signalling pathways, e.g. by competing with transmitters for receptor interaction, by modulating ion channels, by indirectly acting onto the hormonal system (endocrine disruptors), by [TOX 99] interfering with the cell metabolism, or by just destroying the cell.
FUNDAMENTALS IN NEUROBIOLOGY
22
cholines
base substance choline (from phosphatidylcholine
transmitter acetylcholine
biosynthesis control enzymes
antagonists
sphere of activity
choline-acetyltransferase (specific)
curare (nicotinic receptors), atropine (muscarinic receptors)
spinal motoneurons, postganglionic terminals of the vertebrate parasympathetic nervous system, nucleus caudatus, nucleus basalis
acetyl CoA biogenic amines dopamine
tyrosine hydroxylase (specific)
haloperidol, spiroperidol
corpus striatum, nucleus caudatus, (central and autonomic nervous systems of verebrates)
tyrosine
norepinephrine (noradrenaline; dopaminederivative)
tyrosine hydroxylase and dopamine-β-hydroxylase (specific)
ergotamin (α-receptors), propranolol, tropolones (β-receptors)
inferior brain stem, locus coeruleus, hypothalamus, substantia nigra, ganglion cells of the sympathetic nervous system, (central and autonomic nervous systems of verebrates)
epinephrine (adrenaline; dopaminederivative)
tyrosine-hydroxylase, dopamin-β-hydroxylase, and phenethanolamine-N-methyl transferase (specific)
imidazole indolamine
catecholamines
tyrosine
octopamine
invertebrate neurons
tyramine
invertebrate neurons
tryptophane
serotonine (5-hydroxytryptamine)
tryptophane-hydroxylase (specific)
histidine
histamine
histidine-decarboxylase (specificity uncertain)
methergoline
hypothalamus, nucleus caudatus, nuclei raphe
bicucullin, picrotoxine
spinal cord, cerebellum, cerebral cortex: inhibitory synapses
amino acids glutamic acid
γ-amino-butyric glutamate-decarboxylase (specificity very likely) acid (GABA)
glycine, serine glycine
common metabolism
strychnine
interneurons of the spinal cord, cerebellum(?)
glutamic acid, glutamate 2-oxoglutaric acid
common metabolism
unknown
excitatory synapses in the vertebrate CNS, neuromuscular synapses of anthropods
aspartic acid
aspartate
purine
ATP and adenosin ATP (adenosine triphosphate)
spinal ganglia, sympathic neurons with synapses to the vas deferens
adenosine
III Low molecular weight neurotransmitters found in the CNS of vertebrates, their base compounds, their pharmacological antagonists, and their spheres of activity in the nervous system, grouped by their chemical origin. [ADE 87 · KSJ 91]
BIOLOGY OF THE NERVE CELL
23
class
opioids
representatives
opiocortins, enkephalines, dynorphins, β-endorphin, FMRF-amide
neurohypophyseal vasopressin, oxytocin, neurophysin, prolactin, corticotropin (ACTH) growth
hormone (GH), liptropin, α-melanocyte stimulating hormone (α-MSH) tachykinins
sekretins
insulins somatostatins gastrins
substance P, physalaemin, kassinin, uperolein, eledoisin, bombesin, substance K (neurokinin A) secretin, glucagon, vasoactive intestinal peptide, growth hormone releasing factor, peptide histidine-isoleucineamide, gastric inhibitory peptide insulin, insulin-like growth factors I and II somatostatins, pancreatic polypeptide gastrin, cholecystokinin
IV Seven of the known families of neuroactive peptides [ADE 87 · KSJ 91]
category
chemical-warfare agents drugs of abuse environmental pollutants/pesticides experimental laboratory probes food additives/fragrances
examples
sarin (inhibition of acetylcholinesterase), tabun, phencyclidine ethanol (vitamin deficiency state), heroin, nitrous oxide carbon monoxide (hypoxia), lead, mercury, DDT, pyrethroids (Na+ channels) dinitrophenol, iodoacetate, pyrithiamine monosodium glutamate, dinitromethoxybutyltoluene
industrial/occupational agents ethylene oxide, barium (hypokalemia), n-hexane, manganese,
cyanide (1 mg⋅kg-1), iodoacetate (inhibition of axonal transport), β'iminodipropionitrile (IDPN, inhibition of axonal transport) natural toxins
pharmaceuticals
ciguatoxin (algae), veratrum alkaloids, gossypol, saxitonin (dinoflagellates in mussels), tetanospasmin, tetrodotoxin (puffer fish, Na+ channels, 10-100 ng⋅ml-1), batrachotoxin (south american frog, Na+ channels), α-bungarotoxin (acetylcholine receptors), tetanus toxin (blocking of axosomatic inhibitory inputs), diphtheria toxin (SCHWANN cells: arresting protein synthesis), black widow spider venom (massive release of neurotransmitter), botulinum toxin (impairing release of acetylcholine) antimicrobial, oncolytic, psychiatric drugs
V Types of neurotoxic agents and some representative examples [JAT 78 · ADE 87 · KSJ 91 · KSJ 96 ]
24
Cell adhesion and directed growth of neurites [RUT 88 · RUT 93 · MTI 94 · NIC 95 · HVN 96 · KSJ 96 · MRN 96 · NIE 96 · SON 98 · HIC 99]
Various types of signals determine the identity of a cell, its final location, its differentiation, and its functional properties. For the development of a neuron in the cortex, above all its ’birthday‘, determined by the last division of a neuroblast, the predecessor cell, to a postmitotic neuron, most likely determines the final location and identity of the neuron. The selection mechanism has not been identified though. It might be a temporary chemical switch provided by the environment around the neuroblast and being present only at the time of final cell division. Chemical signals coming from neighboring cells during wandering and at later developmental stages of the postmitotic neuron are responsible mostly for its guidance and its final differentiation, which includes axon growth and formation of synapses. However, the selection mechanisms and processes are not uniform in type and timing for all neurons. They strongly depend on the class of the neuron. For example, the destiny of a cell from the neural crest rather depends on the pathway during wandering as well as on its final location than on the ’birthday‘ of the cell. Some postmitotic neurons move along glial cells (radial glial cells) or orient themselves by extracellular matrix molecules (cell adhesion molecules, CAMs) or by chemical factors released from the target cells (chemotropism or chemotaxis). Many of the adhesion promoting molecules are glycoproteins, belonging to one of three main families: the immunoglobuline superfamily, the cadherines, with calcium-
FUNDAMENTALS IN NEUROBIOLOGY dependent N-cadherin being an important representative, and the multifunctional extracellular matrix glycoproteins laminin, fibronectin, tenascin (J1 or cytotactin), [FAI 97] and thrombospondin which interact among each other or with receptors of the integrine family. Each of the latter glycoproteins consists of two subunits that both determine the binding properties of the molecule. At a later developmental stage, during axon formation and axon growth, local guidance cues in the local environment of the axon will guide the axon to its target location. Apparently different molecular marker molecules, specific for each neuron or group of functionally related neurons, are responsible for the recognition and functional connection of the target (chemoaffinity hypothesis). Those directive interactions do not necessarily have to be supportive but can also be repellent. In addition, the so called neurotrophic factors play an important role for cell survival. If they are not present, postmitotic neurons will usually die by programmed cell death (apoptosis). Several neurotrophic factors have been identified, among them the nerve growth factor (NGF), the brainderived neurotrophic factor (BDNF), neurotrophin-3 and -4 (NT-3, NT-4), and the ciliary [EDS 96 · WAN 98] neurotrophic factor (CNTF), [BUL 96] each one promoting survival of separate groups of neurons. There are always new candidates being discovered constantly. [STF 98] At the final stage of development, synapses change their environment by the release of chemical modifiers as well. For example, with the innervation of muscle fibres, the number, the distribution, and finally the mobility as well as the electrical properties of acetylcholine receptors in the membrane
BIOLOGY OF THE NERVE CELL of the muscle fibers will change at the location of the synapse dramatically. Cell-cell and cell-substrate interaction of neurons with their environment in culture
In general, chemical as well as physical factors influence the adhesion of cells to their environment (which can either be the neighboring cell or an artificial substrate). Covalent coupling of cell filaments has not been observed yet. The general mechanism rather relies on key-lock mechanisms of biologically active substances, mentioned above, to receptors or receptor like structures via ionic and/or VAN-DER WAALS interactions. Ionic interaction also plays a key role in physisorption phenomena. The mainly negatively charged outer cell membrane (glycoproteins, integrines, ...) prefers to adhere to positively charged surfaces, whereas negatively charged surfaces lead to repulsion and therefore have anti-adhesive properties. (Cell-cell contact therefore is mediated trough linker substances, the glycoproteins, at positively charged anchor sites.) Furthermore, the geometrical properties of the surface influence the strength of the adhesion. While cells usually prefer smooth surfaces, they avoid rough structures.
25
Anchor proteins as natural adhesion promoting factors: Intercellular adhesion by laminin [ENG 81 · KLM 85 · MAR 87 · ENG 92 · MAL 98] cell membrane
collagen (with at least 12 different types)
extracellular matrix
anchor proteins: laminin fibronectin eleastin intracellular matrix
cell surface receptors (integrins)
proteoglycanes and hyaluronic acid
11 Various types of anchor proteins in the extracellular matrix mediate cell-cell adhesion. [KOO 94]
Besides other cell adhesion molecules like the neural cell adhesion molecule (NCAM), [ZAN 92] much attention has been directed to laminin in the literature. Laminin supports cell adhesion of almost all cells in the body and therefore can be found in all regions of the body. It is one of the first oligopeptides produced by the body during its development. Neurons recognize laminin by specific receptors, the integrins. With neurons, laminin does not only promote cell adhesion but also seems to trigger and/or promote cell differentiation events. [GRF 87] Laminin is a large heterotrimeric, multiadhesive protein consisting of three chain-like subunits, α (Mr: 400 000), β1 (Mr: 215 000), and β2 (Mr: 205 000) with two globular domains in each. They are arranged in a cross-shaped structure and are covalently linked via several disulfide bonds within the coiled-coil region (I and II). Different regions of laminin bind to cell-surface receptors and various matrix components.
FUNDAMENTALS IN NEUROBIOLOGY
26
Description of the cell-
α1 chain (400 kDa)
VI
electrode junction
NH2
V
CDPGYIGSR
PDSGR
IVb IIIb
IVa IIIa
β2 chain (205 kDa)
H2N
NH2
VI
V
IV
β1 chain (215 kDa)
III
III II
IV
V
VI
YFQRYLI
α
I RNIAEIIKDA
SRARKQAASIKVAVSADR
12 Schematic structure of laminin with its three functional subunits α1, β1, and β2, and the locations and sequences of adhesion promoting regions. [LOD 95]
Artificial adhesion promoting substances in culture
The well known and standard adhesion promoting substances poly-D/L-lysine and poly-D/L-ornithine (40 kDa to 70 kDa) owe their adhesion promoting properties not only to their net positive charge at physiological conditions but also to their tendency to absorb components from the media that contain serum. Those components may contribute, perhaps predominantly, to the improvement of cell attachment and growth. These findings have been [BAN 98] confirmed with poly-D-lysine and/or laminin treated surfaces in serum-free media and will be discussed in the results section in more detail.
A metal electrode will transform bioelectrical (ionic) currents into electrical currents or vice versa. This transformation includes an energy transfer by shifting ionic or electrical charges (positive holes or negative electrons) against an outer potential gradient. It can either be mediated through a capacitive coupling of the two systems without any effective charge transfer through the phase boundaries between ’liveware‘ and hardware, or by FARADAIC currents with a net charge transfer between the electrode and the biological entity, that is necessarily feeding a chemical redoxprocess at the junction. The mobility of electrons or holes in metallic conductors exceeds that of ionic charge carriers in solution by the order of 6 to 7. While electronic carriers have mobilities of about 103 cm2·s-1·V-1, that of ions may reach 3·10-3 cm2·s-1·V-1 at the most for the very special locomotion process of a proton (GROTTHUS mechanism). [ATK 90] In general, it is even lower by one order of magnitude for all other ions. The time constants of these two different charge carrier systems are separated by several orders of magnitude as well. Electrons may relay signals reliably up to several GHz, while processes at electronic-ionic phase boundaries are limited to speeds up to ten kHz (simply for the lack of faster bioelectrical signals). [KOV 95] If potential amplitudes at the interface are low, capacitive field effects without FARADAIC charge transfer will dominate. This situation is encountered when recording from neurons, and is referred to as smallsignal operation. In that mode, the electrodes behave as networks of linear
DESCRIPTION OF THE CELL-ELECTRODE JUNCTION circuit elements. In case of effective electrical neurostimulation, usually signals with larger amplitudes are needed, which is called large-signal operation. In that case, FARADAIC charge transfer has to be taken into account. Therefore, non-linear currentvoltage characteristics will occur.
27 ·
Elements, that take diffusion controlled and/or diffusion limited processes from the bulk of the solution to the electrode into account, and which can be described by WARBURG-impedances.
·
The spreading resistance, as the net resistance encountered by a current spreading out from an electrode into a conductive solution. It is proportional to the specific resistance ρ of the solution, and to the geometrical surface area A of the electrode.
·
The shunt resistance in parallel to all other elements, to describe parasitic leakage currents into the solution from an insufficiently sealed electrode, e.g. if the cells or axons do not cover the entire electrode.
·
Any other parasitic elements, e.g. due to cross-talk of the on-chip conductors or components.
The junction between the electrode and the biological entity can be described by equivalent circuits. The following elements have to be considered: ·
·
The double layer capacity at the electrode-electrolyte junction (HELMHOLTZ double layer (< 10 nm), and in case of a distinct gap between electrode and cell, also the NERNSTIAN diffuse layer (< 30 nm)); its magnitude depends on the effective surface area of the electrode, on the protrusion of the surface into the solution, on the applied potential, and on the ionic concentration. The charge transfer resistance, resulting on the one hand from overpotentials at the electrode surface (charge transfer through the double layer, diffusion at the surface, crystallization, secondary reactions), and on the other hand from the polarizability of the electrode (material and texture dependent).
(For a better understanding of those elements, please refer to the methods section, where they are described in the context of impedance spectroscopy.)
FUNDAMENTALS IN NEUROBIOLOGY
28
Cd RΩ Cs
RΩ Cc
RΩ
Zp
ZW
Rs
Cp R ct
on-chip parasitics
electrode/solution interface
13 Adapted equivalent circuit for a microelectrode array after ROBINSON (1968) [ROB 68], KOVACS (1995)
[KOV 95] and LAMBRECHTS et al. (1992). [LBR 92] IHP is the inner HELMHOLTZ plane, OHP is the outer HELMHOLTZ plane, RΩ is the conductor resistance, Cp is the parasitic passivation capacitance, Cs is the parasitic substrate capacitance, Cc is the parasitic coupling capacitance, Rct is the charge transfer resistance, Zp is the pore or porosity impedance, Cd is the interface or double layer capacitance, ZW is the WARBURG impedance (diffusion controlled resistance to mass transfer), and Rs is the spreading or the uncompensated solution
resistance (due to STOKES and COULOMB forces that reduce the mobility of hydrated ions). If a neuron is found in the vicinity of the electrode, presumably the double layer capacitance Cd, the WARBURG impedance ZW, and the spreading resistance Rs are altered. In that case, Rs may be referred to as a shunt resistance. A shunt capacitance to ground due to a too close arrangement of electrodes towards each other has been neglected. Similar circuits were proposed by REGHER et al., [REG 88] GRATTAROLA et al., [GRA 93 · GRA 94 ·
BOV 95 and GRA 95B] EGGERS, [EGG 90] and GROSS. [GRO 79]
Experimental methods and strategies
3
Methods Overall view for orientation Modification techniques
The following table summarizes the envisioned experiments, some of the applied methods, as well as some complementing or alternative approaches (set in italics; some of the details can be found in the appendix). Electrode optimization
Surface modification for enhancing electrode characteristics with respect to high charge delivery capacities and biocompatibility
·
Electrochemical polymerization
·
Bubble jet deposition (max. lateral resolution with 1440dpi: 17.7 µm)
Adhesion mediators ·
Peptide fragments (epitopes) from laminin (and/or fibronectin, nerve growth factors, ...)
·
Hydrazine (like 3hydroxybenzylhydrazinedihydrochloride oder hydrazine covalently coupled to 3hydroxyphenylacetic acid (3HPA) in combination with membrane-bound keto derivatives of sialic acid (ManLev strategy).
·
Poly-D/L-lysine-like polymers
Modification techniques ·
Cyclovoltammetry (CV)
Verification ·
Cyclovoltammetry (CV)
·
Impedance spectroscopy (IS)
·
Scanning electron microscopy (SEM)
·
X-ray (XPS)
photoelectron
spectroscopy
Adhesion mediators
Surface modification for controlled cell growth and axon guidance, and for enhancing electrode characteristics with respect to high charge delivery capacities and biocompatibility
electrodeposited
Verification ·
Cyclovoltammetry (CV)
·
Impedance spectroscopy (IS)
·
Fluorescent antibodies
·
Scanning force microscopy (SFM) or α-stepper
·
Cell culture response, combined with impedance spectroscopy
stains,
fluorescent
EXPERIMENTAL METHODS AND STRATEGIES
30
respectively, with appropriate pre- and postamplifier units, and stimulator system (e.g. W. GOSNEY, L. HOWARD, SMU, U.S.A., 1996)
Cell culturing
Cell cultures in autonomous perfusion chambers which meet the following demands: ·
are chemically inert (glass or PTFE)
·
are temperature controlled (37°C)
·
provide automatic medium supply and medium exchange
·
will control the pH automatically with a constant stream of CO2 or alternative buffer systems (e.g. HEPES, phosphate); they may include a supplementary LED pH-control
·
·
medium conditioning with separate supply flasks containing neurons and glia cells. (empirical) control of osmolarity with regulated addition of H2O
·
High-speed CCD-array in combination with voltage-sensitive fluorescent membrane dyes (e.g. J. PINE, S. POTTER, Caltech, U.S.A., 1997)
·
High-speed photodiode arrays (e.g. M. ICHIKAWA, Japan, 1993)
Data analysis
Data extraction and data reduction with ·
multicomponent analysis/regression (PCA/PCR) [HER 96]
·
neural nets KOHONEN charts)
·
multi-dimensional feature extraction
·
time-series analysis
(backpropagation,
Experimental methods
Experiments
Cyclovoltammetry
Investigation of the network response to
[LBR 92 · HAM 92 · KIS 83 · KIS 96]
·
addition of sensitivities)
chemicals
(cross-
·
changes in pH
·
changes in temperature
·
light modulation
·
biorhythm [SCT 96]
·
selective or global electrical stimulation
Recording techniques
Tools for recording from neural networks and for selectively stimulating them electrically ·
60 to 64 channel MEA or MMEP (e.g. NMI, Germany, 1996; G. GROSS, CNNS, U.S.A., 1979; Panasonic, Japan, 1998),
The processes at an electrode in an electrolyte are very complex. A large variety of parameters influence the rate of the electrode reaction. One can distinguish electrode (material, surface area, geometry, surface condition), mass transfer (convection, diffusion, surface concentrations, adsorption), electrolyte (bulk concentration of electroactive species, pH, solvent, trace impurities), electrical (potential, current, charge), and external (temperature, pressure, time) variables. All these variables affect the electrode reaction. Voltammetry is the measurement of the current which flows between a working electrode and a counter or auxiliary electrode as a function of the potential applied to the working electrode. The
METHODS working electrode is the electrode where the reaction of interest takes place. As a result of a voltammetric experiment, the currentpotential curve, or voltammogram is recorded. These curves can be used for qualitative and quantitative determinations, and for thermodynamic and kinetic studies. If a triangular potential wave is applied to a working electrode, the resulting currentpotential curve is called a cyclovoltammogram (CV). Usually the CV shows a distinct hysteresis due to mostly inter-dependent but irreversible oxidationreduction processes at the electrodes during oxidative and reductive passes of the applied potential. The most simple setup for cyclovoltammetry is a two-electrode arrangement as depicted in figure 14, consisting of a working electrode (WE) and a counter (CE) or auxiliary electrode (AE), respectively, which can be an inert electrode like a platinum sheet (primary kind), a Ag/AgCl or a calomel electrode (reacting electrodes,
31
secondary kind). While a potential ramp is applied to those two electrodes, the current is measured. However, the two-electrode system has several disadvantages. As the counter electrode carries current, the electrode will polarize and an overpotential will occur. Therefore, the real potential at the working electrode is unknown. Material consumption in the reference electrode is also a problem encountered in a twoelectrode system. For instance, if a compound is being reduced at the working electrode, silver will have to be oxidized to AgCl in an Ag/AgCl counter electrode. If all Ag in the counter electrode is consumed, the counter electrode will not function properly anymore and the potential at the working electrode will be unknown. Polarization and material consumption can be reduced or avoided by the use of a very large counter electrode and a small working electrode. In this way, the current density will be low enough to prevent polarization and early consumption of the counter electrode.
EXPERIMENTAL METHODS AND STRATEGIES
32
14 Two-electrode setup with working (WE) and counter electrode (CE). Electrode polarization and electrode consumption at the counter electrode will alter the applied potential in an uncontrollable way.
15 Circuit diagram of a potentiostat in a three-electrode arrangement. A repetitive triangular voltage pattern is fed into the positive input of the operational amplifier 0 (opamp), while the resting potential E of the reference electrode (RE) is fed into its negative input. At the output of the opamp, a potential, which is proportional to the voltage difference between the applied and the reference potential, is applied to the counter electrode (CE). Due to the high input impedances of the inputs, all current will flow through the electrolyte with a resistance RC to the working electrode (WE), and from there to ground. The current can be measured at the working electrode and profiled to the applied voltage in a cyclovoltammogram.
A better approach is the use of a threeelectrode setup in a potentiostatic configuration, as shown in figure 15. Beside the working and the counter electrode for current injection into the electrolyte, a reference electrode is introduced for controlling the potential without participation in any charge exchange. In a three-electrode voltammetric system, a potentiostat controls the current at the counter electrode as a funtion of the applied potential. This is realized in practice with an operational amplifier (opamp) with high input impedances (equivalent to the complex (or 'true') resistances). The desired potential is applied to the positive input of the opamp. The reference electrode with its distinct resting potential E0 (e.g. 0 E Ag/AgCl = 0.2224 V in water at 298 K) is connected to the negative input. The counter
electrode is connected to the output. The task of an opamp is to adjust the two applied potentials at its positive and negative inputs to reduce their difference to zero. For that purpose, the opamp ejects charges at its output proportionally to the potential difference at its inputs. The ejected charges have the same sign as the potential at the positive input. Usually there is a feedback loop from the output to the negative input. That way, the charges at the output can adjust the effective potential at the negative input, driving it thereby successively towards the applied potential at the positive input. If the feedback loop is missing (equivalent to an infinite feedback resistance, e.g. if the counter and the reference electrodes are not immersed into the electrolyte), the opamp would eject continuously an ’infinite‘ current at its
METHODS output, trying vainly to compensate the two input potentials. As soon as the two electrodes are connected by a current path, which in this case is the electrolyte, the feedback loop is closed as depicted in figure 15. Since the electrolytic resistance RA is almost identical to RB, the resulting amplification A = 1 + RA/RB of the opamp is almost equal to one (that is, no amplification). [TIE 93] Since the input impedances of the opamp are rather high (> 10 MΩ) in comparison to the resistances RA, RB, and RC of the electrolyte and that of the wiring, almost no charges will flow back through the reference electrode, but will be consumed by the working electrode, which is set to ground. That way, the potential difference between the two inputs of the opamp will never be compensated but stay constant at the applied voltage all time. The current is measured at the working electrode and is in principle identical to the current through the counter electrode if no parasitic current paths exist. The only parasitic portions in that arrangement are the ones that are always found in electrolytic setups: 1.) capacitive currents charging and discharging the counter electrode without participating in the redox-reaction at the working electrode (which in contrast is characterized by a charge transfer through the electrode-electrolyte phase boundary: FARADAIC current), 2.) adsorption effects of dissolved gases and trace impurities on the electrodes resulting in undesired electrochemical reactions (residual current), and 3.) diffusion potentials counteracting the applied potential due to unequal mobilities of the current-carrying ions in the electrolyte. For electrochemical analysis, only the FARADAIC current is of interest because it leads to the redox-conversion of the
33
electrochemically active species of interest. It can be shown that the limiting FARADAIC current is proportional to the concentration of the redox-active analyte in a stirred or non-stirred solution, respectively, where migration (movement of charged particles in an electrical field) and convection (movement of material due to densitiy fluctuations, e.g. by temperature gradients) have been excluded. Migration can be eliminated by an excess of an inert salt (dissipation of the electric field over all the ions in the solution and not exclusively over the electroactive species), convection by stirring. The solely remaining rate limiting diffusion, described by FICK’s laws of diffusion, is simply combined with the definition for the current, resulting in a differential equation. For stirred solutions (FICK’s first law of diffusion: stationary nonequilibrium state characterized by a linear concentration gradient in the NERNSTIAN diffuse layer), the so-called NERNSTIAN electrode condition can be described by the equation for the time-independent limiting current ilim ilim = n ⋅ F ⋅ D ⋅ A ⋅
c0 , δ
while for non-stirred solutions (FICK’s second law of diffusion), the time-dependent limiting current i(t)lim is described by the COTTRELL equation i (t ) lim =
n ⋅ F ⋅ D ⋅ A ⋅ c0
π ⋅t
.
In these equations, D is the diffusion coefficient, c0 the bulk concentration of the electroactive species of interest, F the FARADAY constant, A the (geometric) electrode area, n the number of negative charges being exchanged per redox-reaction, δ the stationary NERNSTIAN diffuse layer (approx. 30 nm), and t the time. Note: the
34
thickness of the NERNSTIAN diffuse layer will decrease with increasing the concentration of the electrolyte and with raising the
16 A reversible s-shaped steady-state voltammogram (right) with the corresponding concentration profiles (left) during an amperometric experiment. The concentration gradient stays constant over time (stationary nonequilibrium state) in a stirred solution after the deposition potential of the redox-active species has been surpassed, and after the current has reached a limiting plateau. The expansion of the NERNSTIAN diffuse layer with distance δ from the electrode surface is not affected by stirring and might be regarded constant over small changes in the applied potential. (Eo' is the equilibrium potential.) [LBR 92]
A cyclovoltammogram in a non-stirred analyte solution is showing typical peaks instead of limiting current plateaus or current drops proportional to t-1/2, simply because the redox-active species at the electrode surface encounter both situations described above. Initially, the process determined by the NERNSTIAN electrode condition predominates and the current increases with the potential in an s-shaped correlation. Thereafter, the concentration of the analyte has been depleted at the electrode surface and the diffusion layer expansion process becomes more important. The current decreases with t-1/2 from thereon.
EXPERIMENTAL METHODS AND STRATEGIES applied potential. In the diffuse layer, the electrostatic forces are strong enough to overcome the thermal agitation processes.
17 The concentration profiles (left) and the corresponding -1/2 currents (right) as a function of time (∝ t ), governed by the COTTRELL equation during an amperometric experiment in a non-stirred solution with progressive depletion of the bulk concentration c0 in the vicinity of the electrode over time. No stationary diffuse layer can be found in this case. [LBR 92]
In between, a typcial current peak is formed. Its shape depends on the scan-rate S (the slope) of the potential ramp. Again, the peak current ip is proportional to the bulk concentration c0 and can be calculated by [BRD 80]
i p = 0.4463 ⋅ n ⋅ F ⋅ D ⋅ A ⋅ c 0 ⋅
n⋅F ⋅ S R ⋅T
.
As an indication for a reversible redoxsystem, the current peaks of the oxidation in the oxidative sweep and that of the reduction in the reductive sweep are spearated by 59 mV.
METHODS
35
In general, the cyclovoltammogram is a superposition of three effects: firstly, the trapezoid current-voltage curve due to charging and discharging of electrochemical double layers, being of merely capacitive nature. Secondly, adsorption effects that contribute to the background or residual current and add to the capacitive current. Thirdly, the characteristic peaks resulting from FARADAIC redox-reactions at the electrode-electrolyte interface which might involve changes in the redox state of dissolved substances as well as of the
electrode material itself. The FARADAIC current is the current of interest in voltammetric analysis.
20 Exemplary cyclovoltammogram of a RuO2 electrode in non-stirred phosphate-buffered saline (PBS) with and 4without [Fe(CN)6] as the redox-active species. In an oxidative step (lower half of the curve, right to left), 43[Fe(CN)6] will be oxidized at 0.2 V to [Fe(CN)6] , with iron in the oxidation state +III. During the reverse +III reductive cycle (upper half of the curve, left to right), Fe +II is reduced to Fe at about 0.1 V again. Each peak in the CV is a superposition of the two voltammograms shown in figures 16 and 17: At first, in a NERNSTIAN-type electrode condition, the current rises in an s-shape curve until all of the analyte has been depleted at the electrode surface. Then, the time-governed decrease of the current is described by the COTTRELL equation. If no redox-active species is present (as in pure PBS), no charge transfer can occur. Therefore, no peaks will appear in the CV (dotted line). [LBR 92]
21 Exemplary cyclovoltammogram of a platinum electrode in 1 M H2SO4. Although no intentionally added electroactive species are present in the solution, a complex combination of peaks and plateaus is observed. The peaks are due to the oxidation and reduction of Pt at the surface of the electrode and to the inherent reactivity of this electrode material towards hydrogen oxidation and reduction. The shape of the CV is typical for a Pt electrode. [LBR 92]
Cyclovoltammograms are depicted throughout this text using the following conventions: The potential is decreasing from left to right. Oxidative currents have a negative sign, while reductive currents are positive. With this in mind, the oxidative cycle is running from right to left, whereas the reductive cycle is running from left to right.
36
In order to use a regular digital-to-analog (D/A) and analog-to-digital (A/D) computer card for driving the potentiostat, the measured current at the working electrode has to be converted to a potential. Since the measured current is usually very low, it is recommended to use a second opamp as a current-to-voltage converter combined with an adjustable amplification (determined by the resitance of the feedback-loop) instead of a simple resistor.
EXPERIMENTAL METHODS AND STRATEGIES characteristics depending on the kind of current that is used (direct current (DC, d.c.) or alternating current (AC, a.c.)). Classical electroanalytical methods use constant potentials (e.g. chronoamperometry) or alternating potentials with low frequencies and rather large amplitudes (e.g. cyclovoltammetry). They may be considered as DC methods. For those techniques, there is a linear correlation between the applied potential and the measured current, given by OHM´s law U =R⋅I .
[V]
In DC circuits, an inductance is behaving like a resistor after passing an initial period where the rising current lags behind the applied voltage. A capacitor is acting as a broken conductor after an initial charging interval where the climbing potential lags behind the charging current.
23 Extended circuit diagram of a potentiostat in a threeelectrode arrangement with a subsequent current-to voltage converter. The amplification of the measured signal depends on the choice of RRef. Since I1 = -I2 (KIRCHHOFF’s first law = point law), the measured voltage is Umeasured = -I1 · RRef. In a computer driven setup, a voltage pattern can be fed into the potentiostat by a D/A converter. The measured current, being transformed to a voltage by a current-to-voltage converter, can be read into the computer by an A/D converter. [KIS 96 · PAR 96]
Impedance Spectroscopy [HIB 76 · MIL 85 · MCD 87 · LBR 92 · END 93 and MCA 95]
The electronic behavior of every (electrochemical) system with phase boundaries may be modelled and understood by means of circuit elements like resistors, inductances, capacitors, or somewhat exotic diffusion-controlled quantities. Those circuit elements show different resistance
In AC circuits, however, inductances and capacitors show varying reactances that depend on the frequency of the applied current while the resistance of a resistor stays unaffected by the frequency. Therefore, a resistor is not capable of storing energy. It is rather dissipated as heat, electromagnetic radiation (light), or sound. With applying a potential to an inductance, the current rises only slowly to its peak value. Therefore, the current always lags behind the potential. The angle θ of that phase shift varies with the frequency of the AC current. With very high frequencies, it reaches its maximum with θ = 90°. Due to this characteristic, the inductance can store energy as a magnetic field. In contrast, in a capacitor the potential is rising slowly and lags behind the current because charges can accumulate on the plates with finite speed only. This negative
METHODS phase shift between potential and current is frequency-dependent as well. Its peak value of θ = -90° is reached at high frequencies. Because the charging time of a capacitor stays constant but charging and decharging periods decrease with increasing frequencies, the capacitor is acting as a short circuit at high frequencies. A capacitor is able to store energy as an electrical field.
24 Current response (dotted lines with lower amplitudes) to an applied potential (solid line) at high frequencies: resistor (current in phase with potential), inductor (potential +90° ahead of current), and capacitor (potential -90° behind of current).
The frequency-dependence of an inductor and that of a capacitor is a very valuable feature to characterize phase boundaries and to learn something about macroscopic system properties. It is made use of in impedance spectroscopy (IS), where a sinusoidal potential with low amplitude (< 10 mV) is applied to a system, thereby inducing a current-impeding, or currentopposing, reactance in the inductive or capacitive circuit elements. (Both solid and liquid electrochemical systems tend to show strong nonlinear behavior, especially in their interfacial response, when applied voltages or currents are large. But as long as the applied potential difference amplitude is less than the thermal voltage vT = RT/F, about 25 mV at 298 K, it can be shown that the basic differential equations which govern the response of the system become linear to an excellent approximation.) To guarantee the required stability of the applied potential, a
37
three-electrode setup as describe above, or an internal reference like a reversible redoxcouple may be used. IS may be used to investigate the dynamics of bound or mobile charges in the bulk or interfacial regions of any kind of solid or liquid material: ionic, semiconducting, mixed electronic-ionic, and even insulators (dielectrics). It can lead to estimates of microscopic parameters such as charge mobilities, concentrations, and electron transfer reaction rates. IS can predict aspects of the performance of chemical sensors and fuel cells, and it has been used extensively to investigate membrane behavior in living cells. Any intrinsic property that influences the conductivity of an electrode-materials system, or an external stimulus, can be studied by IS. It is thereby assumed that the properties of the electrode-material system are time-invariant. The disadvantages of IS are primarily associated with possible ambiguities in interpretation, for there are usually various different equivalent circuits with the same overall impedance at all frequencies which describe a physical system equally well. To find the appropriate description, sets of measurements with different conditions and physical intuition are needed. In addition, only average effects over the entire system can be observed, although resistance and capacitance contributions differ with electrode position and vary over a certain range around a mean. Experimentally, the frequency ν =
ω [s-1] 2 ⋅π
of the applied potential v(t) is varied over a wide range from 1 mHz to approx. 20 kHz, while the amplitude of the resulting current i(t) and its phase shift θ towards the applied voltage signal is measured (with the help of a frequency (shift) analyzer). That is,
EXPERIMENTAL METHODS AND STRATEGIES
38
v~ (t ) = v 0 ⋅ sin(ω ⋅ t ) and
[V]
~ i (t ) = io ⋅ sin(ω ⋅ t + θ ) ,
[Α]
with v0 and i0 being the initial or maximal voltage and current, respectively. The frequency-dependent reactance, that is, the total impedance Z(ω)tot of the system for alternating currents, is given by the ratio of the applied voltage and the measured current: v~ (t ) Z (ω ) tot = ~ . i (t )
[Ω]
The reciprocal of the impedance is known as the admittance. Impedance is by definition a complex vector quantity, Z (ω ) tot = Z ′ + i ⋅ Z "
[Ω]
= Z ⋅ cos(θ ) + i ⋅ Z ⋅ sin(θ ) = Z ⋅ e iθ = R + i ⋅ (Z L + Z C ) ,
with Z‘ as the real part and Z“ as the imaginary part, with i as the imaginary unit defined as i ≡ − 1 ≡
iπ e2
, and with the EULER
iθ
relation e = cos(θ ) + i sin(θ ) . ZL and ZC are the reactances of an inductor and that of a capacitor, respectively. It can be seen that the impedance is only real when θ = 0, that is, for purely resistive behavior. Resistance represents a conductive path, and a given resistor in the equivalent circuit might account for the bulk conductivity of the material or even the chemical step associated with an electrode reaction (reaction resistance). The reactance of a capacitor or that of an inductance has the same dimension as the resistance [Ω], but it differs from resistance in being dependent on the frequency ν of the
supply. The reactance Zc for a capacitor with capacitance C is ZC = −
1 1 , =− ⋅ ⋅ ⋅ ⋅ ⋅ i 2π ν C i ω ⋅C
[F]
The reactance ZL of an inductance L is Z L = i ⋅ 2 ⋅ π ⋅ν ⋅ L = i ⋅ ω ⋅ L .
[Ω]
Capacitances and inductances will generally be associated with space charge polarization regions and with specific adsorption and electrocrystalization processes at an electrode. In particular, a capacitor is often associated with the space charge diffuse double layer near the electrode surface. A more general expression for the reactance is given by Z X = A ⋅ (i ⋅ ω ) − n ,
[Ω]
with A being a semi-empirical variable, and n being a correlation factor with values between -1 and +1. For n = 1 and A = 1/C, the reactance is that of a capacitor. For 0 < n < -1, the reactance is called a constant phase element. It arises because microscopic material properties are often distributed. For example, the solid electrode-electrolyte interface on the microscopic level is not the often presumed smooth and uniform surface. It rather contains a large number of surface defects such as kinks, jags, and ledges, local charge inhomogeneities, two- and threephase regions, adsorbed species, and variations in composition and stoichiometry. For n = 0 and A = R, the reactance is the frequency-independent resistance. For n = 0.5 and A being a rather sophisticated constant, inversely dependent on the concentrations of the involved compounds and on the square roots of their diffusion constants, the reactance is called a WARBURG-impedance.
METHODS
39
Z W = (1 − i )⋅
A=
A
ω
, with
1 1 ⋅ + n ⋅ F ⋅ 2 c oxi ⋅D oxi c red ⋅D red R ⋅T
2
2
,
where R is the general gas constant 8.31451 [J·mol-1·K-1], T is the absolute temperature [K], n is the number of electrons involved in the redox-reaction, F is the FARADAYconstant 964853·104 [C·mol-1], D is the diffusion constant [cm2·s-1], and coxi and cred are the concentrations of the involved compounds in their oxidized or reduced state, respectively, [mol·l-1]. The WARBURG-impedance usually describes diffusion controlled mass transfer processes and might be envisioned as a kind of resistance to mass transfer. For a diffusioncontrolled FARADAIC reaction, the phase of the current is shifted 45° with respect to the applied potential in the WARBURG impedance. The WARBURG impedance can also be represented as a frequencydependent resistance RW = B/ω1/2 in series with a pseudo-capacitance CW = 1/(B·ω1/2), with B being an empirical constant. For n = -1 and A = L, the reactance is that of an inductance. If a reactance X and a resistance R are joined in series, the magnitude of the effective reactance of the combination, the impedance, is given by Z = R2 + X 2 ,
[Ω]
The impedance can be represented in different ways. The best known representation is the BODE plot: the absolute impedance of the electrode |Z| and the phase-angle θ are plotted as a function of frequency ν. In figure 25, a simulated BODE plot is shown for the given electrochemical circuit. All the components can be derived graphically from this representation. The same information can be derived from a NYQUIST representation or polar diagram of the impedance, in which the negative imaginary impedance is plotted. This format is also known as a COLE-COLE plot or a complex impedance plane diagram. The imaginary component of impedance is plotted versus the real component of impedance. The NYQUIST plot is of special benefit for more complicated systems, such as those that contain a WARBURG impedance or others that describe multiple membrane systems. In figure 26, a simulated NYQUIST plot is shown for the same circuit as in figure 25. It also depicts the effect of a WARBURG impedance in series with the charge transfer resistance (the so called RANDLES circuit; it is actually not part of the circuit under consideration). Under kinetic control (high frequencies) a half-circle is seen; under mass transfer control (low frequencies) the NYQUIST diagram is reduced to a 45° line. Without the WARBURG impedance, the semi-circle would touch the abscissa at low frequencies.
40
EXPERIMENTAL METHODS AND STRATEGIES
25 Simulated ac impedance measurement BODE plot of a simple RΩ(RctCd) circuit with RΩ = 50 Ω , as the OHMIC resistance of an electrolyte or a conductor, Rct = 950 Ω,
as the charge transfer resistance due to band structure anomalies at grain boundaries and to point defects in the bulk of the material, and Cd = 100 nF. [LBR 92]
26 NYQUIST representation of the same circuit as in figure 25. The negative imaginary part of the impedance is plotted versus its real part. A capacitance leads to a halfcircle in that representation. In the presence of an additional WARBURG impedance, the half-circle would convert to a line with a slope of 45° at low frequencies, where mass transport phenomena become dominant. The number of circles in such a plot is equivalent to the
number of capacitors that are connected in parallel. [LBR 92] As soon as a pure capacitance becomes a constant phase element due to electrical inhomogeneities of the material, the corresponding half-circle is turned clockwise by the matching phase shift deviation θ from 90°.
MATERIALS In an experimental three-electrode setup for impedance measurement, the electrodes are arranged in parallel towards each other in a sufficiently large distance to avoid the situation that the entire electrochemical cell will act as a capacitor. With the choice of a large counter electrode its contribution to the impedance may be neglected. In that case, the equivalent circuit can be simplified to a RANDLES circuit RΩ([RctZW]Cd) that neglects not only the geometrical capacitance of the facing electrodes but also the finite charging kinetics of the double layer capacitance as well as the geometry of the cell chamber. (Note: square brackets mean that the elements enclosed in the brackets are arranged in series. Elements enclosed in round brackets are arranged in parallel. In order to simplify the notation, brackets are omitted if the circuit starts with elements that are arranged in series.) Impedance spectra were recorded between 1 mHz and 100 kHz with a PARC EG&G 273 potentiostat/glavanostat in combination with an EG&G lock-in amplifier (model 5210), and the appropriate EG&G electrochemical impedance software (M398). Equivalent circuits were calculated with the program 'Equivalent Circuit V4.51', distributed by EG&G and developed by BOUKAMP at the University of Twente, the Netherlands. X-ray photoelectron spectroscopy
XPS was performed with a LH hemispherical analyzer (RQ10) and a Mg Kα source (1253.6 eV). A pass energy of 25 eV led to a resolution of 1 eV as determined from the full width at half maximum (FWHM) of the Ag 3d7/2 peak. The energy scale was calibrated by measuring clean foils of Ag, Au, and Cu.
41
Materials Choice of biological entities: Nerve cells from the brain of embryonic chicken (E7-E10)
Single neurons, like neurons from the cortex of embryonic mice, show very sensitive, but rather unpredictable and possibly nonspecific changes in their signalling pattern with the influence of neuroactive substances. However, neuronal networks react on external stimuli with a complex signal pattern as a result from the cell-to-cell communication with propagator and possible feedback mechanisms, which seems to be chaotic at first glance. Looking at it with appropriate mathematical methods (principal component analysis (PCA), [HEN 95] computational neural networks (e.g. KOHONEN charts, backpropagation), [MON 94] or time series analysis [AOK 87 · HAM 94 · HRV 95 · MOS 95 · LAM 98 · LAU 99]), substance-specific parameters may be extracted and separated from one another. In addition, the network may be settled in a defined oscillatory state after a specificly introduced chemical or electrical disturbance, which serves as a reference state with respect to subsequent chemical or biochemical stimuli (e.g. neurotransmitters, analytes). [CAE 89 · RHO 94 · HAR 97B · ZIE 98A]
Neurons from the brain of embryonic chicken (gallus domesticus) at embryonic day 7 to 10 (E7 to E10, hatching at day 21) [SMI 97] are suitable as an in vitro model system for cell adhesion studies and for optimizing the autonomous perfusion setup during its development. Chicken embryos younger than E7 are less easy to handle since their brains are still very small and difficult to extract. The developmental stage of embryos above E10 is already close to a
42
threshold level where cell viability suffers noticeably from the extraction procedure. From experience, E7 or E8 seem to be the best compromise: the brain can be separated from the surrounding tissue and the neurons do seem to be still quite undifferentiated in a way that allows them to recover with high probability from the extraction procedure and to differentiate vividly in culture. On the one hand, neurons from the chicken are not only relatively robust regarding temperature shifts to higher temperatures than 37°C (the body temperature of chicken is approx. 41°C to 45°C) [SIN 98] but also are rather easy to extract. In addition, incubating eggs is much less effort and less expensive than keeping mice and controlling the timing of their pregnancy. On the other hand, they are not a model system for vertebrates. Therefore, results from studies on the nervous system of the chicken have to be verified with mice before transferring any conclusions. Also, only few groups in this field are working with chicken. Therefore, the exchange of information is limited. Types of transducers for action potential recording
Microelectrodes which come in contact with biological entities have to meet the following demands: They have to be biocompatible which implies that on the long run they may not cause any tissue reactions; they have to be stable over extended periods of time and should not disintegrate chemically in physiological environments. Finally, their electronical properties should meet the experimental requirements. Regarding neurobionic sensor arrays for pure or mixed cell cultures, those demands may be expressed more explicitely:
EXPERIMENTAL METHODS AND STRATEGIES 1. Choice of biocompatible and physiologically stable substrates and electrodes. They should preferably be transparent for optical and microscopical investigation of the cell cultures (cell development and cell differentiation, cell movement, ...) 2. Choice of biocompatible electrode materials for capacitive signal recording and cell stimulation with ·
low impedances at frequencies which match the spike frequencies of the neurons between 1 Hz and 1 kHz for a high gain and signal-to-noise ratio;
·
high reversible charge injection to avoid secondary limits electrochemical processes like redoxreactions;
·
high transparency for an unobstracted view onto the location of interest, e.g. for evaluation of cell-electrode coupling;
·
a sufficiently dense distribution of electrode pads without electrical interference with adjacent pads.
There are several possibilities to record signals from electrogenic cells. Neither one is easy to set up. Each one has its advantages and flaws. Single neurons can be studied by means of the patch-clamp technique [FRO 93 · NEH 96 · DUB 97] or with metal needles. However, these methods are not suitable for long-term investigations of neural networks for their infliction of irreversible damage to the neuron and for the almost impossible realization of a parallel setup. For optical signal recording with calcium or potential sensitive fluorescent dyes, which are embedded into the cell membrane, a very fast and light sensitive camera is required to
MATERIALS investigate the signal spread. Usually, very high light intensities are necessary which in general, even in pulsed operation, will lead sooner or later to photobleaching of the dyes. Furthermore, the dyes, their metabolites, or their bleaching products are more or less toxic on a time scale of hours to days. [GRI 82 · GRI 88 · PRS 89 · ICH 93 · RSN 93 · ROH 94 · FRO 94 · POT 95 · POT 96 · SNS 96]
Optoelectrical transducer types like the light addressable potentiometric sensor (LAPS) still lack resolution and therefore may be used only for coarse grain investigations, like for heart muscle cells. [PAR 96 · PAR 97] A recent development of a new promising optoelectrical transducer will annihilate that restriction.[ NMI 99] Besides cuff, [LOE 77 · NAP 88 · WLT 95] sieve, [KOV 87 · AKI 91 · KOV 92 · KOV 94A · VAR 95 ·
or 3D [RTN 95] (multi-) electrodes, mainly for studies in the context of nerve regeneration, (multi-) microelectrode arrays are used by several groups for in vitro investigation and characterization of neuronal networks. On the one hand, these can be ’simple‘ conducting electrodes which are arranged on suitable substrates, both made from biocompatible materials. These systems do not provide any signal pre-processing capabilities.[GRO 79 · PIN 80 · PIN 87 · NOV 88 ·
MEY 95 · BLA 97 · THI 97]
COH 89 GRO 93 MAE 95 CAN 97
· CNO 90 · BOP 92 · CNO 92 · JIM 92 · · MRT 93 · KOU 94 · WLS 94 · GRO 95 · MOH 95 · HAI 95 · GRO 97 · HAR 97B · · KAM 97 · EGE 98 · MAH 98 · DEN 98]
The literature given is by far incomplete and should only be considered as a facet of the whole picture. A more extensive tabular comparison of the different systems may be found in the dissertations of MOHR [MOH 95] and HARSCH. [HAR 97A] On the other hand, there are systems with integrated circuitry on the base of metal-oxide semiconductor (MOS) technology, like ion sensitive field
43
effect transistors (ISFETs) or on the base of complementary metal-oxid semiconductor (CMOS) technology. [PAN 97] Those do not only detect the signals, but can already preamplify them. Metal-oxide semiconductor field effect transistor (MOSFET) structures are used by FROMHERZ [FRO 91B] et al. [JEN 97] and OFFENHÄUSSER [SPR 98] et al. [SCH 99] for direct signal amplification while reading from single neurons that act as the base of the FET. One disadvantage of capacitive microelectrode arrays is the limited space on the substrate which limits the number of individual electrodes. Because all electrodes need to be contacted externally, not the electrodes themselves will consume the available space but rather their signal leads to the external pads. Capacitive microelectrode arrays [HAE 94 · NIS 94 · JAN 95 · MOH 95 · EGE 98]
Titanium nitride (TiN) modified gold microelectrode arrays (MEAs) with Pyrex™-glass as the substrate and silicon nitride (Si3N4) as the insulation layer serve as transducer entities. They are manufactured by the NMI [NMI 99] and are commercially available through BOVEN & MÖLLER. [MCS 99] 60 circular gold electrodes (on titanium as the adhesion mediator) with total diameters of 10 µm to 30 µm each, with active diameters of 8 µm, and with interelectrode distances of 100 (or 200) µm, are arranged at the center of a 50 · 50 mm2 glass slide on an area of approx. 1 · 1 mm2. The width of the electrode leads is 10 µm at the electrodes. Electrodes and leads are placed onto the glass substrate by a sequence of 14 preparative steps, including photolithography, reactive ion etching (RIE), physical vapor deposition (PVD), and plasma enhanced chemical vapor deposition
44
(PECVD) for the formation of the silicon nitride insulation layer. The central part of each gold electrode as well as the contact pads at the outer edges of the array are uncovered by PECVD with fluoride ions from Freon™ gas plasma after inverted photolithography. The resulting hole has a diameter of a few micrometers. Finally the smooth gold electrodes are covered with a 1 µm thick, columnar titanium nitride layer by sputter deposition for increasing their capacitance by a factor of 10 to 20 (increase of the effective electrode surface area), and their reversible charge injection limit by a factor of 20 to 30 (material dependent). The nanostructure of such electrodes consists of densely packed microcolumns of fairly uniform diameters (about 0.1 µm) and homogeneous heights. Alternatively, the electrode surfaces can be roughened afterwards by electrochemical metal deposition (electroplating) from aqueous solution containing metal ions of platinum or iridium (H2PtCl6 or H2IrCl6). In most cases this will give fractal deposits of variable brittleness. [BLA 95] The electrode leads are very thin. This will not only impair inverse-microscopic vision slightly, but also leads to relatively high electrode impedances of about 80 kΩ to 300 kΩ. Nevertheless, in most cases all cells can visually be distinguished properly. With a non-inverted microscope, observation of cells is not a problem as long as a transparent cell chamber is used. However, the high impedances of the electrodes and their leads require amplifiers with high input impedances themselves.
EXPERIMENTAL METHODS AND STRATEGIES
27 Image of a MEA with 60 gold electrodes on glass and 2 an outer dimension of 50 x 50 mm .
Alternatively, totally transparent multi microelectrode plates (MMEPs) with the same outer dimensions, made from indium doped tin oxide (ITO) electrodes on glass, may be used. They are available from the research group of GROSS, Denton, Texas, U.S.A., [GRO 99] or from the medical branch of Panasonic LTD, Tokyo, Japan. [PSC 99] However, the arrangement of the electrodes as well as the one of the electrode pads differs from that of the MEAs. Therefore the MMEPs may not be used with the presented amplifier unit without a suitable, custom made adapter. Capacitive-optical electrode arrays based on potential sensitive dyes
As an alternative to capacitive-electrical microelectode arrays with a fixed number and a defined arrangement of electrodes, a new capacitive-optical electrode array with fluorescent potential sensitive dyes as the main transduction entities shall be sketched. Signals, as functions of a decay in fluorescence, will thereby be recorded optically by means of a high-speed CCD or APS camera. The very difference to conventional methods of recording from cultures stained with fluorescent dyes is the local separation of the dye from biology. Instead of staining the cell membranes of the neurons with a lipophilic dye, the dye is
MATERIALS
45
entrapped in a separate matrix that stays in electrical contact to the neuron. In the presented approach, most of the limitations of conventional microelectrode arrays as well as those of methods using potential sensitive dyes are overcome. [GRI 88 · ICH 93 · VRA 94 · POT 95 · POT 96] Furthermore, one can speak of a true parallel recording method in contrast to the recently presented and very promising capacitive-optoelectrical electrode array by NISCH et al. [NMI 99] In preliminary studies, the voltage-sensitive dye RH421 (Molecular Probes) has served as a model substance. [FLU 85 · MUE 86 · LOW 92 · BED 94 · GSS 94 · CLR 95]
General sketch of the transduction principle
A cell culture is grown on a (thin) insulating silicon or polymer grid (mesh 200 to 1000) whose interstices are filled electrochemically or mechanically with a well conducting and biocompatible material (ITO, iridium, iridium oxide, TiN, polypyrrole, ...). (If silicon is used, a membrane may be etched from top and bottom to form pyramide-like rectangular holes from either side. The resulting x-shaped profile of the holes will prevent the conductor filling to break away from the mesh.) possible shapes of interstices polymer mesh electrical conductor
etched silicon
dye matrix 28 Rounded or x-shaped edges of the interstices will prevent detachment of the grid filling.
This composite grid can be thought of as a pixel-matrix. Its surface may be modified chemically (globally) or electrochemically (globally or locally) to improve its electrical properties, its biocompatibility and/or its
adhesion mediating functionality. This grid will be called the culturing mesh. A second mesh is either covered globally on its one side with a thin (5 nm to 10 nm) potential sensitive (polymeric) film that contains the voltage sensitive dye. It may be a spread lipid (bilayer) membrane or a transparent polymer. Or, alternatively, the dye-containing solvent or polymer support may partly fill the interstices of the grid. That way, the pixels would stay separated from each other thereby preventing any cross-talk between them. This grid will be called the transduction mesh. The two grids are pressed together mechanically on their unmodified sides, thereby staying in direct electrical contact with each other. That way, the transduction mesh (dye electrode) may be exchanged at any time without disturbing the cell cultures on top of the culturing mesh. From below, a transparent but colored counter electrode (ITO) will be attached (permanently) to the bottom of the transduction mesh. It will serve as the counter electrode. The color has to be chosen as an optical low-pass or band-pass filter. It will let pass the fluorescent wavelength(s) of the excited dye through that colored glass in vertical direction only. Instead of using a colored counter electrode, the filter may also be a polymer foil adhering on its bottom side. The excitation wavelength of the dye is fed into the counter electrode with a high intensity flashlight (LED, xenon-lamp, ...) from its sides. It has to be coupled optically into the glass. On the bottom side of that sandwich arrangement, a high-speed digital camera is placed right under the cultures with or rather without any optics. In a best case scenario, the pixel area of each pixel of the camera would match that of the sandwich grids.
46
How does it work? The signal of a firing neuron on top of the culturing mesh will be conducted capacitively through the underlying pixel(s) to the pixel(s) of the transduction mesh. There it will, to a certain degree, quench the fluorescence intensity of
EXPERIMENTAL METHODS AND STRATEGIES the potential sensitive dye. The local change in intensity will be recorded by the camera. Instead of looking at the grid as a whole, only those areas or pixels may be chosen that are directly linked to (active) neurons.
29 Schematic representation of the capacitive-electrooptical signal transduction setup
General properties of high-speed potentialsensitive fluorescent dyes
The fluorescence wavelength of the potential-sensitive dye is a function of the external field, to which the dye is exposed to (electrochromic mechanism: shift of π− electrons), and of its orientation towards that field (reorientation/solvatochromic mechanism). [FRO 91A · CLR 95 · HAU96] In first approximation, it is not a function of the concentration of the dye, though. Furthermore, an aggregation of the dye molecules does not seem to influence the shift in fluorescence intensity. [CLR 95] The fluorescence intensity is a function of the intensity of the excitation, of temperature, of pH, and of the applied electrical field, which is the action potential and therefore of main interest. [LOE 92] The switching kinetics of high-speed potential sensitive dyes is in the
realm of nanoseconds. [HAU 96] The duration of an action potential is found within the order of milliseconds. The intensity of signals recorded with capacitive microelectrode arrays is located between a few µV up to 1 mV (with average geometrical electrode areas of approx. 100 µm2 and input impedances of about 30 kΩ to 500 kΩ). This is leading to an average surface charge of approx. 9.4·108 electrons on a 100 µm2 electrode. The electrical field over a 10 nm membrane of a neuron is approx. 5·106 V·m-1 for an average potential difference of 50 mV. [REI 92] A potential sensitive fluorescent dye, embedded into the cell membrane, is exposed to that field. The change in fluorescence intensity of potential sensitive dyes in such an environment due to a change in the electrical field is 2% to 10%, in rare
MATERIALS
47
cases even up to 20% (for RH421 in phospholipid vesicles), per 100 mV change in membrane potential. [GRI 83]
BLODGETT films, phospholipid membranes or vesicles ('frozen' in transparent polymers), or gelatine or argarose matrices.
Discussion of realizability
The yield in fluorescence could be increased tremendeously by means of acceptor fluorophores which act as photon traps. The fluorescence energy is transferred in a FÖRSTER-transfer mechanism to a second fluorescent molecule, whose yield in fluorescence is much higher than that of the potential sensitive dye. [VDM 94 · GIE 98]
It is still an open question whether the electrical field over the dye film, as a consequence of the change in membrane potential, will be sufficiently high to quench its field-dependent fluorescence intensity or shift the fluorescence maximum. One has to keep in mind that those changes in membrane-bound dyes are already only within the percent range. Futhermore, it is not clear which polymer or membrane environment is most suitable for embedding the dye. Since the mechanisms of fluorescence quenching are still hypotheses, the right material may be found empirically only. One could think of e.g. transparent (co-) polymers, LANGMUIR-
The following table compares the properties of a capacitive-optoelectrical device with the common practice of signal recording using potential sensitive dyes or capacitiveelectrical multimicroelectrode arrays, respectively.
Advantages vs. Disadvantages Comparison with regular multimicroelectrode-type arrays
· No mechanical or chemical micro structuring of the transducer surface
· No local electrical
would be necessary anymore, unless directed cell or axon growth is stimulation possible. desired. Active neurons or neuron patches could be selected and focused · Signal amplitude on with the CCD camera. may be much lower · Perhaps inexpensive and effortless transducer production. E.g. cost for than with direct potential sensitive dye per transducer when RH421 is used: 10 µM capacitive-electrical -1 methods. RH421 (MW ≈ 499) are equivalent to approx. 5 mg·l ; the price for 25 mg is approx. US$ 200, volume of dye per array: max. 1 ml, that is, · Perhaps more approx. 4 cent per array). difficult analysis of · The cost of the recording unit (camera, amplifier and computer) is
equivalent to that of a recording unit for multimicroelectrode arrays. With prospective major advances in digital picture technology, such a system might become much cheaper in the near future. · Signals are recorded and represented as pictures which will ease the
access and interpretation of the data with respect to network formation and signal spread.
signal shapes; may be circumvented with a ratiometric fluorescence shift at two wavelengths. [LOW 92 · GSS 94]
EXPERIMENTAL METHODS AND STRATEGIES
48
Comparison with the direct embedding of potential sensitive fluorescent dyes into the cell membrane of neurons
· Exchange of the transduction mesh with the embedded potential
sensitive dye without disturbing the culture. · No toxic influence onto the culture from dye molecules, from their
metabolic degradation, or from photodegraded dye molecules. · No background fluorescence due to dye diffusion into other organelles
· Lower fluorescence
intensity due to an attenuated electrical field, also resulting from leakage currents.
of the cell. · Choice
of optimal fluorescence parameters independent from physiological constraints (e.g. low pH, appropriate membrane environment, ...).
· Electrodes may be used for any electrogenic cell type (neurons, heart
muscle cells, pancreatic β-cells) independent from their membrane composition. · Use of other electrochromic compounds (inorganic or organic) instead
of potential sensitive dyes. •
VII Evaluation of a capacitive-optoelectrical transducer by comparison with capacitive-electrical electrode arrays and
with standard ways of dye application, respectively. Theoretically, such a system could very likely compete with 'traditional' methods of signal recording.
Electrodes for adhesion studies
Interdigitated electrode arrays as test substrates for cell adhesion studies
Two different types of electrodes have been used to evaluate adhesion strategies. For general adhesion related experiments and systematic studies of electrochemically generated adhesion promoting films, polymers from phenolic and pyrrolic origin are deposited onto interdigitated platinum electrodes on a sapphire substrate (electrode width of 100 µm; electrode spacing of 100 µm), and on indium tin oxide (ITO) covered glass plates.
30 Schematic representation of an interdigitated platinum electrode on sapphire substrate. The actual dimensions are 7 mm · 5 mm. The widths of the teeth of each electrode comb are 100 µm. They are separated from each other by an interelectrode distance of 100 µm as well.
The very advantage of the rather expensive interdigitated electrodes is the possibility to modify only one of the two electrodes. That way, the unmodified electrode serves as an internal refererence for evaluating the adhesion promoting properties of the
MATERIALS electrodeposited polymer on the other electrode. Indium-tin-oxide (ITO) covered glass plates as test substrates for cell adhesion studies
Alternatively, indium-tin-oxide (ITO) covered glass plates (Merck Balzers Ltd., 60±10 nm) have been used to study cell adhesion phenomena. ITO is not only used by GROSS and is commercially available through Panasonic. [PSC 99] It could also be shown that cell growth on ITO is comparable to that on glass. Covering the ITO surface partly with an adhesion promoting factor allows for comfortable comparative adhesion studies for its easy microscopic evaluation. Laboratory independent cell culturing system
To shield the cell cultures from experimentally non-relevant external influences in order to guarantee that all detectable changes in the response pattern of the cell cultures will originate from culture immanent factors or from intended external intervention, a miniaturized cell culture perfusion chamber is desirable that should be characterized by the following features: It should be mechanically stable and shielded from environmental contamination; it should be transparent for optical investigation, and be small enough to attach the amplifier unit to the electrode pads of the MEA; it should be possible to pump fresh medium through the chamber without capturing any contamination; the whole system should have small dimensions and be transportable
49
as one unit; it should not require any additional stationary support system like an incubator; the single parts of the chamber should be autoclavable and thus be reusable several times. The pH of the medium should be adjusted and stabilized before entering the chamber. This can be achieved either by constantly bubbling CO2 through the medium supply, or by using alternative chemical buffer systems (like N-2hydroxyethylpiperazin-N‘-2-ethansulfonic acid (HEPES), or phosphate). For correlating changes in signal patterns recorded from the cell cultures with small changes in pH, an optional optical pH sensor may be implemented. The device could control the flow of carbon dioxide by analyzing the changes in color of phenolphtalein, that is a component of most commercial media. As a future extension of the system, an automated flow injection analyser (FIA) could control the injection of analytes. [SOO 93 · RUZ 94 · HEU 97] Such a device would be a prerequisite for the development of a neuronal sensor system being independent from laboratory infrastructure. Various perfusion chambers have been developed already that are also commercially available. However, none of those systems are adaptable to the needs related to the use of microelectrode arrays. In general, they are specialized for mere microscopical investigation. Moreover, most of them have to be stored in a regular incubator for long-term investigations. [KRA 93 · BRI 96A · BRI 96B · MIN 96 · BRI 98]
EXPERIMENTAL METHODS AND STRATEGIES
50
medium supply and medium conditioning
perfusion chamber and data acquisition
31 Schematic view of the autonomous cell culturing system. The extended version of this setup includes pH buffering through a constant flow of 5% CO2 through the medium container with conditioned medium. Although, in general, the pH does adjust automatically according to the chemical equilibrium between carbon dioxide and sodium bicarbonate, it might be supervised optically with a diode controller. The osmolarity of the medium may be adjusted by a constant addition of water. The conditioned medium flask as well as the perfusion chamber are kept at physiological temperature by means of an electronical temperature controller. Fresh medium is transferred into the conditioned medium flask with the help of a separate peristaltic pump (not shown) or by gravity. From there it is injected into the perfusion chamber with a second peristaltic pump. At critical junctions, sterile syringe filters may be inserted into the flow to avoid contamination in
long term experiments. The analytes may be added with a syringe through the capillary inlets of the perfusion chamber. This task may be automated with an flow injection analyzer (FIA) system. The waste is collected through the capillary outlets of the chamber. Finally, the amplifier unit (not shown) is set on top of the microelectrode array (MEA) that is carrying the perfusion chamber. In a space saving version one might renounce on the CO2 supply as well as on the medium conditioning flask. Instead, a chemical buffer system like N-2hydroxyethylpiperazin-N‘-2-ethansulfonic acid (HEPES) or a phosphate buffer will keep the pH at physiological levels. Pre-conditioning the medium is not necessary with older cultures or cultures living on serum-containing media.
Data acquisition hard and software
voltage ramps or pulses have to be generated and fed into the potentiostat. At the same time, the analog current responses from the electrochemical cell have to be recorded after an electronic current-to-voltage conversion step, and have to be read in by the computer. That way, the electropolymerization can be observed and characterized by a cyclovoltammogram. In the latter case, the fast analog signals from the neural networks have to be recorded with high speed.
for electropolymerization and action potential recording
For controlling the potentiostat for electropolymerization of adhesion promoting substances as well as for recording the preamplified signals from neural networks on electrode arrays by means of a computer, a digital-to-analog (D/A) as well as analog-to-digital (A/D) signal converter is needed. In the first case,
STRATEGIES A/D-converter
Both demands are met by a computer interface board with D/A as well as A/D functionality. A 12-bit Keithley® A/D-D/A ISA card with 64 analog inputs, two analog outputs, and four digital inputs or eight digital outputs may acquire a total of 333 ksamples per second at its analog inputs. That scan-rate may be distributed arbitrarily onto any number of available channels. The gain can be set from 1 to 8 which corresponds to a recordable voltage range from ±10 V down to ±1.25 V. With gain settings above one, the total sampling rate drops to 250 ksamples per second, though. Analog signal patterns from -10 V to +10 V may be output with a speed of 2 ksamples per second. The power is limited to 150 mW. The four digital inputs or the eight digital outputs allow to control external relais or multiplexer units. Controlling software
Keithley Metrabyte® offers an object oriented virtual device software package, called Testpoint™, to control all of the company’s hardware. In its functionality, it may be compared to Labview™ by National Instruments® or to the very similar HPVee™ by Hewlett Packard®. There are other software companies which offer similar kinds of software to control third party hardware. The very difference of Testpoint™ to other virtual device software packages is its philosophy: Rather than connecting separate functional modules by graphical wiring, it uses a text-based connectivity borrowed by today's programming languages like Pascal or Java. Testpoint™ runs on PCs with Microsoft® Windows™ 3.1 or 95 installed on it. Although it is an interpreter mediated controlling software, today's computer performance is sufficient to fulfill fast data acquisition needs. The very
51
advantage of using Testpoint™ rather than regular programming languages is not only the fast and easy development of tailored programs without much programming knowledge but its flexibility regarding quick adaptation and extension of existing program modules. Some disadvantages though are its only fair and slow graphical display with only restricted zooming and adaption possibilities, and its feature of creating only interpreter mediated code rather than compiler generated low level executables.
Strategies Modification of physical and biochemical properties of the microelectrode arrays
The electrodes might be modified with respect to their electronical as well as their biological features. In the first case, the attention is directed onto the optimization of recording and stimulation parameters of the electrodes. They can be enhanced by a decrease of the electrode impedances, by an increase of their effective capacities, and an increase of their exchange current densities (ECD) as well as their save charge delivery capacities (SCDC). In the latter case, the optimization of the signal-to-noise ratio (S/N) as a function of the cell-electrode coupling is of interest. It may be increased by enhancing the biochemical properties of the substrate with respect to biocompatibility and, closely related to that, to cell-electrode adhesion strength. Physical electrode parameters of interest
The impedance of unmodified smooth MEAor MMEP-electrodes with 2 geometrical surface areas of 80 µm to 300 µm2 is about 1200 kΩ in physiological solution (culturing medium). [JAN 95] It is
52
resulting predominantly from the plain electrode-solution junction. Because signals from neurons can only be recorded capacitively with extracellular-type electrode designs, the electrode capacitance should be as high as possible. The impedance may be decreased by two strategies: Firstly, by roughening the surface to increase its effective surface A, thereby increasing its capacitance C simultaneously A ( C = ε 0 ε r , with ε0: dielectric constant of the d vacuum; εr: dielectric constant of the electrolyte; A: effective electrode surface; d: in this case, distance between the electrode surface and the outer HELMHOLTZ-layer).
(The capacitive impedance ZC decreases inversely proportional to the capacitance C). [MCD 87] Secondly, by using a polarizable electrode material with a lower bulk impedance Zbulk, a low charge transfer resistance Rct, and a high charge delivery capacity CDC (see below). Furthermore, the electrode material has to be chemically and physiologically inert, and to be stable over long periods of time under physiological conditions. If electrical stimulation of neurons is desired, the maximum exchange current density (ECD) [A·cm-2], the charge delivery capacity (CDC) [mC·cm-2], and the reversible or save charge injection limit (SCIL) (also save charge delivery capacity (SCDC)) [mC·cm-2] of the electrode material become important. The
ECD is describing the absolute FARADAIC current through a given electrode surface area for a certain electrochemical reaction. It depends on the material, its structure, the electrochemical environment, and the electrochemical reaction taking place at the material. If it is high, the charges can cross easily the phase-boundaries between electrode and solution. This results
EXPERIMENTAL METHODS AND STRATEGIES in a low charge transfer resistance of the electrode. If the current stays below the ECD, the current increases linearly with the applied voltage. Materials with high ECDs are suitable for FARADAIC-type intra- and extracellular stimulation of neurons. They might become necessary in cases where the neuron or the axon membrane does not directly touch the electrode but is lying somewhat distant to it. (With FARADAIC-type stimulation it is important to consider the induced redox-reactions at the electrodes. Reaction products may be toxic and have to be eliminated, preferably by the inversereaction. Biphasic pulses (e.g. LILLY pulses) [LIL 55] are suitable to reduce the buildup of those products, provided that the disturbing redox-reaction is reversible.) The CDC is describing the theoretically maximum capacitive charge accumulation at the electrode in air for a given applied boundary-potential. It can be measured by integrating the ’charging‘ current in the cyclovoltammogram, and dividing through the effective surface area of the electrode. [TAN 92] With capacitive currents, no charges are crossing the phase boundaries. Therefore, no redox-reactions will take place at the electrode. However, the CDC does not take the real events at the electrode in a physiological environment during stimulation into consideration (solvent, presence of redox-couples, ...). Therefore, the SCIL is actually limiting the maximum charge transfer during capacitive stimulation. It describes, how much charge can be accumulated at the electrode and exchanged at the electrode/electrolyteinterface in an AC cycling process without leading to FARADAIC currents between the electrode and the medium and thereby to irreversible redox-processes, possibly causing the formation of toxic products in
STRATEGIES
53
the tissue. [AND 89 · MCA 92 · KOV 95 · (It has to be determined MCA 95] experimentally, and describes the maximum CDC before FARADAIC charge leakage across the phase boundaries and induced redoxreactions at the electrodes will occur (like electrochemical disintegration of water, ...). Most probable, a material with a high CDC will have a high save charge injection limit as well. Charge delivery capacities can reach values up to 400 mC·cm-2 (e.g. for iridium oxide). The CDC can be determined from the area under the cyclic voltammetry curves. Typical CDCs and SCILs are compared in table VIII for peak-potentials around 1 to 1.2 V. In general, save charge injection limits are lower by one to two orders of magnitude. Material
CDC [mC∙cm-2]
SCIL [mC∙cm-2]
Gold (Au)
4 to 6
3 to 4
Platinized gold (ep) (Pt)
100 to 200
8 to 55
Iridium (Ir)
8 (sp) to 34 (vd)
6 to 7 (sp)
Titanium nitride (TiN)
42 (sp)
23 (sp)
Iridium oxide (Ir2O3, or Ir(OH)3 in aqueous solution, respectively)
240 (sp + airof) to 400 (vd + airof)
4 to 7 (sp + airof)
VIII Comparative table of charge delivery capacities (CDC) and save charge injection limits (SCIL); ep: electroplated, sp: sputtered, vd: vapor deposited; airof: anodically formed iridium oxide films. [BUC 75 · BEE 88 · RLE 83 · JAN 95]
A very important issue in this context is the biocompatibility of the material. Therefore, only a few conducting materials are suitable for enhancing the electrical properties of the electrodes. [BRU 83 · TWA 94] The NMI-MEAs come already with sputterdeposited TiN electrodes. TiN shows columnar structures with large effective
surface areas. It is a very biocompatible material. [EGE 98] Therefore, no postprocessing of the electrodes with respect to the electrical parameters would be necessary. Electrochemical (co-)deposition of iridium and iridium oxide in a polypyrrole matrix
However, as an alternative or a supplement to TiN, a new strategy has been developed for generally enhancing the electrical parameters of recording and stimulation electrodes independent from type and manufacturer. Electrochemical iridium deposition and its subsequent oxidation will decrease the electrode impedance and enhance its biocompatibility, its capacitance and thereby the signal-to-noise ratio. Iridium is a suitable electrode material for recording. It is the densest element known, it is highly resistive to corrosion under static potential conditions, and it is chemically inactive since it is a noble metal. Iridium grows a hydrous oxide layer on its surface when electrically activated in acidic or saline solutions: IrOn-1(OH)4-n � IrOn(OH)3-n + H+ + ewith (n=1, 2, 3). The oxide exhibits very high charge delivery capability that is believed to be a consequence of reversible electrochemical valency transitions occuring in response to potential shifts in the film. It therefore shows promise in meeting the requirements for high charge capacity stimulating sites. [AND 89] Since the electrodes are conductors, iridium may be electrodeposited from aqueous solution onto the electrodes as an alternative method to the technically more demanding sputter or vapor deposition. [BEL 96 · BLA97] An in situ microelectronic process is not only more convenient but also less
54
destructive compared to thermal deposition and oxidation, which require high temperatures, that possibly destroy any microcircuitry on the electrode array. With the same setup and a smart choice of parameters, iridium oxide might directly be formed from the electrodeposited iridium through alternating oxidative redox-cycling. The so called activated iridium oxide film (AIROF) shows a very high charge delivery capacity together with a good biocompatibility. [TAN 92] Because fractally electrodeposited iridium and especially anodically formed iridium oxide is very brittle, a way of stabilizing the deposits has to be found. A co-deposition of iridium and pyrrole as polypyrrole from aqueous solution on an electrically conducting electrode material will on the one hand lead to a decrease in the electrode impedance due to the larger fractal-like surface area and bulk. On the other hand, the generated layer is mechanically more stable than mere iridium deposits due to polymeric crosslinking of pyrrole in its cavities. Firstly, iridium is electrodeposited as a thin (inhomogeneous) layer onto the electrode in a reductive cycle. The generated gaps are filled partly with polypyrrole in a subsequent oxidative cycle. Sequentially alternating the reductive and oxidative cycling will generate a porous surface covering with optimal capacitive and resistive properties. The thickness of the deposit may be determined by temperature, the total number of cycles, and its relative composition by different vertex-delays at the reductive or oxidative peak-potentials, respectively.
EXPERIMENTAL METHODS AND STRATEGIES Relevance and promotion of cell adhesion for enhanced reliability in signal recording and signal interpretation
To increase the signal-to-noise (S/N) ratio and also to help the cells survive, cell adhesion onto the substrate should be investigated and optimized. As a starting point, it is well known that cells in general, and in particular nerve cells, prefer smooth, hydrophilic surfaces with positive partial charges. In contrast, hydrophobic, negatively charged surfaces act repulsively. [KLE 88 · MAS 92 · VAL 92 · VAL 93 · SOE 93 · NLA 96]
Close contact of the somata and its neurites to the electrodes will enhance the signal quality with an increase in the S/N ratio. It may be favorable to cover the relevant electrode surfaces on the substrate with common adhesion and/or differentiation promoting substances like laminin, fibronectin, or various nerve growth factors (NGF). [CLA 93] In an advanced approach, surface patterning with adhesion promoting areas and/or paths might be desirable to direct cell and neurite growth and thereby influencing and tailoring the structure of the resulting network. One might think of directing cell distribution in forming cell clusters of cell aggregates connected among each other. This would lead to a better sealing of the electrodes towards the surrounding medium as well as to a possible simplification of signal attribution and signal interpretation. With respect to signal interpretation and data reduction without losses in data quality or information, different network patterns could be investigated. Besides chemical modification of substrates, surfaces might be micropatterned topographically as well. The local micro[MYL 95 · SOR 98] environment apparently has a profound
STRATEGIES influence on cell behavior such as cell shape and guidance of movement. [WIL 93 · CLA 94] However, in this thesis the focus is directed onto chemical modification only. Adhesion promoting compounds
Known adhesion promoting substances for neural cells are either biologically derived adhesion molecules and anchor proteins like laminin, [ENG 81 · KLM 85 · MAR 87 · MAR 88] fibronectin, elastin, or collagenes, [KOO 95] the immunoglobulin superfamily and others, or artificial, mainly positively charged polymers [SOE 93] like poly-D/L-lysine, [JAC 77] and various other polyamino acids (ornithine, arginine, ...), or organosilanes for self-assembled monolayers. [STE 93 · HEA 94 · Adhesion mediating HIC 95 · SFF 95] mechanisms and therefore adhesion strength and durability may be different for these different classes of compounds. For a tabular comparison and summary of different adhesion molecules and related surface modification strategies, the reader may be referred to the dissertation by HARSCH. [HAR 97A]
In general, the biologically derived substances are still rather bulky with diameters of around 100 nm or more. Assuming a decay of the signal with a function that is at least inversely proportional to the distance of the organelle to the electrode, it may be favorable to extract the adhesion promoting centers of those compounds and attach them to the electrodes rather than the compound itself. The suitability of that approach has been proven by RANIERI et al. already. [RAN 94 · RAN 95] Therefore, this will be one of the strategies being pursued.
55
Coupling-components for linking adhesion promoting endgroups to the electrode substrates
The general approach to linking adhesion promoting molecules to specific electrode areas is the electropolymerization of phenol (or pyrrole for its conductivity and color: its intensity might be used for evaluating the thickness of the resulting polymer. Not yet investigated) derivatives onto those electrode surfaces which also will be used for signal recording lateron. The monomer may contain either a reactive terminal group for further chemical derivatization ('grafting from' approach, as in figures 55 to 58), or already the adhesion promoting peptide ('grafting to' approach, as in figures 53 and 54) in a sidechain. [KNO 96 · RÜH 97] Once the desired polymer film has been generated, it may be modified chemically at will, e.g. by coupling positively charged amino acids to the reactive terminal groups. The so resulting surface coverings may either mimic the protein or provide the same properties as e.g. poly-D/L-lysine with the advantage of a very localized effect at the electrode site only. Other amino acids like arginine or ornithine could also be used solely or as a member in the formation of a co-polymer. The raw polymer film could also be coupled covalently to terminal groups represented on the outer surface of the cell itself, as it will be discussed as a third alternative. Finally, whole adhesion proteins or amino acids might be entrapped physically and statistically during the polymerization procedure of an inert polymer. [WEI 99] All polymer films only physisorb on the electrode surface. Their adhesion strengths probably depend on the texture of the surface. The rougher the electrode, the better the polymer will adhere due to its steric entrapment in cavities. As mentioned, cells
EXPERIMENTAL METHODS AND STRATEGIES
56
prefer to adhere onto smooth surfaces. In that respect, the polymer formation on top of the rough electrode area will smoothen its surface and thereby compensate the otherwise desired, but in this case disadvantageous, fractal structure of the electrode to promote cell adhesion indirectly. However, any phenol-derived polymer film will have insulating properties. It is not yet clear whether the polymer will decrease the signal-to-noise (S/N) ratio noticably compared to polymer-free electrodes. Alternatively, a polypyrrolderived polymer could be generated for its electrical conductivity in certain cases (depending on the deposition parameters and the substituents [BAR 90 · GAR 91] [DIA 91]). Suitable techniques for controlled electropolymerization, and for quantitative evaluation of film thicknesses are cyclovoltammetry and impedance spectroscopy. For controlling macroscopically whether the desired peptide-polymer has been generated, the peptides can be stained with regular peptide specific stains (phenylisothiocyanate, ninhydrine, LOOTS modified BODIAN silver stain [LOO 79], COOMASSIE-brillant blue, etc.). Monomers for electrochemically tailoring adhesion functionality at electrode surfaces
The choice of monomers used is briefly explained and then illustrated in a common reaction scheme.
aminocapronic acid or lysine for attaching adhesion promoting peptide chains or amino acids with their C-terminals to the polymer. Only then, their positively charged terminating amino groups will be available to the adhering cells. 2-(3-Hydroxyphenyl)-ethanol [2(3HPE)] OH
OH
2-(3-Hydroxyphenyl)-ethanol may be coupled to the carboxylic terminal of the adhesion promoting compound via a common ester reaction.
3-Hydroxybenzyl alcohol [3HBALC] OH
3-Hydroxybenzyl alcohol, like 2-(3-hydroxyphenyl)-ethanol, may be coupled to the OH carboxylic terminal of the adhesion promoting compound
via a common ester reaction. Its only difference is the shorter distance to the electrode surface by one carbon atom. 3-Hydroxybenzaldehyde [3HBA] O
H
In contrast to 3-hydroxybenzyl alcohol, the aldehyde may either be used to create repulsive, negatively charged OH electrode coverings by a
simple reaction with amino groups of the adhesion promoting compound. But it also can react with a spacer like hydrazine to form a hydrazone which in turn will couple to the carboxylic C-terminal of the adhesion promoting compound. 3-Hydroxybenzylhydrazine dihydrochloride [3HBH]
3-Hydroxyphenylacetic acid [3HPA] O OH
OH
3-Hydroxyphenylacetic acid may be polymerized easily at standard conditions. But its carboxylic group requires spacer compounds like ε-
NHNH2 3-Hydroxybenzyl-
OH
hydrazine dihydrochloride may either be used to react with the carboxylic Cterminals of the adhesion
STRATEGIES
57
promoting compounds to form a hydrazone or react with ketone-bodys of the outer cell
membrane, like a modified version of the common sialic acid. R
R
R -e-H+
-eside products
A
OH
electrode surface
electrode surface
O.
O
+
OH
C
B
H
SE
R
-H+ R
R
chemical post-processing ...
OH
O -2eO
E
x
,
-2H+
electrode surface
3-substituted para-linked polyphenol
51 General reaction scheme for generating a raw electropolymerized film of polyphenol or any of its derivatives, respectively, on the recording electrodes of the electrode array: an electropolymerizable monomer with either a reactive sidechain (R) or a peptide fragment (R) will be electropolymerized by applying oxidative voltage patterns at the desired electrodes. The thus formed functionalized polymer may be altered chemically in a post-processing procedure. The postulated mechanism of the polymerization can be described as follows: [SPE 80 · GAR 91] Firstly, the phenolic hydroxy group of (A) will be oxidized to the phenol-cation-radical
O D R
(not shown). This will lose a proton thus forming the phenoxyl-radical (B) which will be oxidized immediately to the phenoxy-cation (C) for its lower oxidizing potential. The phenoxy-cation with its positive charge being delocalized will attack the aromatic ring of a mono- or oligomer in its neighborhood preferably in the para or ortho position, thus replacing the hydrogen in an electrophilic substitution reaction and forming the di- or oligomer (D). By increasing the delocalized electron system in the polymer with each newly attached monomer, the polymerization should become easier while the polymer is growing.
EXPERIMENTAL METHODS AND STRATEGIES
58
diffusion into the bulk solution
-e-
X-
A
N H
B +
H D
NH +
formation of side products
+. N H
electrode
+
+. N H
N H
+ NH
-e-
H
H N .
H
electrode
C
NH +
H
H
-2H+
.+ H N N H E
H N . +
-eelectrode
N H
N H F
G
x
polypyrrole
52 General reaction scheme for generating a raw electropolymerized film of polypyrrole or any of its derivatives, respectively, on the recording electrodes of the electrode array: an electropolymerizable pyrrole monomer with either a reactive sidechain or a peptide fragment in place of the hydrogen atom at the nitrogen in the ring will be electropolymerized by applying oxidative voltage patterns at the desired electrodes. The thus formed functionalized polymer may be altered chemically in a post-processing procedure. The postulated mechanism of the polymerization can be described as follows: [REY 86 · BIL 89 · GAR 91· ARS 95 · HZE 96] At the electrode surface, the monomer (A) is oxidized to a radical-cation (B) which undergoes radical coupling (C or + with D) and subsequent elimination of 2 H rearomatization to give the pyrrole dimer (E). The rate of this process depends on the basicity of the solution. Further note that, since protons are liberated in this step, the solution near the electrode can become acidic as the polymerization proceeds. This alters the relative rates of the competing reactions and so can affect the polymerization process. The dimer oxidizes slightly easier than the monomer (∆E = -0.6 V) for its more extensive πorbital system and thus is reoxidized to allow further coupling reactions to proceed (F and G). The chain length
of the oligomer that is forming will increase and, as it grows, it becomes insoluble and precipitates out on the electrode surface. It seems that this heterogeneous stepgrowth type of polymerization continues in the solid state until the polymer reaches its final molecular weight. Note that for some materials this deposition can spread over onto the insulating surface adjacent to the electrode, the extent of the spread depending on the solubility and the kinetics of the polymerization. The exact morphology of the polymer depends on the solvent composition and the current density, but it is typically a coherent film with a -3 density of about 1.48 g·cm . Because the oxidation potential of the polymer is lower than that of the monomer, the polymer is electrochemically oxidized into a cunducting state, kept electrically neutral by incorporation of the electrolyte anion as a counter-ion (approx. one counter-ion per four repeat units). An important feature is the fact that the polymerization is not reversible whereas the oxidation of the polymer is. If the polymer film is driven cathodic, then it is reduced towards the undoped state. At the same time, neutrality is maintained by diffusion of the counter-ions out of the film and into the electrolyte.
STRATEGIES Selective promotion of adhesion by laminin-derived peptide fragments at the electrodes
The laminin-derived peptide sequence SRARKQAASIKVAVSADR (domain A, I, position 2091 - 2108 in the laminin, please refer to figure 12), which is mainly responsible for cell adhesion, [SEP 89 · RAN 94] has been synthesized on solid phase resins with a peptide robot by KIENLE and MACK in the in the group of JUNG. [KIE 97 · MCK 99] Earlier studies have shown that shorter fragments like IKVAV or CDPGYIGSR (domain B1, III, position 925933) do not promote cell adhesion as effectively as the chosen oligopeptide, especially if not immobilized covalently onto the substrate. [MAS 93 · KIE 97 · HUB 98] This may be attributed to the very importance of presenting the epitopes in the appropriate secondary and tertiary structure to the cell receptors while maintaining its spacial freedom and some flexibility at the same time. Trying to force oligopeptides into a defined tertiary structure by cyclization did not increase the adhesion promoting potency of short fragments noticably. [HUB 98] From a statistical point of view, it seems to be very unlikely to find a biologically active conformation that way. With those information in mind, the strategy of choice was to immobilize 3-hydroxyphenylacetic acid [3HPA] or 3-pyrrolepropionic acid [3PPA], respectively, to a resin, add a spacer entity like ε-aminocapronic acid [ACA: NH2polyethylene glycole (CH2)5-COOH], [PEG], β-alanine-tetraethylene glycoleglycine [ATG: NH2-(CH2)2-C(O)-O(CH2CH2O)4-C(O)-NH-CH2-COOH], or lysine [LYS], and start the regular peptide generation process with the α-amino group of the amino acids. That way, the
59
oligopeptides will have a free terminal carboxyl group. (Experiments have shown that with C-linked oligopeptides of the same sequence, but with a free terminal amino group, the adhesion mediating efficiency is reduced by more than 50%.) [KIE 97] The spacer not only enhances water solubility in case of PEG and LYS before polymerization but will also raise the degree of spacial freedom of the attached peptide chain after electropolymerization. The adducts can be stored for several months at 4°C. [MCK 99] The four products which have been used for further investigation are 3HPA-ACA-SRARKQAASIKVAVSADR, 3HPA-LYS-SRARKQAASIKVAVSADR, 3HPA-ATG-SRARKQAASIKVAVSADR, 3PPA-ACA-SRARKQAASIKVAVSADR, and 3PPA-ATG-SRARKQAASIKVAVSADR. Their adhesion promoting properties have been compared to that of laminin and those of the monomers, respectively. The phenol or pyrrole termini of those peptides are electropolymerized oxidatively onto interdigitated 100 µm platinum comb electrodes on sapphire, or onto spacious ITO electrodes on glass, respectively. It is assumed that under the experimental conditions, which will be described lateron, only the 3HPA and the 3PPA termini are electrochemically crosslinked in an oxidative reaction process as described in scheme 51, and as sketched in figure 53. The polymers will settle onto the electrodes and stick to them by physisorption and/or by mechanical entrapment in surface cavities. In case of using interdigitated platinum electrodes, the selective covering of only one of two combs will answer the question to what degree the neurons will prefer the
60
modified electrode in comparison to the nonmodified reference. In addition, the peptide density has to be tuned for its maximum biological activity. It is very likely that a too dense plating might lead to a sterical obstruction of the active center of the epitope, thus preventing any adhesive interaction with available cell receptor(s). The density could be adjusted and optimized in concentration dependent
EXPERIMENTAL METHODS AND STRATEGIES experiments (dilution with small electrochemically active, but biologically inert monomers, as sketched in figure 54) and controlled semi-quantitatively by regular peptide staining techniques, as already mentioned above. A co-polymerization of different peptide fragments should be investigated with respect to synergetic effects in their biological activity.
53 Schematic electropolymerization sequence in a 'grafting to' approach with head group modified laminin epitopes. When only modified epitopes are used as
monomers, a physisorbed polymer film with a high density of recognition centers will result. This might lead to a sterical obstruction of the adhesion mediating keylock mechanism with membrane-bound receptors.
54 To tune the epitope-presenting polymeric layer for its maximal biological activity, the portion of biologically
active monomers could be decreased in a dilution dependent co-polymerization with another electroactive, but biologically inert monomer.
STRATEGIES
There are mainly two advantages to work with electropolymerizable peptide fragments instead of using the whole protein for cell adhesion and directed growth: 1. The conventional method to cover the substrate with the rather bulky laminin from solution will give widely spread and disordered coatings. Reproducibility is low. Selective application is not possible. In contrast, with electropolymerizable peptide epitopes, the adhesive properties of the substrate may be structured in a defined and predictable way. 2. The probability that a neuron or its axon will get into close electrical contact with the electrode increases with decreasing thickness of the adhesion promoting layer. Because signal recording from MEAs is mainly goverened by capacitive currents, the capacitance is higher with thinner coatings which act as dielectrics. The effect of the polymer onto the electrode impedance should be investigated after electropolymerization.
61
Reaction schemes for the cyclovoltammetric polymerization of phenol derivatives and covalent attachment of amino-terminated amino acids
Shown below are the reaction schemes of the electropolymerizable monomers and their post-modification in a ’grafting-from‘ approach. Only after electropolymerization of the monomers, the surface of the polymer is chemically modified by various chemical standard reactions (esterification, formation of amides, SCHIFF bases, or hydrazides). Alternatively, the already peptide functionalized monomer may be electropolymerized itself in a ’grafting-to‘ approach, thus forming a polymer which does not require any further functional alteration. Depending on the chemical environment, either strategy has its advantages and flaws. [KNO 96 · RÜH 97]
EXPERIMENTAL METHODS AND STRATEGIES
62
R1 R1 O
R2
H N
+ ketones
N
R2
+
+ H 3O
O
-2 H2O NHNH2
O
* n
C
NHNH2 O
O
HN * O n
OH
A
O
B
R1 H2N NH2 -H2O
R2 NH
H N N H
O
O O
* n
D 55 Electrochemically deposited tailored adhesion polymer with 3-hydroxyphenylacetic acid as the base monomer and a diamine as a spacer. An oligopeptide may be
introduced finally, but not necessarily. Alternatively, the amino-terminated spacer may act by itself as an adhesion promoting entity.
STRATEGIES
63 *
OH
OH
O O
OH
+ * O n
OH
A
other combinations
+ O *
O
B
* O n
C
electropolymerized polymer anchor on substrate, ready for further functionalization
+ D/L-lysine
- H2O
+
+ H3O
+ (oligo)peptide
- H2O
+
+ H3O
H3N
+
O
HN O H NH2 C O
R1
R2 NH
O O
O
electropolymerized polymer anchor on substrate
O O O
D
attached peptide epitope with adhesion promoting properties
* n
E
ester: poly-D/L-lysine analogon
O
* n
ester: e.g. laminin analogon
also: poly-D/L-arginine poly-D/L-glutamine ...
56 2-(3-Hydroxyphenyl)-ethanol as well as its shorter equivalent 3-hydroxybenzyl alcohol may be polymerized and functionalized afterwards with single amino-
terminated amino acids or (oligo)peptide fragments from adhesion promoting proteins like laminin or fibronectin in an ester reaction.
EXPERIMENTAL METHODS AND STRATEGIES
64
COOH HOOC H Rx C + (oligo)peptide
N
+
H
N
H
+ H3O
O
O
+
-2 H2O O
* n
α-aminogroup
terminal amino group
C O
O
H
* n
O
D negatively charged COOH-terminated surfaces
H
O O
OH
A
* n
HN O
B
NH2 N H2N NH2
H
+ H3O
NH
HN
O
N
H
+
O
R2
R1
+ (oligo)peptide
O
O
- H2O
O
E
* n
- 2 H2O
O
* n
F positively charged NH2-terminated sufaces
57 Benzaldehyde may be used either to create electrochemically generated repulsive surface films or
adhesive layers depending on the lack or introduction of hydrazine as a coupling agent.
STRATEGIES
65 O
O
O OH
OH
A
O
introduction of a spacer
*
O
OH
n
*
O
- H2O
B
NH2
N H
NH2
H2N
O
n
C + (oligo)peptide + H3O
O
HN O
R2
R1
NH
HN
O
- H2O
+
attached peptide epitope with adhesion promoting properties
spacer
O N H O
O
*
electropolymerized polymer anchor on substrate
n
D di-hydrazide: e.g. laminin analogon
58 3-Hydroxybenzylhydrazine-dihydrochloride may be used in its electropolymerized form to react with
(oligo)peptide fragments or to couple to ketones like ManLev by forming hydrazones as suggested in the following paragraph.
EXPERIMENTAL METHODS AND STRATEGIES
66 amino acid
R' = OH
O α
α H2N
R
O
HO
O
HO
O
N H
H
R
H
amide OH
OH
3-hydroxyphenylacetic acid R H2 N OH
O
HO OH
O
α H2N
or
R
O
H ester
OH
OH
H
α
OH
3-hydroxybenzylalcohol 2-(3-hydroxyphenyl)-ethanol O
HO H
O
HO
O
α H2N
R
α H
N R
H
H SCHIFF base
OH
OH
3-hydroxybenzaldehyde R O HN
NH2
OH α
H2N
R
H2N
HN
H
α
N
OH
H hydrazide
OH
OH
3-hydroxybenzylhydrazine
59 Comparative overview of the different artificial, electrochemically active phenol derivatives which can be modified chemically after electropolymerization for generating locally adhesive or anti-adhesive polymer
films. For mimicring poly-D/L-lysine and its analogs, the polymer film with its dangling reactive groups may react with amino acids like lysine, arginine, or ornithine in standard reaction procedures.
Ketone-modified sialic acid coupled to electropolymerized hydrazides
modified sialic acid (N-acetylneuramic acid, NAPA). [SER 96] Sialic acid is synthesized in the cell from the precursor molecule Nacetylmannosamine. It is attached in the endoplasmatic reticulum and within the GOLGI-apparatus as a terminating sugar to a ganglioside or to a glycoproteine, respectively. According to [KOO 95] BERTOZZI, the cell will synthesize and
As an alternative to the electropolymerization of peptide fragments from adhesion promoting proteins, a ’coupling layer‘ of electropolymerized hydrazines may be attached covalently to cell surface proteins, whose oligosaccaride residues are terminated by a ketone-
STRATEGIES secrete a sialic acid with an additional keto group from a modified precursor Nlaevulinic acid-D-mannosamide (ManLev). [BER 97] The keto group may now react selectively with a hydrazine entity of the polymer on the substrate under the formation of a covalently linked hydrazone. [ORG 88 · MRC 92] This strategy is related to ideas by TOLVANEN and GAHMBERG. [TOL 86] ManLev has been synthesized by MACK from the group of JUNG. There is one critical point in this strategy though: Any sugar (aldehyde or ketone) in the culture medium may react with the hydrazines of the polymer as well, thereby competing with the keto-modified glycosides and glycoporteins at the cell membrane. They could already have saturated all available hydrazine groups on the substrate before cell attachment has occured. In that case the cells have to be suspended and seeded in a sugar-free medium first to allow them to attach to the surface in the first few minutes to hours. Only afterwards the deficiency medium may be substituted with regular medium, or vital sugar components may be added,
67
respectively, which may saturate any unoccupied hydrazine terminals of the polymer. Furthermore, it might be of interest, what distance between the polymer and the hydrazine is sterically optimal for hydrazinecell-interaction. If the reaction between the modified keto-sialic acid and the hydrazine is kinetically hindered for sterical reasons, a spacer might be introduced between the monomer and the hydrazine, as already discussed for the other strategies. Finally, long term stability of that junction has to be investigated as well. It is not clear whether the cells will really like such a stringent covalent confinement. While cells usally rearrange quite a bit during growth and differentiation, their fixation might have a negative influence on their development. The cell could certainly detach from the substrate by cleavage of the terminal ketomodified sialic acid with the help of neuraminidases.
EXPERIMENTAL METHODS AND STRATEGIES
68
D-mannosamine-levulinic acid amide ( ManLev) COOH O
O
OH O
H N
OH
glycoproteine or glycolipid
OH
HO
COOH levulinic acid residue
O
O OH
+
neuron HN OC
O
OH
HO OH H N
O
room temperature
NH2
neuron
CH2 para-linked polyhydroxyphenlyacetic acid hydrazide O
covalent coupling: N formation of a HN hydrazone OC CH2
O x
x electrode surface
60 Postulated coupling reaction between the terminal keto-modified N-laevulinyl-neuraminic acid amide at the cell membrane and the hydrazine or hydrazide polymer
Complementing concepts for peptide mediated cell adhesion: charge controlled cell adhesion
For a final evaluation of the quality of the presented adhesion strategies, they have to be compared to more simplistic approaches. It may be questioned whether the experimental expenditures of the polymeric adhesion schemes will justify their effects. Alternatively, less complicated concepts
at the substrate: hydrazine or hydrazide, respectively, react covalently to form a hydrazone. That way, the cell will be immobilzed onto the substrate.
might be envisioned which already meet the expectations of promoting cell adhesion and cell differentiation sufficiently. Results from MASSIA et al. [MAS 92] und KLEINFELD et al. [KLF 88] suggest that neurons prefer hydrophilic and positively charged surfaces, while avoiding hydrophobic substrates with a net negative charge. These conditions might be simulated by applying an electrical field with its source at the electrodes.
STRATEGIES
69
Summary of cell adhesion strategies
B
Electro-chemically reactive group
3-hydroxyphenylacetic acid (3HPA)
Spacer
HN-(CH2)2C(O)-O-CH2[CH2-O-CH2]3-CH2-O-C(O)NH-C(O)3-(pyrrole-1-yl)propionic acid
HN-(CH2)5-C(O)-
HN-(CH2)2C(O)-O-CH2[CH2-O-CH2]3-CH2-O-C(O)NH-C(O)-
Electro-chemically reactive group
Spacer
[i]
none
to [i]: Investigation of probable anti-adhesive properties of the polymer.
[ii]
hydrazine
to [ii] and [iii]: formation of hydrazides or amides, respecitvely: Generation of positively charged surfaces at physiological conditions (around pH 7).
[i]
not intended, but possible
3-hydroxybenzyl alcohol
3-hydroxybenzyl hydrazine
Adjustment and optimization of the epitope densities on the surface via co-polymerization with non-modified monomers like 3(pyrrole-1-yl)-propionic acid, pyrrole, or a mixture of both.
Notes
[ii]
3-hydroxybenzaldehyde
laminin fragment (epitope). [HUB 98] Adjustment and optimization of the epitope densities on the surface via copolymerization with non-modified monomers.
Adhesion promoting sequence or group
[iii] diamine
2-(3-hydroxyphenyl)ethanol
Notes
Verification of the adhesion mediating properties of this particular
HN-(CH2)5-C(O)-
3-hydroxyphenylacetic acid
(Chemically modified) polymers in analogy to polyamino acids
Adhesion promoting sequence or group
SRARKQAASIKVAVSADR
Laminin-derived protein fragment (epitope)
A
to [i]: Investigation of the properties of alcohol groups regarding cell adhesion and cell growth; possible effect due to its similarity to the many amino acids: glycosides at the cell surface. lysine, arginine, to [ii]: Common esterification after chemical activation of the carboxygroup ornithine, ... of the amino acid: formation of a poly-amino-acid-analog functionalized surface.
none
[i]
none
[ii]
hydrazine
[iii] diamine
to [i]: Investigation of the properties of aldehydes regarding cell adhesion and cell growth; possibly no effect due to the abundance of sugar and ketone bodies in the organism which primarily play a nutritive rather than a adhesive role. to [ii] and [iii]: Formation of SCHIFF bases, subsequent reduction to a peptide-analog bond, or formation of an amide, respectively: Generation of positively charged surfaces at physiological conditions (around pH 7)
[i] [ii]
none
zu [i]: Generation of positively charged surfaces at physiological conditions (around pH 7)
amino acids: lysine, arginine, to [ii]: Common esterification after chemical activation of the carboxyl group ornithine, ... of the amino acid: formation of a poly-amino-acid-analog functionalized surface [iii] ManLev to [iii]: Investigation of the adhesion promoting properties of ManLev, which will be fed to the neurons, and secreted as a keto-modified derivative of sialic acid on the outer cell membrane. That way, it can react with the hydrazine-modiyfied polymer on the substrate under the formation of a SCHIFF‘s base.
Results and discussion
Electrochemical iridium deposition from aqueous solution of H2IrCl6 General parameters and related textures of mere iridium layers
For increasing the electrode impedance, its effective capacity, and its save charge injection capacity, iridium has been deposited onto model electrodes as a suitable as well as biocompatible material. [TWA 94] No iridium could be deposited from an aqueous solution of IrCl3. Apparently iridium(III) solutions quickly lose electrochemical activity due to readily occurring 'reactions of aquation'. [GRS 95] Iridium may be electrodeposited at temperatures above 338 K (65°C) onto platinum strips (0.5 · 10 mm2) from an acidic aqueous solution containing 0.01 mol·l-1 of dihydrogen-hexachloroiridate (IV) hexahydrate (H2IrCl6·6H2O, which is strongly corrosive itself) in 0.1 mol·l-1 HCl in the presence of 0.3 mol·l-1 of potassium sulfate (K2SO4). The solution has a sherry-brown color. Applying cyclovoltammetric reductive potential ramps from 0 V to –2 V in a potentiostat-driven three electrode arrangement, iridium may be deposited onto the cathodic working electrode with various appearances and properties depending on the scan-rate, the vertex-delay, the number of cycles, and the temperature. A very critical parameter is the temperature. No iridium
4
could be electrodeposited below 338 K (65°C). Furthermore, no iridium could be deposited at higher temperatures without the presence of potassium sulfate, even not at potentials lower than -2 V. The use of K2SO4 has been mentioned by JAWORSKI and COX in a palladium-iridium co-deposition. [JAW 92] The parameters described by VUKOVIC and CUKMAN [VUK 92] did not give any iridium layers. However, it has not been tested, whether the use of H2IrCl6·6H2O instead of (NH4)2IrCl6 has been responsible for the outcome of the experiment. Since the standard potential for the reaction Ir(IV)Cl62- + e- → Ir(III)Cl63- is 1.02 V and that for Ir(III)Cl63- + 3e- → Ir + 6Cl- is 0.77 V [LID 82] (the value given by BOCKRIS and REDDY for Ir3+ + 3e- → Ir is given as 1.0 V), [BOC 70] the vertex potential may be chosen between 0 and -2 V. The rather low negative potential of -2 V has been chosen for the simultaneous formation of hydrogen at the working electrode (cathode: 2 H3O+ + 2e- → H2 + 2 H2O) under these conditions. Film density and morphology is predominantly governed by that vivid formation and evaporation of hydrogen, thus generating a rather large effective and fractal surface. In addition, the bubbles will physically remove brittle parts of the layer at the same time, thereby increasing its strength automatically. Alternatively, iridium could once be electrodeposited onto a platinum strip directly as a thin and scratch-resistant black
ELECTROCHEMICAL IRIDIUM DEPOSITION FROM AQUEOUS SOLUTION OF H2IRCL6 layer from basic solution (NaOH, pH ≈ 11) of 0.01 molar H2IrCl6 at temperatures between 323 K and 363 K (50°C to 90°C) and potentials between -0.3 V and -1.2 V after 100 cycles in the presence of K2SO4. Direct deposition from basic solution has been reported by BURKE and SCANNEL [BUR 84] and by YAMANAKA [YAM 89] as well. However, those layers are said to be not chemically stable in less basic environments. A major experimental problem encountered is the simultaneous chemical and irreversible formation of dark-blue iridium oxide flakes in solution which will precipitate after a few seconds to minutes while the solution turns clear. As a consequence, very soon no iridium-cations are available for electrodeposition anymore. This has been observed under similar conditions by REID as well. [RED 63] Subsequent oxidative cycling of the iridium layer in that basic solution from -0.25 V to +1.2 V leads to a change in its color from dark grey to bright blue, presumably due to a certain type of iridium oxide formation which has already been observed with sputtered iridium oxide films. [SVN 79 · KNG 83] To summarize, iridium layers will form from an acidic, 0.01 molar aqueous solution of hexachloroiridate (IV) in 0.1 molar HCl, containing up to 0.3 mol·l-1 of K2SO4, at temperatures above 338 K (65°C). Their textures and thicknesses strongly depend on the electrochemical parameters: [A] thin, non-visible, but SEM- and EDX-detectable iridium layers will be generated with 150
71
potential ramps between 0 V and -2 V, with scan-rates of 500 mV·s-1, and with vertexdelays of only one second. These layers are rather fine grained, but rough, partly inhomogeneous, but without ruptures. [B] Thick, black iridium layers with macroscopically homogeneous textures and velvet-like appearances are formed with 25 to 100 potential cycles between 0 V and -2 V, with scan-rates of 500 mV·s-1, and at temperatures between 343 K and 358 K (70°C to 85°C), but in this case with vertexdelays of up to 60 seconds. However, mechanical stability of these layers is rather poor. As can be seen on the SEM picture (Digital Scanning Microscope DSM 962 with a tungsten needle cathode, Zeiss; working pressure: 1·10-6 mbar, acceleration voltage: 15 kV, sample distance: 7 mm to 13 mm) in figure 62, the electrochemical iridium deposition leads to at least three layers of different morphologies. The first visible layer on the platinum substrate consists of a regular carpet of small-sized grains with diameters of approximately 0.05 µm. On top of it, there is a fairly regular layer of largersized grains with diameters of up to 0.2 µm which at some places have grown to comparatively large and irregular clusters with sizes of several micrometers on the outermost surface of the deposit.
72
RESULTS AND DISCUSSION
61 SEM picture of a thin iridium layer which is formed when the vertex-delay at the negative peak potential is as short as one second. Although no layer is visible with the blank eye, SEM reveals a somewhat rough and inhomogeneous but closed iridium deposit with several protruding iridium clusters. Area of 39.2 µm by 29.0 µm.
63 SEM picture of a visibly thick, velvet-like black iridium layer which is formed when the vertex-delay at the negative peak potential is extended to up to 60 seconds. The SEM is showing a rather homogeneous underlaying deposit with larger irregular aggregates on top of it. Area of 39.2 µm by 29.0 µm.
62 Magnification of a somewhat regular zone of the underlying layer of 61 showing fused agglomerates of rather regularly sized iridium grains with diameters of up to 0.2 µm. The area enframed by the circle is revealing an underlying bottom layer of small-sized grains with diameters of 0.05 µm. Area of 3.9 µm by 2.9 µm.
64 Zoom into a somewhat regular zone of the underlying layer of 63 showing fused agglomerates of rather regularly sized, but this time somewhat larger iridium grains. Area of 11.3 µm by 8.4 µm.
In general, adhesion of freshly prepared wet deposits to the smooth substrate surface is rather poor and their lateral stability is lower than that of air-dried iridium layers, suggesting a lateral rearrangement of the layer components and/or a formation of a thin supportive surface oxide layer. Mechanical stability of electrodeposited iridium increases with aging of the deposits
on air and might be enhanced by electrochemical iridium deposition on rough metal surfaces rather than on smooth platinum substrates, or by co-deposition of a less noble metal to allow for subsequent electrochemical oxidation of the layer without detaching it from the substrate surface. Regularity of the film, comparable to that of platinum deposits, might be enhanced with modifying the cycling
ELECTROCHEMICAL IRIDIUM DEPOSITION FROM AQUEOUS SOLUTION OF H2IRCL6 parameters. The iridium layer density should stay low for minimizing diffusion controlled processes.
73
slight changes of parameters may be seen on the following light-microscopic pictures (of almost same magnification).
Quality and suitability of a polymeric matrix made from electrochemically deposited polypyrrole and embedded iridium for signal recording
To improve mechanical stability of iridium deposits without compromising in its good impedance characteristics, iridium can be co-deposited electrochemically with pyrrole onto plain platinum strips in sequential reductive or oxidative cycles, respectively. During an initial and rather short (< 80 s) reductive cycling step, iridium is reduced from solution and adheres as a thin and scratch-resistant layer to the platinum substrate. Iridium is deposited first because it turned out that electrochemically formed polypyrrole layers do not stick to smooth platinum surfaces. This way, the polypyrrole will form within the gaps and cavities of the iridium layer, which provide the necessary grip. Subsequent alternating reductive and oxidative cycles therefore lead to a mechanically stable polypyrrole matrix with embedded iridium. Those co-deposits are showing excellent impedance behavior down to 0.1 Hz while being mechanically stable at the same time: approx. 100 Ω between 0.1 Hz und 105 Hz for a platinum strip with a geometrical surface area of 1 mm2. Matrix properties may be adjusted rather easily through variation of electrochemical (scan-rate, vertex potential, vertex-delay, number of cycles), environmental (temperature), and chemical (composition of the electrolyte, supporting salts, acidity) parameters to optimize layer thickness, composition and stability while maintaining the desired impedance characteristics. The very difference in outcome due to rather
69 Best case of an iridium-polypyrrole co-deposit: rather stable, macroporous and fine-grain fractal polypyrrole structure on an underlying iridium layer. Iridium was electrodeposited first as a thin, but scratch-resistant layer onto a platinum strip. (Parameters: -0.2 V to –1.3 V, -1 0.5 V·s , 60 s vertex-delay, 1 cycle up to 5 cycles, 80°C, 10 mM H2IrCl6, 0.3 M K2SO4, 0.3 M KCl, 0.1 M HCl.) Afterwards, polypyrrole was electrodeposited in a different container from a < 0.1 M pyrrole solution. (Parameters: -1 -0.4 V to +1.3 V, 0.1 V·s , 0 s vertex-delay, 5 cycles, 60°C, 0.3 M KCl.)
70 In this case, polypyrrole had formed a rather thin but denser, less porous, and smoother layer on top of the iridium. The only significant difference to 69 seems to be the higher temperature in this case. (Parameters for -1 polypyrrole formation: -0.3 V to +0.8 V, 0.4 V·s , 0 s vertex-delay, 3 cycles, 72°C, 0.3 M KCl.)
RESULTS AND DISCUSSION
74
the following paragraph. The XPS spectrum of an iridium film after oxidative cycling for 5000 times is showing only a small additional shoulder with an energy shift of ∆Eb = 1.8 eV to higher binding energies compared to peaks of the mere iridium film. This shoulder indicates oxide formation. However, after [MIC 77 · KÖT 84 · FER 93] cycling platinum appeared in the spectrum due to oxidative loosening of the iridium from the platinum substrate. Characterization of the electrochemically modified test 71 For comparison, a thick (several hundred µm) and only microporous layer of polypyrrole that covers any iridium underneath. Such a deposit is not desired for its mostly diffusion controlled impedance behavior. Besides the higher temperature, the long lasting vertex-delay is leading to a rapid polypyrrole accumulation. (Parameters -1 for polypyrrole formation: -0.3 V to +1.0 V, 0.5 V·s , 60 s vertex-delay, 5 cycles, 75°C, 0.3 M KCl.)
Electrochemical AIROF formation from electrodeposited iridium
Due to the instability of the electrodeposited iridium films; they could not be activated electrochemically without loosing the adhesion to the substrate surface at the same time. Cyclovoltammograms show the characteristic profile of iridium oxide but currents decreased with an increasing number of activation cycles, as discussed in
electrodes
Cyclovoltammetry (CV), X-ray photoelectron spectroscopy (XPS), energy dispersive X-ray spectroscopy (EDX), and electrochemical impedance spectroscopy (EIS) have been used to characterize the generated iridium deposits. In situ cyclovoltammogram of the iridium deposition
The following figure shows a CV of the iridium deposition process on platinum. A typical increase in current can be observed with an increase in the number of reductive cycles due to an increase of the effective surface area through fractally electrodeposited iridium.
ELECTROCHEMICAL IRIDIUM DEPOSITION FROM AQUEOUS SOLUTION OF H2IRCL6
[A]
75
0.49
cycle 36 0.42
0.35
cycle 25
0.28
cycle 1 0.21
0.14
0.07
0 -0.2
-0.3
-0.4
-0.5
-0.6
-0.7
-0.8
-0.9
-1
-1.1
-1.2
-1.3
-1.4
-1.5
-1.6
-1.7
-1.8
-1.9 [V]
72 In situ cyclovoltammogram during electrochemical iridium deposition onto a platinum strip with dimensions 2 10 ·10 mm in an aqueous solution of 0.01 M H2IrCl6 with K2SO4 as a crucial participant in the deposition process at th 80°C. Shown are the first (solid line), the 25 (dashed th line), and the 36 (dotted line) cycle. The scan-rate had -1 been set to 500 mV·s , and the vertex-delay at –2 V lasted 60 seconds in each cycle. The formation of hydrogen is dominating the CV from -1.3 V downwards to -2 V and is responsible for the fractal surface patterning of the iridium. While the current of the first cycle is always
rather high mainly due to the reduction of impurities on the surface of the plain platinum strip compared to subsequent cycles, it can be seen that the reductive as well as oxidative current rises nicely between cycle 25 and cycle 36, as expected with an increase of the electroactive surface with each additional deposition cycle. Since iridium has been deposited as an amorphous layer, the CV is a superposition and mean of the various peaks that differ distinctively in position and amplitude depending on the crystal plane of the metal that is exposed to solution. [MOT 84 · CWY 83]
In situ cyclovoltammogram during formation of activated iridium oxide films (AIROF)
running from -0.25V to +1.25 V and back. During the oxidative half-cycle (negative currents), hydrogen, being adsorbed at the electrode, is oxidized. (The first ramp does usually not show that peak.) In the positive region, water will be disintegrated and oxygen be oxidized. In general, the gaseous reaction products stay adsorbed to the electrode unless the currents are high enough for bubble formation. During the reductive half-cycle (positive currents), first the adsorbed oxygen is reduced again, and lateron, below +0.1 V, hydrogen is formed from water or H3O+-ions at the electrode.
In general, three characteristic regions in a CV at slightly negative and positive potentials may be distinguished. Within -0.3 V to +0.1 V, there is the hydrogen region with several peaks relating to the reduction and oxidation of differently adsorbed hydrogen. Between –0.1 V and +0.6 V, the double-layer region can be found which displays information about adsorption phenomena of substances other than hydrogen or oxygen. From thereon up to +1.3 V, the oxidation and reduction of oxygen dominates all other phenomena. The triangular voltage ramp for the formation of activated iridium oxide is
With the simultaneous oxidation of iridium to iridium oxide at positive potentials above +1.0 V, oxidation and reduction currents rise with an increase in the thickness of the
RESULTS AND DISCUSSION
76
iridium oxide layer due to its higher charge delivery capacity and to the increase in the effective surface area for its lower density compared to iridium.
[A]
AIROF has been investigated with a freshly electrodeposited iridium layer on a platinum sheet and, for comparative reasons, with a smooth iridium wire. Looking at the two cyclovoltammograms of AIROF below, the problems with electrodeposited iridium layers become obvious: instead of finding a rising current with subsequent oxidative cycles, the CV is shrinking to lower currents over time (figure 73). In contrast, AIROF on an iridium wire is showing the expected tendency of rising currents in the oxygen
and hydrogen regions (figure 74). However, the peaks in the hydrogen region indicate an open oxide layer. They will only occur when iridium is exposed to the solution. [SHY 78] This result is leading to the conclusion that the iridium oxide is crumbling from the electrode during formation due to the brittleness of the underlying iridium layer and due to the additional stress onto that layer for the lower density of iridium oxide. (According to findings by [VUK 92] MCINTYRE et al., AIROF films show densities of 2.0 g·cm-3, oxide grains with a diameter of 0.05 µm to 0.1 µm, and a high densisty of microvoids, approx. 25 Å in diameter.) [MCI 80]
25m 20m 15m 10m
1
5m
5000
0 -5m -10m -15m 1.2
1.1
1
0.9
0.8
0.7
0.6
0.5
0.4
0.3
0.2
0.1
0
-0.1 -0.2
[V] -1
73 In situ cyclovoltammogram during electrochemical iridium oxidation of an iridium-covered platinum strip with 2 dimensions 0.5 ·10 mm in 0.5 M H2SO4. Contrary to expectation, the current decreases with an increasing number of oxidation cycles between –0.25 and +1.25 V
(1000 mV·s ; cycle 1: solid line, cycle 5000: dashed line). This observation is only plausible if simultaneous stripping of the freshly generated iridium oxide layer during formation is assumed. XPS studies support this hypothesis.
[A]
ELECTROCHEMICAL IRIDIUM DEPOSITION FROM AQUEOUS SOLUTION OF H2IRCL6
77
400.0µ
200.0µ
2000 1 0.0
-200.0µ
-400.0µ 1.2
1.1
1
0.9
0.8
0.7
0.6
0.5
0.4
0.3
0.2
0.1
0
-0.1 -0.2
[V] 74 For comparison, a cyclovoltammogram of a mere iridium wire with a length of 10 mm and a diameter of 0.5 mm during oxidative cycling between –0.2 V and -1 +1.25 V in 0.5 M H2SO4 with a scan-rate of 1000 mV·s : An increase in current with increasing thickness of the oxide layer after 2000 cycles can be observed (Cycle 1: solid line, cycle 2000: dashed line). There are still peaks
in the hydrogen adsorption-desorption region (hatched area from -0.25 V to -0.05 V) that indicate the high porosity of the AIROF: Part of the iridium substrate is exposed to the solution that allows hydrogen to be adsorbed on and desorbed from the iridium substrate. No such peaks would occur if the entire outer surface exposed to the solution had been converted to AIROF.
[SHY 78]
Verification of iridium by EDX and XPS
Although the peaks for platinum and iridium are usually difficult to separate in EDX for their vicinity in the periodic table, reference measurements led to the result that no platinum could be detected anymore through the iridium layer, suggesting a film thickness above the EDX information depth of 1 µm for 25 cyclovoltammetric deposition cycles. Energies for iridium are: Mα = 2.029 eV and Lα = 9.176 eV, respectively. [BLA 97 · FER 93] Electrochemical oxidation of iridium in acidic solution does only slowly lead to the formation of an outer iridium oxide crust on top of the iridium deposit. For its lower density with respect to iridium, the iridium oxide layer usually crumbles away during formation, as hypothesized from the CV,
especially when starting from an already brittle iridium deposit. After oxidative cycling for 5000 times, only a small additional shoulder with an energy shift of ∆Eb = 1.8 eV to higher binding energies compared to the peaks of the mere iridium film could be seen in the XPS spectrum (figure 75). This shoulder indicates oxide formation, as previously discussed in KÖTZ et al. [KÖT 84] and MICHELL et al.. [MIC 77] In addition, platinum appeared in the spectrum due to loosening of the iridium oxide layer from the platinum substrate during formation. As a future perspective, iridium could be electrodeposited in a thin layer and immediately be oxidized. That way, iridium oxide could be generated directly as a rather
RESULTS AND DISCUSSION
78
[counts]
stable multilayer during alternating iridium/iridium-oxide formation cycles.
Ir 4f
7/2
60.4eV 800
Ir 4f
5/2
63.4eV 600
iridium
400
platinum Pt 4f 7/2 200
71.0eV
iridium oxide 0 73 72 71 70 69 68 67 66 65 64 63 62 61 60 59 58 57 56 55 54
binding energy [eV] 75 Superimposed XPS-spectra of the iridium layer on a platinum test-strip before and after oxidative cycling. In general, oxide formation is indicated by a shift of the iridium 4f7/2 peak to higher binding energies. However, since most of the oxide had broken off from the sample
during electrochemical oxidation, only a weak shoulder can be detected with an energy shift of of ∆Eb = 1.8 eV to higher binding energies (hatched circle). In addition, the platinum 4f7/2 peak of the platinum substrate is appearing after oxidation.
Decrease of the total impedance of iridium modified conductors
[D], respectively. With the decrease in overall impedance, the description of the electrode/electrolyte phase boundary changes dramatically in each case. To describe the interfacial region, various equivalent circuits have been modeled. Suggestions are given in table IX.
Figure 76 compares the absolute impedances of a platinum strip [A] that has been modified electrochemically with a mere iridium layer, [B] and [C], and an iridium layer stabilized through a polypyrrole matrix
[Ohm]
ELECTROCHEMICAL IRIDIUM DEPOSITION FROM AQUEOUS SOLUTION OF H2IRCL6
79
100K
[A] platinum
10K
1K
[B] iridium
[C] iridium
100
[D] iridium in a polypyrrol matrix
100m
1
10
100
1K
10K
100K
[Hz] -1
76 Superimposition of (absolute) impedance spectra in an aqueous solution of 0.9% NaCl 1.) of a clean platinum 2 strip [A] with dimensions 0.5 ·10 mm , 2.) of the same platinum strip after electrochemical iridium deposition [B] (thin dashed line; 255 cycles between 0 V and –2 V with a -1 scan-rate of 300 mV·s at 363 K) from an aqueous solution of 0.01 M H2IrCl6 at 373 K, and 3.) of a different platinum strip with almost the same dimensions as in 1.) and 2.) after electrochemical iridium deposition [C] (thicker dashed line; a total of 5 cycles between -0.2 V to -1.6 V -1 with a scan-rate of 100 mV·s and a vertex-delay of 600 seconds at 353 K), and subsequent polypyrrole formation on top of the iridium [D] (solid line; 1 cycle between -0.4 V
[A]
R1(R2CW1)W2
[B]
Q(RC)W
R1
6.2·102 Ω
Q
6.3·10-4 F·sn-1
R2
1.2·105 Ω
n
C
2.1·10-6 F
to +1.3 V with a scan-rate of 100 mV·s at 333 K, no vertex-delay), respectively. Iridium embedded in a polypyrrole matrix does not only have a desirable low and rather constant impedance down to 0.1 Hz but also shows good mechanical stability, expecially after drying. Since the frequency of a single action potential is about 1 kHz (positive and negative half wave within one millisecond), and the speed of subsequent spikes is situated between 1 Hz and 1 kHz, the properties of such matrices might already meet the electrophysiological demands for signal recording. However, the properties of such composite matrices have to be studied for smaller sized electrodes.
[C] R1C1(R2C2)W [D]
R1C1(R2C2W1)W2
R1
1.5·102 Ω
R1
1.3·102 Ω
0.91
C1
8.0·10-2 F
C1
1.2·10-1 F
R
6.8·101 Ω
R2
7.0·100 Ω
R2
1.5·101 Ω
W1 2.0·10-6 Ω·s-1/2
C
3.8·10-9 F
C2
5.5·10-5 F
C2
6.4·10-9 F
W2 2.6·10-4 Ω·s-1/2
W
1.5·10-3 Ω·s-1/2
W
IX Possible equivalent circuits that describe the impedance behavior of the different electrode-solution interfaces in figure 76 sufficiently. Interpretation of the results is difficult though. While diffusion-correlated WARBURG impedances with iridium modified electrodes may be expected, its occurence at the mere platinum strip
7.1·10-3 Ω·s-1/2 W1
1.3·10-3 Ω·s-1/2
W2
2.6·10-2 Ω·s-1/2
is not evident. While a new capacitive layer with rather high capacitance is occuring after metal deposition, the WARBURG impedance increases as well, probably due to its sponge-like constitution. In the latter three cases, the charge transfer resistance decreased dramatically as well.
RESULTS AND DISCUSSION
80
The studies on iridium and on iridumpolypyrrole deposition as well as on electrochemical iridium oxidation have not been repeated with MEA-type microelectrodes yet. Most likely, the properties of those layers cannot be transferred unaltered to the much smaller gold electrodes. However, the macroscopic model does show a tendency which might be found once again on miniaturized electrodes as well.
Potential sensitive dyes: Preliminary results from a macro-model Various mixed polymers with entrapped dye RH421 were studied with respect to their potential dependent behavior. For UV/VIS spectroscopic evaluation of absorption maxima and fluorescence quenching, the films were pressed between two ITOcovered (60 nm) glass plates (1 mm), always touching the conductive sides on top and bottom. Absorption and fluorescence spectra of the potential sensitive dye RH421 entrapped in polymeric matrices
N-(4-sulfobutyl)-4-(4-(4-(dipentylamino) phenyl)butadienyl)-pyridinium (RH421, inner salt, Molecular Probes) was chosen for its largest known response behavior to an external electrical field compared to similar dyes. [CLR 95] To characterize that fast response potential sensitive dye, it was dissolved or embedded into various matrices, respectively. The following table lists its solubility and color of the resulting solution or matrix.
solvent
solubility
color
ethanol
1
cherry red
methanol
1
cherry red
chloroform
1
dark violett
phenol
1
dark violett
toluene
3
red orange
water
4
-
cyanacrylate (super glue)
4
reddish particles
stearine
4
-
3HPA-polymer
2
red orange
lipid vesicles in water
?
?
X Solubility of RH421 in various solvents. Scale ranges from 1 (high solubility) to 4 (not noticably soluble).
In a mixture of ethanol and water, solubility of RH421 is depending on the ethanol portion. The color changes from orange (less than 0.5% of ethanol) to vivid red-violett (approx. 5% of ethanol). In a mixture of phenol and water, RH421 seems to dissolve exclusively in the phenolic phase. Since phenol does dissolve in water in low quantities only, the water phase stays clear. The following table lists the absorption and fluorescence maxima for RH421 embedded in various matrices. For comparison, known systems from the literature are placed in front of the experimental data. Absorption spectra were recorded between 800 nm and 300 nm with a Perkin Elmer Lambda 2 UV/VIS absorption spectrophotometer. Fluorescence spectra were recorded above of the mentioned excitation wavelength, using a SPEX Fluorolog 222 spectrophotometer in combination with a 450 W high pressure
POTENTIAL SENSITIVE DYES: PRELIMINARY RESULTS FROM A MACRO-MODEL xenon lamp. For the rather broad band characteristics of UV/VIS spectra, the given numbers reflect the approximate maximum of absorption and fluorescence bands. The
81
absoption maximum of ITO-covered glass appears at 370 nm. A mere yellowish transparent 3HPA film absorbs around 540 nm. absorption maximum [nm]
emission maximum [nm]
methanol [MOP 97]
515.0
704.0
ethanol [MUE 86]
514.5
697.0
soy bean lecitine vesicles [CLR 95]
514.5
618.0
atrium membrane of the rat [LOW 92]
514.5
624.0
atrium membrane of the guinea pig [MUE 86]
514.5
629.0
dimyristoylphosphatidylcholine vesicles [CLR 95]
n.i.p.
695.0
solvent or matrix system
POPC (1-palmityl-2-oleyl-phosphatidylcholin-vesicels): 0.135 mg 452.7 RH421 in a suspension of 50 µl POPC-vesicles, pressed directly (vesicle between two ITO-covered glass slides as a watery suspension, or suspension in dissolved in chloroform and mixed with cyanacrylate, and being H2O) brushed onto the ITO, respectively. polystyrene: approx. 0.2 mg RH421 in 1 ml of a polystyrene toluene paste.
465 to 457
667.0 [490.0]
polystyrene film with a suspension of RH421: solid RH421 mixed into a polystyrene toluene paste .
between 446 and 488
620 + 685 [490]
polystyrene film (tempered): approx. 0.2 mg RH421 dissolved in ethanol and mixed with a polystyrene toluene paste, annealed at 343 K (70°C) for 60 minutes.
493.0
640.0 [490.0]
polystyrene film: approx. 1 mg RH421 dissolved in ethanol, mixed with 1.5 ml of a polystyrene toluene paste.
434 to 444 and 494.5
n.s.
Triton X100 / Tween 80: approx. 0.2 mg RH421 mixed with 250 µl Triton X100 und 250 µl Tween 80.
497.0
n.m.
phenol film: approx. 0.2 mg RH421 in a phenol-water emulsion (0.2%); electrochemical deposition of phenol leads to a yellowish red polyphenol film at +1.2V. The color originates from the polyphenol, though.
around 600
n.s.
RESULTS AND DISCUSSION
82
absorption maximum [nm]
emission maximum [nm]
3HPA film: approx. 0.2 mg RH421 in a watery solution of 3HPA (0.2 g / 15 ml + KCl + K2SO4): cyclovoltammetric deposition at positive potentials (+0.2 V up to +1.3 V, 100 mV·s-1, 10 s vertexdelay, 20 cycles), or directly at +1.3 V; vapor deposited lead counter electrode.
between 505 and 514
n.s.
3HPA brushed with RH421 in ethanol: almost transparent electropolymerized 3HPA polymer film, brushed with a solution of RH421 in ethanol and dried: violett red film.
441 and 491
solvent or matrix system
cyanacrylate (super glue): approx. 0.2 mg RH421 mixed with super glue. acetone: approx. 0.2 mg RH421 dissolved in 1 ml acetone and A) sprayed onto ITO with a paintbrush. After drying, immobilization with super glue. B) Directly sprayed onto super glue. Both films pressed onto the ITO counter electrode. ethanol: approx. 0.2 mg RH421 dissolved in 1 ml ethanol and sprayed onto ITO with a paintbrush. After drying, immobilized with super glue and pressed onto the ITO counter electrode. LANGMUIR BLODGETT film: RH421 embedded into a LB-Film. The film is very prone to mechanical destruction.
between 476 and 493, sattelite at 444.1
3HPA - aniline film: approx. 1 mg RH421 in a watery mixture of 3HPA and aniline: Electrochemical deposition at +1.2 V leads to a polymer film of black color from aniline.
n.s.
n.s.
XI Absorption and fluorescence maxima of RH421 embedded in various matrices. n.m.: not measured, n.s.: not successful, n.i.p.: no information provided, numbers in square brackets: excitation wavelength. Absorption
spectra were recorded with a PERKIN-ELMER Lambda 2 UV/VIS spectrophotometer and analyzed with PERKINELMER UV Winlab software. Fluorescence spectra were recorded with a SPEX Fluorolog 222 spectrophotometer in combination with a 450 W high pressure xenon lamp.
Model systems with fluorescence quenching
viscous polystyrene toluene paste. The bright reddish paste was then pressed between two ITO-covered glasses and let dry over night (evaporation of toluene). Fluorescence spectra were taken five days after preparation. At that time, the film already showed small bubbles. Resulting film thicknesses have not been evaluated, but probably are allocated in the micrometer range. There is also no information about
RH421 in polystyrene
As an example of potential-induced fluorescence quenching in RH421, fluorescence studies of RH421 dissolved in a polystyrene polymer are presented. Approximately 1 mg of RH421 were dissolved in 0.2 ml ethanol and mixed with a
POTENTIAL SENSITIVE DYES: PRELIMINARY RESULTS FROM A MACRO-MODEL
Intensity [counts]
possible short circuits available. In most cases, a finite resistance in the kΩ range could be found between the two ITO electrodes with the RH421 polymer film in between. This indicates local short circuits, probably due to the surface topography of ITO with its regularly protruding spikes. However, fluorescence quenching could only be observed with probes that had such a finite film resistance, whereas ITO electrodes that were completely insulated from each other by the film did not show that phenomenon. When short circuits became dominant, the indiumoxide of the ITO-layers was reduced to greyish indium at the counter electrode at potentials higher than +1.5 V. This sometimes happened
83
during measurements and lead to a drastic decrease in fluorescence intensity. As can be seen from figure 78, fluorescence intensity decreases almost reversibly with increasing and rather high potentials. No shift of the fluorescence maximum could be observed, though. In some experiments, however, the total fluorescence intensity decreased irreversibly with the application of high potentials (> 12 V). At the same time, the fluorescence maximum was shifted to higher(!) frequencies. In cases where reduction of indiumoxide to indium could be excluded, this effect might be interpreted as a structural change of the dye or as its partial disintegration. Theoretically, its extended πsystem could have been abridged by that process.
3000
0V 3V 4.5V 7.5V
2500
9V 2000
12V
1500
1000
500 520
540
560
580
600
620
640
660
680
700
Wavelength [nm] 77 Frame of relative fluorescence intensity vs. wavelength. Potential dependence of fluorescence intensity of RH421 dissolved in a polystyrene film: With increasing potential, there is a decrease in the fluorescence intensity. However, no shift of the
fluorescence maximum can be observed. (All curves will meet at the same base line at larger wavelengths.) The total number of counts of the photomultiplier is very low. This reflects a general problem with potential sensitive dyes: The yield in fluorescence is only within the range of some percent.
RESULTS AND DISCUSSION Intensity [counts]
84 2800
2600
2400
2200
2000
1800 0
1
2
3
4
5
6
7
8
9
10
11
12
Applied potential [V] 78 Almost linear decrease in fluorescence intensity with increasing potential over the polymeric dye film between
the two ITO-covered glass slides. Upper curve: RH421 in cyanacrylate, lower curve: RH421 in polystyrene.
RH421 in cyanacrylate
return to the initial fluorescence intensity is observed after the electrical field has already been switched off. One reason could be related to a hindered reorientation process of the dye within the cyanacrylate matrix due to its high viscosity if a reorientation mechanism in addition to the electrochromic mechanism is taken into consideration. However, no such phenomenon could be observed with RH421 in a polystyrene film, while fluorescence intensities in both systems are of the same magnitude.
With the following system, consisting of RH421 embedded in cyanacrylate (super glue), it can be seen that high potentials sometimes lead to an irreversible decrease in fluorescence intensity. It may be hypothesized that this effect is linked to destructive currents resulting from short circuits over the film. In addition, with this system there is a time-consuming relaxation effect when higher voltages are applied, as shown in figure 79. As a result, a delayed
Intensity [counts]
POTENTIAL SENSITIVE DYES: PRELIMINARY RESULTS FROM A MACRO-MODEL
0V
5600
0V
85
0V 6.2 V
8.5 V
4900
0V
10.8 V 0V 6.3 V
12.5 V
4200
15.2 V
3500
19.4 V 0
10
20
30
40
50
60
70
80
90
100 110 120 130 140 150
Time [minutes] 79 Fluorescence intensity vs. time for RH421 in cyanacrylate: Sometimes, high potentials will decrease the overall fluorescence intensity irreversibly.
Furthermore, the system is showing a sort of hysteresis. After applying higher potentials, the fluorescence intensity does not return immediately to its initial value after the field has been switched off.
RH421 suspension in polystyrene
and this time also shifting to lower frequencies, the maximum at 685 nm is increasing with increasing potentials. After switching off the electrical field, almost the original intensities are observed.
In an experiment with RH421 partly dissolved in a polystyrene film, an opposing tendency of intensity shifts at two wavelengths could be observed. In figure 80, there is a second fluorescence maximum at 685 nm that is counteracting the one at 620 nm, which can be attributed to RH421 dissolved in polystyrene from previous data. (The new maximum at 685 nm might be attributed to solid RH421.) While the maximum at 620 nm is slightly decreasing
With such a system, membrane potentials could directly be calculated through ratiometric data evaluation after an initial calibration. Then, any systematic shifts in the system (drift phenomena due to photobleaching, ...) would be compensated automatically over time.
RESULTS AND DISCUSSION Intensity [counts]
86
first scan without potential 8400
4.5V
7700
7000
6300
5600 600
620
640
660
680
700
Wavelength [nm] 80 Ratiometric change in fluorescence of RH421 embedded as a mixture of partly dissolved and solid dye
in a polystyrene matrix. Applied voltages were 0 V (solid lines) and 4.5 V (bold dashed line), respectively.
Discussion
films might be in the range of 1 µm to 8 µm. Therefore, they are approx. 100 to 800 times thicker than the desired dimensions of a cell membrane.
As mentioned above, the electrical field over the axon membrane reaches 1·107 V·m-1 when an action potential induces a change in the membrane potential of about 100 mV. With potential differences of 1 V to 20 V, the electrical fields in the presented experiments only reach about 104 V·m-1 to 3·105 V·m-1 over film thicknesses in the range of micrometers. Again, changes in fluorescence intensity in native systems may be of the order of 2% to 20% in best case scenarios. From that, the following conclusions can be drawn: The change in fluorescence intensity per volt in RH421 polymeric films is rather low, as is the number of counts of the photomultiplier per second with an average of 60 counts·s-1·V-1. The calculated change in fluorescence intensity is therefore only 2.5%·V-1 in these systems. If that change is related only to the strength of the applied electrical field, the ticknesses of the studied
[Calculation: The absolute change in fluorescence intensity in percent with an applied potential of 12 V is approximately 30%. If a 10% change in fluorescence intensity is assumed for a membrane-bound potential sensitive dye such as RH421, resulting from an action potential of 100 mV over the membrane with thickness of 10 nm, one could say that the thickness of the polymer film with dissolved dye RH421 is equal to 10-9 m · 12 V / 0.01 V = 1.2 µm (rule of three)] However, from a personal point of view, visually the film thicknesses seemed to be lower (occurence of NEWTONIAN rings). Perhaps the small changes in fluorescence intensity may not only be related to film thickness but to other effects that make the
PERFUSION CULTURING CHAMBER AND LIVE-MAINTAINING CONTROLLING UNIT
87
dye less potential sensitive compared to membrane-bound dye molecules.
Design of the culturing perfusion
Taking into consideration that today's digital cameras can take pictures about every 250 µs, the change in fluorescence intensity would drop to 6.75·10-3 counts·s-1. This number seems to be too low to be detectable, unless the initial fluorescence intensity of the dye entrapped in the polymer is higher by a factor of 104 in order to reach a satisfactory signal-to-noise ratio of 10:1. In some cases, such intensities were observed initially (8·106 compared to 5·103). However, they were usually quenched irreversibly at higher potentials above 6 V. Perhaps higher intensities may be gained with higher dye concentrations.
The system design is in some respect the adaption of several functional features from perfusion chambers of GROSS [GRO 94 · GRO 95B] to the micro electrode arrays (MEAs) developed at the Naturwissenschaftliches und Medizinisches Institut an der Universität Tübingen (NMI).
As a concluding remark, it is somewhat surprising that only electrically noninsulating polymeric dye films with a finite resistance were showing potential dependent fluorescence quenching, as already mentioned above. If this observation is not resulting from experimental error, one could think of a current depending quenching mechanism in addition to the proposed field depending mechanism. This hypothesis could to be tested with sending a current laterally through a polymeric dye film.
Perfusion culturing chamber and live-maintaining controlling unit A prototype of an autonomous perfusion cell culturing system has been developed. It fulfills most of the demands as mentioned in the materials section and as sketched in figure 31. Some of the detail features of the realized system are mentioned in the following paragraphs.
chamber
[NMI 99]
81 View of the perfusion chamber mounted on a glass slide.
The actual perfusion chamber configuration consists of brackets (10 mm · 6 mm · 4 mm) which frame a biocompatible silicon rubber gasket (from Dow Corning cryo tubes; ID 9 mm, OD 12 mm, H 1.2 mm) and the capillary cover-glass (15 mm · 10 mm · 1.4 mm) from opposite sides. The brackets are made from a temperature stable material like polycarbonate or glass, and are glued permanently onto the electrode substrate with a suitable thermostable (silicone-) glue (like Loctite™ 5910). They contain one tubular channel each (∅ 1 mm) for the insertion of conducting contact pins. These pins will press the cover-glass from top onto the gasket from opposite sides, thus closing the chamber tightly. One of the brackets might have an additional square channel (3.5 mm · 6 mm · 1.5 mm) at the bottom (below the tubular channel) for inserting a surface mounted device (SMD) temperature sensor (3 mm · 2 mm · 1 mm) soldered onto
88
a flat 3-wire polyimide cable after assembly of the chamber. The cover-glass itself is a composite sandwich structure made from indium tin oxide (ITO) covered glass on top (Merck Balzers Ltd.; thickness of the ITO layer: 60 nm), two or three glass capillaries from gas chromatography (Ziemer; polyimide covered glass, ID 320 µm, OD 420 µm, L 10 mm), a platinum wire (∅ 0.4 mm, L 15 mm), and a cover slip at the bottom. Two diagonal channels (W 0.5 mm, D 0.5 mm) directing toward the center of the glass are milled into the glass on the nonITO side. They will embed the two glass capillaries directing medium and analyte flow into and out of the chamber. A third hshaped channel with the same width and depth is milled somewhere in the central region of the glass. It will embed the platinum wire which will act as a counter electrode for signal recording. The thin glass cover slip is glued with transparent silicone sealant (aquarium sealant) from below onto the milled cover-glass. The silicone sealant has to be cured overnight at elevated temperatures (e.g. 70°C). At the central endings of the capillaries as well as at the ring shaped part of the platinum wire, the cover slip is milled open. That way, the capillaries and the platinum wire are connected to the inner volume of the chamber after assembly. The chamber is assembled in the following manner: After suitable treatment of the electrode area (e.g. with polylysine and/or
RESULTS AND DISCUSSION laminin) and after positioning the gasket on the electrode array, it is filled with a brain slice or dissociated cells to the top. The sandwich cover is then pressed onto the gasket and fixed by the insertion of the two contact pins into the channels of the opposing brackets. The pins are slightly sharpened at their ends to adjust the pressure onto the cover-glass with the depth of insertion. After assembly, the temperature sensor may either be glued on top of the cover-glass with ’superglue‘ (cyanacrylate) or be slipped under the cover-glass through the channel of the bracket. The total chamber volume is approx. 76.5 µl. This perfusion chamber design has many advantages: All components may be autoclaved. Due to the modular design, they are replacable. The assembly process is fast and uncomplicated and does not require any additional tools. All parts can be produced with relative ease and are inexpensive. Gas bubbles, which sometimes form, can be expelled from the chamber with relative ease through the capillaries. The whole chamber is transparent from top (and from bottom if transparent electrode arrays are used), and therefore is accessible to optical investigation techniques. The design is not restricted to a certain size but may be adapted to any electrode configuration (GROSS-system, Panasonic, BOVEN & MÖLLER, systems in microchip design (FET from OFFENHÄUSSER, KOVACS-system)).
PERFUSION CULTURING CHAMBER AND LIVE-MAINTAINING CONTROLLING UNIT
82 Sketch of the perfusion chamber, mounted on a NMItype MEA with total dimensions of 50 mm x 50 mm. The contact pins in the polycarbonate brackets at either end of the chamber are pressing the capillary cover-glass onto a silicon rubber gasket, thus closing the chamber towards the environment. The only openings of the chamber are the glass capillaries in the cover-glass which are intended to perfuse the chamber with fresh medium and analytes. Since the cover-glass is covered with an indium tin oxide (ITO) layer on top, it can be used as a heating element due to its electrically resistive behavior. If a current is applied to the contact pins which press onto the ITO layer, the current will flow through the ITO, thereby heating up the entire cover-glass. The temperature may be measured by a thin platinum resistor, or, as in this case, with an integrated SOT23 SMD temperature sensor. A temperature controller does adjust the heating current, as described below.
Temperature controller
The temperature of the chamber and its contents is controlled by a feedback loop made from a SMD temperature sensor, a comparator-type circuit that ejects a heating current proportional to the difference in set and actual temperatures. The heating current is fed into a resistive layer of indium-doped tin oxide (ITO) which is deposited on top of the cover-glass, thereby heating that resistor. A simple +5V comparator-type circuit with a power operational amplifier (LM759, National Semiconductor) is controlling the temperature of the perfusion chamber. This amplifier has been chosen for it is capable of
89
83 View of the perfusion chamber mounted on the NMI electrode array. The acrylic holding blocks keep the contact pins which contact the ITO surface of the capillary sandwich cover-glass. They are connected to a DC current, thus heating up the ITO-layer due to its inherent resistance. The left black cable leads to the SMD (surface mounted device) temperature sensor glued on top of the heated sandwich chamber glas. The sensor regulates the current flow through the ITO resistor by means of a simple comparator circuit. To the right, the stepper peristaltic pump maintains a constant (yet slightly pulsed) medium flow through the chamber.
providing a rather high current of 325 mA at its output. This will be sufficient to match the desired requirements for heating a resistor with low resistance. With the lack of a feedback resistor, the amplification of the amplifier is set to infinity. A precision centigrade SOT23 temperature sensor (LM45B, National Semiconductor) is feeding a voltage into the negative input of the amplifier. Each degree KELVIN corresponds to an output of 10 mV with an accuracy of ±0.1 K. At 273.16 K, the output potential is adjusted to 0 V. With a potential divider, a combination of a fixed resistor (1.2 kΩ) and a variable resistor (100 Ω), the desired temperature is set at the positive
90
input of the amplifier. Accordingly, a voltage of 10 mV at the positive 'reference' input corresponds to 1 K as well. The magnitude of the potential divider has to be chosen that low to avoid practical offsets between the sensor signal and the set potential. If the signal from the temperature sensor at the negative input is below the set potential at the positive input, a positive potential will result at the output of the amplifier. Its magnitude is proportional to the potential difference between positive and negative inputs. When the difference is still high, the output potential will be high as well. As soon as the signal, coming from the temperature sensor, approaches the set potential at the positive input, the output potential of the amplifier drops rapidly to zero volt. That way, the chamber temperature will smoothly approach the set temperature. To fine-tune the heating rate, the output potential can be adjusted with an additional variable resistor. If the measured temperature exceeds the set value, the output voltage should theoretically become negative. However, the amplifier is fed only with +5 V while the negative supply is set to ground. Therefore, no negative output potential can be generated. This way, the circuit will control rising temperatures only. As a result, the chamber can be cooled by heat dissipation to the environment only which occurs readily when the temperature of the environment is below the temperature of the chamber. For cooling the chamber artificially with a peltier element, the circuit has to be modified slightly to feed the amplifier with a potential of ±5 V.
RESULTS AND DISCUSSION
84 Schematic (comparator-type) temperature controller circuit with the temperature signal entering the power operational amplifier (LM759) at its negative input from the SOT23 precision centigrade temperature sensor (LM45B) while the desired temperature is adjusted with a variable voltage divider (RRef = 100 Ω) at the positive input. For a more precise adjustment, a fixed resistor (RA = 1.2 kΩ) is connected in series with RRef. The supply voltages are +5 V and 0 V. That way, the heating current at the output of the opamp will be positive when the temperature of the chamber is below the set temperature at RRef, and it is zero as soon as the temperature of the chamber is exceeding the set temperature. Furthermore, the heating current will drop steeply as soon as the measured temperature approaches the set temperature. As a result, the increase in temperature will be tuned smoothly around the set temperature by the circuit.
Peristaltic-type medium pump
To minimize spatial dimensions of the whole chamber setup, including temperature controller and medium pump, a laboratory peristaltic pump has been replaced by a miniaturized version based on a stepper motor and a needle-bearing which is mounted onto the motor axis. Pressing soft silicon rubber tubing onto the bearing with a rounded piece of plastic from above, the silicone tube is squeezed at the locations of the somewhat protruding needle-cylinders. That way, a closed compartment in that tube is formed which is being shifted into the direction of revolution similar to the mechanism of a regular peristaltic pump. This stepper pump may be used in a 'push' or a 'suction' configuration. Either arrangement works fine with the perfusion chamber. Semitransparent silicone tubing (KRONLAB, SI0.3NA0.8) with an inner diameter of
PERFUSION CULTURING CHAMBER AND LIVE-MAINTAINING CONTROLLING UNIT 0.3 mm, with a wall thickness of 0.25 mm, and therefore with an outer diameter of 0.8 mm, serves as the nutrient lead to the chamber. Tubes made from Tygon™ R3603 (ISMATEC) with an inner diameter of 0.38 mm and an outer diameter of 0.9 mm, generally used for flow injection analysis, seem to not fulfill long term biocompatibility requirements. Tubing with smaller inner diameters may lead to congestions and general difficulties with fluid transportation. Larger inner diameters require capillary dimensions with outer diameters bigger than 0.42 mm, or space consuming adaptors, respectively, and are therefore not compatible with the proposed chamber design. Alternatively, a simple infusion-type flow mechanism may be considered which does not require any electro-mechanical pump. A medium supply flask might be located above the perfusion chamber. The flow through the tubing to the capillaries of the chamber may be adjusted by a clip. The disadvantage of this strategy is the lack of fine-control of the flow. As a variation, the medium could be stored in a syringe. A rubber band would press the pistil down. Thus, the medium supply does not have to be stored in an elevated position. However, the pressure from the rubber band onto the piston will diminish with the decrease in volume. As a result, the flow will not stay constant over time.
91
85 Picture of an early version of the stepper motor media pump: the somewhat elevated and protruding metal cylinders of a needle bearing (black circle on the motor axis: front of the bearing) press against the rubber tubing from above, thus squeezing the tube locally. As soon as two cylinders are touching the tube, a small compartment will separate a distinct volume from the rest of the liquid. While rotating the bearing, that compartment travels into the direction of revolution. It will open first on its front, thereby expelling the liquid towards the direction of revolution, while the second cylinder is still forming the rear wall of the compartment, thus preventing the liquid to travel backwards. Depending on the inner diameter of the tube and on the adjusted stepper speed, the pumping rate may be adjusted easily to 0.2 ml up to 20 ml per day.
Combined temperature and motor controller circuit board
A stepper motor driver integrated circuit (SAA1042, Motorola) is generating the stepping sequence for a two-phase stepper motor in bipolar mode. The stepping frequency is controlled by a timer IC (LM555, National Semiconductor) which sends a TTL-pulse of defined frequency to the stepper IC. The timing of the timer is adjusted by a combination of a variable resistor and a fixed (or variable) capacitor.
92
RESULTS AND DISCUSSION backwards, the temperature sensor to the circuit board.
86 Stepper driver circuit: A timer IC (LM555) is controlling the stepping frequency of the stepper IC (SAA1042) with a digital signal (3:clock → 7). The stepper IC is generating the appropriate stepping pattern for a bipolar stepper motor (at 1,3,14, and 16 → M). In addition, the motor direction (Fw/Bw: forward/backward) and the step width (H/F: half/full) may be controlled digitally through switches with the same IC. The frequency of the timer, f = 1.44/[(R1+2R2)·C], may be adjusted with a variable resistor (R1 or R2). In this case, they have been chosen as R1 = 1 MΩ, R2 = 1kΩ, and C1 = 10 µF for stepping frequencies between 0.1 Hz and 10 Hz. Other parameters are: RB = 56 kΩ, C2 = 0.01 µF.
The electronic circuits for controlling the temperature of the perfusion chamber and the speed of the stepper motor peristaltic pump have been combined on a single circuit board. It fits around the stepper motor and is covered by a plastic box. The voltage supply of +5 V has to be attached externally. Telephone wiring with western plugs is connecting the circuit board to the heating element of the perfusion chamber, and
87 Picture of the combined motor and temperature controller with switches for motor-on/off, device-on/off, motor-forward/reverse, half/full-step (small switch), and two fast-toggle choices of slow/fast-mode motor operation. A seventh switch toggles the voltmeter display between set temperature and actually sensed temperature. At the top right side, the western telephone socket is shown which connects the board to the temperature sensor and to the ITO-heating resistor. Variable on-board resistors adjust timer speed (top left), heating rate (middle), and desired chamber temperature (middle right). Right to the five switches there is the timer IC NE555. At the right bottom there is the power amplifier LM759 for temperature control. Below that (partly shown) there is the stepper driver IC SAA1042. The display adapter (not shown) is installed on top of the stepper motor whereas the driving circuit board is placed vertically behind the stepper motor.
PERFUSION CULTURING CHAMBER AND LIVE-MAINTAINING CONTROLLING UNIT
88 Actual view of the experimental setup as sketched above with micro electrode array (MEA, NMI) and mounted perfusion chamber, being kept on a separate polycarbonate tray, including the wiring for the temperature sensor and for the supply with heating current. A stepper motor driven peristaltic pump carries the medium from the supply flask to the chamber, and from there to the waste container through thin silicone rubber tubes. This pump may be configured either for suction or for pumping depending on its position related to supply, chamber, and waste. The motor housing contains all the electronics for motor and temperature control and
93
is connected to the MEA tray through telephone wiring. That way, the plastic MEA frame can be handled on a microscopic table independently from the bulkier motor block. A LCD panel displays either the actual or the adjusted temperature. Several switches are assigned to various functionalities like on/off, two motor speeds, motor step width, forward/backward operation, and adjusted/actual temperature display. The temperature, the coarse motor speed, and the heating current may be adjusted with variable resistors which are accessible with a screw driver. This arrangement is providing the necessary flexibility for simultaneous electrical and microscopical investigation.
RESULTS AND DISCUSSION
94
Biocompatibility study of materials in contact with cells Since in the beginning all cell cultures died rather rapidly in early designs of cell culture chambers, although they were stored in the incubator, and although the medium and all other culturing conditions were equivalent to those of reference cultures in regular 24-well culturing trays, the source of the nonbiological intoxication had to be investigated. It became clear that only the used materials could be the origin of contamination. Therefore they had to be tested with respect to their biocompatibility. For that purpose, autoclaved fragments of the chamber, as well as tubing and sealing parts were added to cultures in regular 24well culturing trays. Cell development was evaluated after one and two days in culture. A material was considered as biocompatible, if that particular culture did not develop differently from a reference culture without any additives. A misinterpretation had occured only in one instance. A small piece of thin Tygon™ tubing did not affect cell growth in culturing dishes, but apparently released enough harmful chemicals (solvents?), when small amounts of culturing medium were traveling through the tubing to the perfusion chambers lateron, coming into contact with a large inner surface of that tubing. The following table categorizes the materials tested so far.
Suitable materials
White silicon rubber sealing rings from Dow Corning® cryo tubes [sealing rings for the perfusion chamber] Loctite™ silicone flange sealant 5910 WPI® KwikSil™ two component silicone sealant Semi-transparent silicone rubber tubing [medium supply] Plastic syringes [medium storage] Parafilm™ Teflon™ and PTFE sealing tape Less suitable materials
Aquarium silicone sealant, which seems to be biocompatible after prolonged curing or when present in little quantities only [ITO sandwich cover-glass] Black rubber plugs from syringes, when used in larger quantities [medium storage] Bioincompatible materials
Silicone sealant TSE 399C from Toshiba® Dental impression material [sealing rings] Most regular black rubber sealing rings Tygon™ flow injection analyzer tubing [medium supply] XII Biocompatibility of selected materials that were considered to serve as parts of the perfusion chamber.
SURFACE MODIFICATION FOR PROMOTED CELL ADHESION
95
Surface modification for promoted cell adhesion Potentiostat
A simple potentiostat for computer controlled electropolymerization has been developed. The desired voltage ramp is fed through one of the two D/A-ports of the Keithley® DAS 1800 HC board into the first operational amplifier (OP602AB, Burr Brown). The electrochemical cell can be thought as three resistors, representing the internal resistance of the electrolyte. One resistor connects the counter electrode with the reference electrode, the second connects the reference electrode with the working electrode, and the third resistor connects the counter electrode with the working electrode (as described in the method section: cyclovoltammetry). The measured current will be converted to a voltage signal by the second operational amplifier (OP602AB, Burr Brown). The signal amplitude has to be amplified in order to stay above the resolution limit of 1.25 mV of the A/D-dataacquisition board. The amplification depends on the choice of the resistor Rreference in the feedback loop. The desired size of Rreference can be calculated by the simple equation Uout = - Imeasured · Rreference, keeping in mind that the utmost limits of the A/Dboard are ±10V. Working with a supply voltage below ±10V, the detection limit is confined by the supply voltage. An offset voltage may either be applied externally through the second D/A-channel or it may be simulated by the software.
95 Top view of the single channel potentiostat for computer controlled electropolymerization as depicted schematically in figure 23. There is a 3.5 mm stereo socket for a ±5 V power supply (top left) with a ground connector to the A/D-board of the computer. To the right, there are two operational amplifiers, one acting as the potentiostat, and the other for current-voltage conversion and simultaneous amplification of low currents (typically a few microamperes for electrode surfaces of about 2 25 mm ). A reference resistor Rref (middle) determines the amplification of the recorded current. It has to be adapted manually. Two variable resistors (100 kΩ between pin 1 and 5) may be used to collimate the offsets of the amplifiers. At the right hand side, there are the three wires for the reference electrode, the working electrode, and the counter electrode, respectively. On the bottom, there is the connector to the A/D-D/A-board which is hardly visible.
The presented circuit can be used for common electroanalytical methods like cyclovoltammetry and differential pulse voltammetry. The evaluation of the experimental strategies depends only on the method the potential is applied, and on the way of reading the measured currents. Both can be programmed by software. For reference measurements, a commercial potentiostat was available (PARC EG&G 273 potentiostat/glavanostat with M278 software package (MS-DOS)).
96
Polymerization and cyclovoltammetry software
The potentiostat controlling software has been designed conventionally. A potential ramp can be generated with different scanrates, various equilibration and vertexdelays, and varying resolutions, which are determined by the incremental step sizes. The number of subsequent ramps can be set
RESULTS AND DISCUSSION as well as an offset voltage, if necessary. For proper calculation of the measured current, the reference resistance of the potentiostat has to be entered. Its size depends on the current flow which itself is determined by the size of the electrode that is covered by the polymer. Therefore, the resistor has to be exchanged in case of choosing a substrate with different dimensions.
96 Hardcopy of the potentiostat controller software for a ™ single channel potentiostat, realized with Testpoint . An
arbitrary signal may be generated and be fed into the potentiostat. The cyclovoltammogram will be recorded simultaneously.
Electrode clamps for individual
covered glass plates with one polymer each. The second setup was intended to cover square indium-tin-oxide covered glass plates with dots of different polymers simultaneously for comparative analysis of their adhesion promoting properties. The third chamber, made from a glass ring glued onto an ITO glass plate, is used for
electropolymeric film deposition
For electropolymerization, three types of electrode clamps made from polyacryl have been used. The first one served for plating interdigitated electrodes or indium-tin-oxide (ITO)
SURFACE MODIFICATION FOR PROMOTED CELL ADHESION electropolymerization as subsequent cell culturing.
well
as
for
As depicted in figure 15, a regular three electrodes setup for electropolymerization was used (with a platinum electrode comb as the working electrode, contacted by a platinum wire, with a reference electrode made from a silver chloride covered silver wire, and with a counter electrode made of a simple platinum wire or platinum strip, respectively). This setup has been chosen to
97
control precisely the applied voltage with the potentiostat. With looking onto the simultaneously recorded cyclovoltammograms, the optimal deposition parameters (regarding the upper and lower voltage limits) and appropriate applied voltage patterns could be determined. Two versions of polymerization chambers were used. Both served for electropolymeric film generation on interdigitated electrodes or on small rectangle ITO-covered glass plates.
97 Picture of the electropolymerization well with a single electrode clamp. The working electrode (middle), made of a platinum wire with a diameter of 0.5 mm, is simply pressed from top onto one pad of the interdigitated electrode structure or onto the indium-tin-oxide coating of a glass plate, respectively. The reference electrode (top) is a silver wire with a diameter of 0.5 mm, covered with silver chloride through a preceding, one time oxidative electrolysis of the silver wire in 0.1N HCl over 20 minutes at 1.1V. The counter electrode (bottom) is a platinum wire with a diameter of 0.5 mm or a combination of that wire with a platinum foil wrapped around the wire to obtain a larger geometrical area. The bath for the electrolyte is made from polyacryl glued onto a microscopy glass cover sheet with a silicone elastomer. The dimension of the well is approx. 25 mm · 30 mm · 5 mm.
98 Picture of the second electropolymerization well, again with a single electrode clamp. The working electrode (middle) is a regular miniature 'crocodile' clamp, contacting one pad of the interdigitated electrode structure or the indium-tin-oxide coating of a glass plate, respectively. The reference electrode (right) is a silver/silver-chloride coated wire with a diameter of 0.5 mm. The counter electrode (bottom) is a thin platinum foil. The bath for the electrolyte is made from polyacryl glued onto a microscopy glass cover sheet with a silicone elastomer. The chamber has dimensions of approx. 10 mm · 30 mm · 8 mm.
While the first and the second setup allow electropolymerization on removable electrode plates which have to be transferred to regular cell culturing dishes, the third chamber is used for electropolymerization as well as for subsequent cell culturing. A
round glass ring with an inner diameter of 20 mm and a height of 6 mm is glued with a biocompatible silicone elastomer (Sylgard™ 184) onto the ITO-covered side of a rectangular glass plate with a size of 25 · 25 mm2, and is cured for 24 hours at
RESULTS AND DISCUSSION
98
approximate circular area that had been modified with the polymer was about 80 mm2 in each case. Only the CV for 3HPA-KK-SRARKQAASIKVAVSADR had been recorded on an interdigitated microelectrode structure. [A]
70°C. A horizontal beam made from polyacryl with two mounting notches and two holes for the Ag/AgCl reference and the Pt counter electrode is then put on top of the glass ring. The well is filled with the monomer-containing electrolyte until the two electrodes come sufficiently into contact with the solution. By playing with electrolyte volumes, it is possible to cover only half of the bottom of the well. That way, an internal reference for comparing the adhesion promoting properties of the polymer film with the uncovered areas can be generated.
20µ 0 -20µ -40µ -60µ -80µ -100µ -120µ -140µ 1.2
1
0.8
0.6
0.4
0.2
0
-0.2
-0.4
[V]
[A]
100 Phenol (5 cycles between -0.4 V and + 1.3 V with a -1 scan-rate of 100 mV·s )
3m 0 -3m -6m
Cyclovoltammograms of the electropolymerizable coupling agents
The following cyclovoltammograms (CVs) show the electrodeposition of pure monomers, namely 3HPA, pyrrole, 3HBH, 3HBA, and 2(3HP)E from a 0.2 molar solution in water with 0.5 molar KCl as the supporting electrolyte onto ITO-covered glass slides, each. Concentrations given for phenol and pyrrole are the ones after weighing, for these substances do not dissolve completely in water. The concentration of the 3HPA-KK-SRARK QAASIKVAVSADR was 100 µg·ml-1. The
-9m -12m -15m 1.2
1
0.8
0.6
0.4
0.2
0
[V]
101 Pyrrole: increasing currents with an increasing number of cycles (10 cycles between -0.1 V and + 1.4 V -1 with a scan-rate of 100 mV·s ) [A]
99 Schematic view of the glass well on a rectangular ITOcovered glass plate. On top of the central ring, a polyacrylic beam with the reference (left) and the counter electrode (right) is placed for electropolymerization. A miniature clamp (bottom right) contacts the ITO-layer otuside of the well. After removing the beam, alcohol sterilization, and drying, the well can be filled with the cell suspension for adhesion studies. The well is then covered with a thin glass cover slip to avoid contamination.
800µ 400µ 0 -400µ -800µ -1m -2m -2m 1.2
1
0.8
0.6
0.4
0.2
0
[V]
102 3HBH (10 cycles between -0.1 V and + 1.4 V with a -1 scan-rate of 100 mV·s )
[A]
SURFACE MODIFICATION FOR PROMOTED CELL ADHESION
800µ 400µ 0 -400µ -800µ -1m -2m -2m 1.2
1
0.8
0.6
0.4
0.2
0
[V]
[A]
103 3HBA (10 cycles between -0.1 V and + 1.4 V with a -1 scan-rate of 100 mV·s )
800µ 400µ 0 -400µ -800µ -1m -2m -2m 1.2
1
0.8
0.6
0.4
0.2
0
[V]
[A]
104 2(3HP)E (10 cycles between -0.1 V and + 1.4 V with -1 a scan-rate of 100 mV·s ) 8µ 4µ 0 -4µ -8µ -12µ -16µ -20µ 1.2
1
0.8
0.6
0.4
0.2
0
[V]
[A]
105 3HPA (20 cycles between -0.1 V and + 1.4 V with a -1 scan-rate of 100 mV·s ) 400µ 200µ 0 -200µ -400µ -600µ -800µ
1.2
1
0.8
0.6
0.4
0.2
0
99
With the exception of phenol, in neither case any distinct redox-peaks can be found. Nevertheless, from the decrease in current between the first, the second, and the nth cycle, it can be concluded that a thin polymeric film has been deposited. The two extreme cases are the formation of an electrically insulating polyphenol monolayer on the one hand, and that of an electrically conducting polypyrrole multilayer on the other hand. While the CV of the electrochemical phenol polymerization is showing a single oxidation peak in the first oxidative sweep only, and neither any reduction peak in the reductive sweep nor any peaks in all subsequent cycles, in first approximation no FARADAIC current will flow in any following cycles. (Any currents other than zero may be attributed to capacitive currents.) This behavior is indicating the formation of an entirely closed and electrically insulating monolayer of a (at these potentials) transparent polyphenol film that inhibits any further electrodeposition. This assumption can be verified by trying to electrodeposit a different monomer like pyrrole or a metal layer like copper onto the electrode. [MCK 99] In case of pyrrol, no black polypyrrole will be generated. In addition, impedance spectra will show a characteristic change due to the new dielectric situation (not shown). The opposite extreme can be observed with pyrrole. This compound will form electrically conducting layers and therefore can be grown almost indefinitely to thick polypyrrole deposits. As a result, the CV does show increasing currents with subsequent cycles.
-0.2
[V]
106 3HPA-KK-SRARKQAASIKVAVSADR on an interdigitated microelectrode structure (20 cycles between -1 -0.2 V and + 1.2 V with a scan-rate of 100 mV·s )
The CVs of all other studied monomers are located somewhere inbetween. Since the resulting polymers are all electrically nonconducting, a decrease in the CVs with subsequent cycles can be found. However,
RESULTS AND DISCUSSION
100
apparently no closed monolayers are formed within the first cycle, as observed with phenol. Lower, but detectable currents are indicating electrodeposition with increasing numbers of cycles until a limiting current has been reached. This might be interpreted as the point of cessation of the electrodeposition. The CV of peptide modified 3HPA is almost identical to that of 3HPA itself. The only difference is a slower decrease in currents with an increasing number of cycles. This finding might have different independent reasons. Firstly, amino acids in the oligopeptide chain might be oxidized as well, especially tryptophane (W) and tyrosine (Y), as observed by MACK. [MCK 99] Secondly, the electrodeposition might be kinetically hindered for sterical reasons: Since the monomers are much more bulky in contrast to 3HPA, diffusion to the electrode surface is impaired. For stochastic reasons, the probability of a successful formation of a reaction couple is decreased significantly. [RÜH 97] In the beginning, this will lead to rather small and loose polymer patches that will drift laterally on the surface before being finally trapped by electrochemically caused agglomeration. The final polymer layer seems to be closed, though, as can be seen on figure 115. However, as judged from the staining, the polymeric border lines do not seem to be as sharp as one would expect. This observation is coherent with the assumption of lateral drift phenomena. That way, a much more extended polymer film will be generated that reaches beyond the actual area of the electrodes. No quantitative verification has been undertaken yet to support these two hypotheses. Furthermore, SFM and SEM measurements suggest small defects in the polymeric
layers, most likely due to the considerable roughness of the ITO surface. [WEI 99] Thicknesses of the generated polymer films on ITO monomer
film thickness (α α−stepper) [nm]
film thickness (SFM) [nm]
3HPA
8 to10
7
2(3HP)E
20 to 30
28
3HBA
5 to 20
22
3HBH
15
6
XIII Evaluation of film thicknesses of electrochemically generated polymeric films on ITO by different methods. α-stepper (Tencor Alpha-Step 500 Profiler with a vertical resolution of 1 Å, and a lateral motility of 100 mm) and SFM (NANOSCOPE IIIa/DI, Digital Instruments, in contact mode with a Si3N4 cantilever, type D, PARK, with a length of 220 µm, a width of 22 µm, and a spring -1 constant of 0.03 N·m ) α-stepper and SFM measurements have been performed by C. WEINL and E: NADLER. [WEI 99]
Characterization of the cell networks Influence of the cell culture medium on cell growth, cellular differentiation, and network formation
Two different medium types were tested for their suitablity to grow neurons from the CNS of the embryonic chicken in culture. As a base medium, minimum essential medium (MEM, Gibco Life Technologies) with 33.3 mM glucose and 13.1 mM NaHCO3 for buffering the pH at 5% CO2 in the incubator has been used. For adhesion studies, a Neurobasal™ medium (NBM, Gibco Life Technologies) with 0.5 mM L-glutamine, already adapted for 5% CO2, was used. It had been especially developed by BREWER et al. for defined serum-free hippocampal cultures of embryonic rats. [BRW 93 · BRW 95]
CHARACTERIZATION OF THE CELL NETWORKS
101
It turned out that it is equally suitable for cultures of neurons from the dissociated brain of embryonic chicken.
different media for comparative studies. The influence of additives onto growth, differentiation and long-term survival was of interest. It should be noted, that the results are not unambiguous for the many cultureimmanent and external parameters that do not allow to grow cultures one like the other. Besides slight and unavoidable variations during preparation, the exact time of extraction seems to play a role. Furthermore, not all embryos are developed the same way, even when incubation started exactly at the same time.
For cell growth, cell differentiation, and long-term survival, various supplements have to be added. On the one hand, serum from fetal calfs and/or from horses can be added up to 10% (v/v), each. With serum, cells usually grow vigorously on ITO or MEAs as long as they can find the right attachment factors on the substrate (like PDL, laminin, ...). On the other hand, for more defined initial culturing conditions, e.g. for adhesion studies, an artifical supplement mixture (B27, Gibco Life Technologies), also developed by BREWER et al., may be added to either medium type. All media had been adapted to a initial pH of 7.35 if necessary. Neurons have been extracted from embryonic chicken between day 7 (E7) and day 10 (E10). Embryos younger than E7 are not sufficiently developed and rather small. It is also very difficult to separate the brain, which is kind of a bubble, from neighboring tissue at that stage. Brain tissue from embryos that are older than E10 is still suitable but it turns out that the caused damage to the tissue during extraction and preparation cannot be compensated as easily as with tissue from younger embryos. Neurons from older chicken apparently are much more differentiated already. Therefore, it seems to be much more difficult for them to regenerate in culture and differentiate from new. The optimal age seems to be that between E7 and E8. Cells at that date tend to have the entire potential to regenerate and are easily to extract. They do survive the stressful extraction and seeding procedure best. Neurons have been cultured in regular 24well culturing trays and on ITO with
Healthy neurons from the brain of embryonic chicken have a smooth and transparent, mostly oval, and somewhat flattened appearance. They start to visibly differentiate within the first 6 hours of culture. During that time, they also move around on the substrate to find their final position. If the adhesion to the substrate is good, cell wandering does almost not occur. Dying neurons change color to yellowish with brown contours and take on a grainy to shrivelled appearance, until they finally detach from the substrate. Usually neurons pool in loose aggregates of 3 to 20 cells, depending on the seeding density. Those aggregates tend to interconnect within 24 to 60 hours. If the substrate does not provide adhesion anchorage, cells cluster in heaps of 30 to 200 cells. Usually only cells at the outer edge of those cluster, lying close to the substrate, will show signs of differentiation. However, axon growth from those clusters in most cases is faster than that from aggregates. If culturing conditions are right within the first 10 to 15 days, those clusters will spread to form carpets or dense aggregates. It coincides with the appearance of glial cells in serum-free cultures. At that stage, the culture is very mature, rather invulnerable,
102
RESULTS AND DISCUSSION
and tolerant to more drastical environmental changes. Cell growth in Cell+ culturing wells
24-Well Cell+ tissue culture plates (Sarstedt) are probably made from polystyrene and are coated with an unpublished adhesion promoting layer. In MEM without any further additives than glucose and sodium bicarbonate, cells stay disperse and transparent. Differentiation is only fair (5 to 10%), even after 4 days in culture (dic). The lengths of rather tenuous axons is between one to four cell diameters. Cultures usually do not survive for longer than a week. The addition of the defined serum replacement B27 leads to some improvement regarding development and longevity. Nevertheless, differentiation is still only fair (5 to 35%) after 4 days in culture, and cell survival strongly depends on cell density. If the cell density is below 105 cells per ml, on the average only 40% of the cultures will survive for more than two weeks. Rather good results have been obtained with Neurobasal™ medium (NBM), containing the recommended amount of 0.5 mM Lglutamine and twice the amount of the recommended serum replacement B27. Cell survival after extraction seems to be around 50 to 70% (tested with 5% trypane blue). Although cells show slower development and differentiation and have much thinner axons than in medium that contains serum, networks cannot be distinguished from those in medium with serum after 14 to 21 days.
107 Neurons after 108 days in culture in serum-free NBM+B27 medium. Stable network that lived on Cell+ plates for another 2.5 months.
NBM with only the regular amount of B27 does work as well but chances that a culture grows older than two weeks seemed to drop by 40 to 60%. The best results have been achieved with NBM and 10% of fetal bovine serum. In that medium, cells develop at amazing speeds compared to cultures with the serum replacement or without serum. Networks start to form within the first three days and longevity is almost guaranteed when half of the medium is replaced by new medium every 3 to 5 days. Cell growth on ITO and MEAs
There is a big difference in cell growth and cell development when cultures are grown on substrates other than pretreated culturing wells or petri dishes. Cells under serum-free culturing conditions do not survive on untreated ITO or MEA plates for longer than four days. Only in rare instances, emerging differentiation may be observed. Nevertheless, cells stay quite dispersed and prefer to form aggregates rather than clusters on ITO. If the substrates are treated in the usual manner with PDL and/or laminin, possibly after
CHARACTERIZATION OF THE CELL NETWORKS
103
hydrophilization with the help of a torch, cells did cluster unexpectedly as clumps of 10 to 30 cells in serum-free cultures. Differentiation occured only rarely and the cells usually died within one week. This is a very unusual but persistent observation, since laminin and PDL should act completely differently by promoting cell dispersion, cell attachment, and cell survival. Instead, the neurons were even unhappier on such treated substrates than without PDL and/or laminin.
Adding those buffers to medium containing serum does not affect cell-development noticeably, whereas in serum-free medium cells are more sensitive to higher concentrations. They tend to take on a grainy appearance and die off after two days.
In contrast, neuron development, differentiation and survival is excellent on PDL+laminin-treated substrates when cells are cultured in medium containing 10% (v/v) fetal bovine serum. In that case, no difference can be seen between cultures in plastic dishes and those grown on ITO or MEAs. If the substrates have not been modified by PDL+laminin, cells will cluster in rather huge heaps of 40 to 150 cells. Nevertheless, strong axons will sprout from the outer edges of those clusters and interconnect them after a few days over distances of up to 300 cell diameters. When those cultures grow older, and after a supportive glial carpet has formed, the clusters will unravel and cells will start to distribute homogeneously. Choice of alternative pH buffers
For stabilizing the pH in cultures that were not stored in the 5% CO2 incubator, alternative buffer systems have been investigated. HEPES is suitable up to a concentration of 40 mM. Also, a phosphate buffer system is appropriate up to a concentration of 90 mM. However, these concentrations are not sufficient for long term buffering of pH. They may only stabilize the pH of the medium during its flow through the supply tubing, e.g. from medium stock to the perfusion chamber.
Influence of other additives
To increase longevity in serum-free cultures, 25 µM 2-mercaptoethanol had been added as an anti-oxidant following studies by GRILL et al. [GRL 93] und ISHII et al. [ISH 93] However, no visible effect could be detected onto longevity or cell development. The same holds for additional ascorbic acid (vitamin C) in concentrations of up to 0.2 mM. During the first four days in culture, an addition of 81 µM glutamic acid indeed speeds up neuron differentiation for about 10 to 20% in serum-free culture. Glutamate acts as a excitatory neurotransmitter and therefore probably supports neuron development and differentiation during the first few days. However, thereafter it becomes toxic to adult neurons. Apparently glial cells manage to stay dormant during the first 7 to 10 days in serum-free culture, for they seem to appear as soon as a rather stable neuronal network has developed in moderately to highly dense cultures. Influence of electrical fields onto cell growth and cell differentiation
No positive effect of applied positive voltages of 5 mV or 900 mV, respectively, to the ITO electrodes has been observed regarding cell attachment and cell differentiation, neither in serum-free nor in serum-containing cultures. The idea was to provide positive surface charges by capacitively charging the electrode, thereby mimicking the adhesion promoting influence
104
RESULTS AND DISCUSSION
of positively charged chemical substances like that of polyamino acids (PDL, polyornithine, ...). [JAC 77] No final conclusion can be derived though, because it is still possible that electrical fields might support the adhesion-mediating properties of regular adhesion-promoting substances. Results from 'standard' strategies: Influence of secondary factors to cell adhesion
Adhesion and/or growth promoting properties, in general attributed to substances like PDL or laminin covered surfaces, apparently do not depend exclusively on the substances themselves (only a necessary but not a sufficient condition) but rather on their interaction with secondary, probably mediating factors, which are contained in serum-enriched nutrient media. It has been shown in several experiments that physisorbed PDL and laminin films, used separately or in combination, do not show any adhesion promoting properties with dissociated brain cultures from embryonic chicken at day 7 to 10 in serum-free Neurobasal™ medium (NBM+B27, Gibco Life Technologies). On the contrary, cells tend to cluster (20 to 50 cells), and in general do not show any differentiation. Very rarely cells do form kind of aggregates of 5 to 10 cells and show a few weak axons in best case scenarios.
108 Best case culture after two days in vitro on a PDL+laminin layer in serum-free NBM/B27 supplemented medium: only a few cell aggregates show weak axons. Usually cells tend to cluster without showing any differentiation on PDL+laminin layers, on PDL layers, or on laminin layers alone if they are grown in serum-free NBM+B27 medium.
109 Typical scenario with neurons grown on a PDL+laminin layer in serum-free NBM+B27 supplemented medium after two days in vitro: cells tend to cluster without any differentiation. There is no difference in their appearance whether they are grown on PDL+laminin, on PDL, or on laminin alone.
In contrast, cells grown on a PDL+laminin layer in NBM+B27 containing serum (fetal bovine serum, Gibco Life Technologies, 13:4 (v/v)) do adhere nicely and show vivid differentiation and network formation
CHARACTERIZATION OF THE CELL NETWORKS
105
tendencies after 2 days in culture. That result hints at the possibility that the adhesion promoting properties of PDL and the adhesion promoting as well as growth inductive properties of laminin act only indirectly or at least only in combination with certain proteins that are contained in the serum.
the pH will rise within the silicone rubber tubing due to evaporation of CO2 through the tubing walls to a degree that becomes toxic to the cultures. In addition, cultures seem to prefer a sudden, but drastic medium exchange (e.g. once or twice within one or two days, respectively) than a constant replenishment of nutrients. Presumably, neurons strongly depend on signalling and conditioning metabolites that they excrete themselves and that are not contained in fresh medium. Therefore, the initial constant flow strategy had been changed to a stopflow exchange of 50% of the medium every 24 hours. That way, the cultures survived for longer than 3 weeks within the perfusion chambers. Usually they only died for technical reasons (failure of the temperatur controller or loosening of the holding brackets).
110 Cells grown on a PDL+laminin layer after two days in culture, this time with NBM+B27 medium that contained 10% fetal bovine serum. The cells are much stronger and bigger and do show vivid differentiation and network formation.
Morphology and survival rate of cell cultures grown in perfusion chambers
Choosing the right parameters (temperatures below 38°C, timed interval medium flow of 20 µl to 60 µl per day, phosphate buffered and serum-enriched medium (10% (v/v))), the culture enclosed in the perfusion chamber does develop in the same way as it does in a cell culture dish or in the perfusion chamber without perfusion when stored in the incubator at 5% CO2. However, if there is a continuous medium exchange with insufficiently buffered medium from supply, cultures will die within one to two days. It might be assumed that even under slow but constant flow conditions of only 0.5 µl·min-1
It is rather difficult though to culture cells on MEAs with serum-free medium in those perfusion chambers. Although, in general, they develop normally within the first 48 hours, with high probability they will die thereafter. However, this fate is not restricted to cultures grown in perfusion stations but also happens to serum-free cultures grown in perfusion chambers that are stored in the incubator. Almost the same is true for serum-free cultures grown in glass-ring pools in the incubator. This observation is strongly suggesting that the MEA substrate itself is mostly responsible for the early death of cultures in serum-free medium. Impact of entrapped air bubbles
It should be noted that cells being entrapped under air-bubbles within the perfusion chamber will arrange themselves to form a unifom closed carpet of non-aggregated single cells. Axons from neurons at the outer edge of the air bubble will grow towards its
106
RESULTS AND DISCUSSION
center. Usually cells survive under these conditions only for two days. If the airbubble has been removed by then, nice neuron patches will grow on these spots. Otherwise, cells will die probably because they are drying out due to inhibited diffusion of medium towards the center of the bubble. It has been not possible to control the sizes of the bubbles over time. Usually they grow bigger, thereby killing the neurons at their center first. Cultures grown on MEAs in serum containing medium
While neurons are almost not to culture in serum-free medium on MEAs, where they hardly differentiate and die within the first 4 days at the latest, especially if the MEAs are coated with PDL and/or laminin, neurons grow and develop vigorously in serumcontaining medium on MEAs with physisorbed PDL+laminin coatings. Nevertheless, cell development is difficult to influence over time. Some cultures will form dense carpets of interconnected networks while others tend to suffer from sometimes unknown changes in their environment. Usually dramatic changes occur after 3 days at the earliest. During the first three days, independent from the substrate, there is almost no difference in culture morphology, unless there are drastic differences in cell densities.
111 Medium-dense cell culture on a MEA without any surface modification after two days in vitro, grown in a glass ring pool. Loose aggregate have formed that are somewhat interconnected. Culture morphology does not indicate any major insufficiencies.
112 Same culture as in 111 after 7 days in vitro: cells became very unhappy with the substrate and clustered visibly. Although those clusters are still interconnected, such a culture will usually die within the following 3 to 5 days. However, in rare cases, conditions improve with a medium change. Then, the cell heaps will loosen up and spread over the adjacent empty areas again.
CHARACTERIZATION OF THE CELL NETWORKS
107
para-formaldehyde, stained with a 2% solution of DiI in ethanol and evaluated under a non-inverted Zeiss Axiophot™ fluorescence microscope. Lateron, adhesion experiments with electropolymerizable laminin epitopes were performed on ITO electrodes in serum-free Neurobasal™ medium with B-27 additive. The cultures were neither fixed nor stained but evaluated after two days in culture with an Olympus BH stereo microscope.
113 A different, somewhat denser culture than in 111, this time with a physisorbed PDL+laminin coating on the MEA, after four days in vitro. Cells are grown in a glass ring pool on the MEA as well.
114 Same culture as in 113 after 7 days in vitro: although cells in less dense areas (upper left corner) have moved away, overall culture morphology has not changed dramatically.
Effect of peptide fragments
Two different serum-free media have been used for laminin-epitope studies. In early experiments, cells were grown on interdigitated platinum electrode structures in S4 medium that does not contain any relevant protein additives. [STL 93] After two days in culture, cells were fixed with 5%
Effects of electrochemically immobilized peptide epitopes from laminin on platinum in S4 medium
Electropolymerization of 3HPA-epitope monomers onto interdigitated platin comb electrodes led to slightly preferred cell adhesion and cell development on those modified electrodes with respect to unmodified reference electrodes. However, in best cases, the difference did not exceed a factor of two with respect to cell adhesion. In some cases, the heating electrode on the back side of the electrodes had been modified for its larger surface area. However, no direct statement could be made with respect to a semi-quantitative evaluation of successful adhesion. Cultures were fixated with 5% para-formaldehyde after two days in culture (S4 medium) and stained with a 2% solution of the membranebound fluorescence dye DiI. Modification of the electrodes could be verified qualitatively by simultaneously staining the polymer with the same dye. While peptide modified electrodes appear as bright stripes on the substrate under fluorescenct light, unaltered electrodes have a black color. Sometimes, contact between the potentiostat and the electrode had failed. On those structures, all electrodes appeared as black stripes after staining and usually cells did not adhere at all.
108
115 Interdigitated electrode structure: the peptidemodified electrode comb has a bright appearance (from top) while the unmodified 'reference' electrode is black (from bottom). The sapphire substrate appears in an intermediate grey level between the electrodes. Towards the bottom of the picture, scratches in the polymeric peptide layer can be seen that serve as a verification of that hypothesis. Cells patches (bright spots) have adhered inhomogeneously to the modified electrode only at its upper left corner
RESULTS AND DISCUSSION
117 A third serum-free neuronal culture on epitope modified interdigitated electrode structures after two days in culture. This time, the cells have differentiated to a certain degree. However, cell distribution is not restricted exclusively to modified electrodes. Nevertheless, neurons seem to prefer the peptide covered electrodes for their differentiation is much more advanced on those.
118 A somewhat sharper detail view of the left side of figure 117. Cell aggregates are already interconnected after two days in culture. 116 Detail view from another culture on a different interdigitated electrode structure. Again, the modified electrode areas appear brighter than the unmodified electrodes. In this case, many more cells (bright spots) have adhered to the modified electrode. However, cell differentiation is still poor after two days in serum-free culture. Furthermore, it can bee seen that the sapphire substrate appears unevenly colored. This is suggesting that during electropolymerization polymer patches might have diffused from the electrode onto the adjacent insulating substrate before being (sterically) trapped by larger neighboring polymer patches. 123 Another example of cell adhesion on a 3HPA-epitope modified platinum heating electrode on the back side of an interdigitated electrode structure. Within the framed area the polymer had been scraped off unintendedly. Neither cells have grown on that area nor on the sapphire substrate.
CHARACTERIZATION OF THE CELL NETWORKS
109
with electroactive monomers as the diluent show clearly that high peptide area densities are rather impairing cell adhesion and cell development while lower densities seem to act supportive. A possible explanation could be that high peptide densities will restrict their spacial freedom, thereby interfering with successful key-lock interactions between peptide and cell-bound receptors. 124 A fifth example of neurons grown on a 3HPA-epitope modified platinum heating strip on the back side of an interdigitated electrode after two days in culture. While cells have mainly adhered to the modified platinum electrodes with some overlap across the sapphire substrate, almost no cells have adhered to the nonmodified center electrode (arrow).
Electrodeposition of mere laminin had been tried out as well. As expected, no laminin adhered to the electrode to which the potential had been applied. All presented examples demonstrate a sometimes significant promotion of cell adhesion by means of electrochemically generated 3HPA-spacer-laminin-epitope polymers. However, the occurence of cell aggregation is indicating clearly that parameters like the choice of epitopes and of epitope density could still be optimized. Furthermore, neither any statement can be made about the active tertiary structure of the trapped peptide fragment nor about its similarity to the active conformation of that sequence within an unmodified laminin molecule.
127 ITO-glass slip coated densly with 3HPA-ATG-1 SRARKQAASIKVAVSADR (50 µg·ml ). Cells of a 2 day old serum-free NBM+B27 culture cluster visibly but also tend to differentiate to a certain degree. [WEI 99]
Effects of electrochemically immobilized peptide epitopes from laminin on ITO in NBM+B27 medium
Recent studies by WEINL [WEI 99] have led to the following results with using the mentioned electropolymerizable peptide epitopes on ITO-electrodes in serum-free medium: Cell adhesion and cell differentiation are strongly dependent on the density of epitopes. Dilution experiments
128 ITO-glass slip coated with a co-polymer of 3HPA -1 and 3HPA-ATG-SRARKQAASIKVAVSADR (50 µg·ml ) in a 1:1 ratio. Cells of a 2 day old serum-free NBM+B27 culture only aggregate slightly and differentiate nicely on the covered area. [WEI 99]
110
RESULTS AND DISCUSSION unmodified polymer films described in the following paragraphs. Impact of unmodified polymer films
129 ITO-glass slip coated with a co-polymer of 3PPA -1 and 3PPA-ATG-SRARKQAASIKVAVSADR (25 µg·ml ) in a 1:3 ratio. Cells of a 2 day old serum-free NBM+B27 culture only aggregate slightly as those in picture 128 but differentiation seems to be somewhat less vivid. [WEI 99]
In addition, the results suggest that, although laminin-derived epitopes can promote cell adhesion and cell differentiation to a certain degree in NBM+B27 serum-free medium on ITO, its potency is much below that of laminin in medium with fetal bovine serum. In NBM+B27 cells on ITO electrodes tend to aggregate or cluster. In contrast, cell growth, cell differentiation, and longevity on laminin coated substrates in medium with 5 to 15% fetal bovine serum is excellent. That leads to the following assumptions: 1. that the epitope is a necessary but not sufficient factor for promoting cell adhesion the way the whole protein does 2. that cell adhesion on laminin-coated substrates is predominantly mediated indirectly through factors that are not sufficiently contained in serum-free NBM+B27 medium. There is no evident indication yet whether the peptide-derived polymer films are really superior in serum-free cultures to
Some polymeric films, as in case of 3HPA and (sometimes also) of 2(3HP)E, are visible when looked at in reflection. They have a non-uniform and slightly brown to bluish color. It is not possible to detect those colors in UV/VIS absorption experiments, though. The other polymers do not show any color but are transparent. They can only be detected by contact angle measurements, with an α-stepper, or in SFM. Attenuated total reflection infrared spectroscopy (ATRIR) has not led to reliable signals, for the film had not been generated on the ATR-IR crystal itself. [WEI 99] 2-(3-Hydroxyphenyl)-ethanol: 2(3HP)E
Electrodeposited 2-(3-hydroxyphenyl)ethanol on ITO-glass without any further postmodification unexpectedly shows rather promising adhesion promoting properties in serum-free NBM+B27 medium. It can almost be compared to poly-D/L-lysine coated surfaces in media containing serum. While the uncoated reference area on the ITO plate only shows cell clustering during the first 3 days, cells often grow dispersely on the 2(3HP)E coated areas and differentiate normally (picture 130). After 4 to 6 days and after medium change, cells are swept away from the uncoated areas, whereas they develop towards network formation on the 2(3HP)E surface (picture 132).
CHARACTERIZATION OF THE CELL NETWORKS
130 ITO-glass slip coated with electropolymerized 2(3HP)E. Cells tend to cluster a little after two days in culture but also differentiate to a certain degree. [WEI 99]
111
132 Same ITO-glass slip from above after 6 days in culture (slightly tilted by 45°): The cells on the 2(3HP)E covered area (now left) have started to cluster partly but show network formation. The clusters from the uncoated upper area (now right) have been swept away in the meanwhile.
3-Hydroxybenzyhydrazine: (3HBH)
Similar to 2(3HP)E, 3-hydroxybenzyl hydrazine promotes cell adhesion and cell differentiation during the first 6 days. No distinct difference can be seen between culture development on 2(3HP)E and 3HBH.
131 ITO-glass slip, partly coated with 2(3HP)E (upper left corner). Cells of a 3 day old serum-free NBM+B27 culture develop nicely on the covered area comparable to cells on PDL in medium that contains serum. In contrast, cells on the unmodified ITO-surface (bottom right) tend to cluster.
133 ITO-glass slip, partly coated with 3-hydroxybenzylhydrazine (left). Cells of a 3 day old serum-free NBM+B27 culture develop nicely on the covered area comparable to cells on PDL in media containing serum. In contrast, cells on the unmodified ITO-surface (right) tend to cluster.
RESULTS AND DISCUSSION
112
Results from amino acid modified polymer coatings: Chemical postmodification of 2(3HP)E films on ITO through esterification with carbodiimid-activated D-lysine
134 Same ITO-glass slip from above after 6 days in culture: the cells on the 3HBH covered area have started to cluster partly, but show network formation (left). The clusters from the uncoated area (right) have been swept away; there, only a few undifferentiated single cells can be found.
After in situ activation of D-lysine with carbodiimide and simultaneous esterification of the 2(3HP)E polymer film on ITO in DMF in the presence of DMAP as a catalyst, [NEI 78] disperse cell adhesion and cell development is superior on such modified surfaces to the mere 2(3HP)E polmer film during the first 4 days. After that, cells start to die off for not yet understood reasons, while those on unmodified 2(3HP)E polymers will survive for longer.
3HPA and 3HBA
No satisfactory cell adhesion could be observed on ITO. Cells tend to cluster and refuse to differentiate. The situation is comparable to PDL+laminin treated ITO slides in serum-free medium.
136 ITO-glass slip, partly coated with 2-(3-hydroxyphenyl)-ethanol and esterified with D-lysine (left). Cells of a three day old serum-free NBM+B27 culture develop nicely on the covered area. They are spread more dispersely than on unmodified 2(3HP)E coatings, and show a somewhat higher degree of differentiation.
Synergetic effect of entrapped adhesion promoting molecules in 135 Cell clustering of neurons on 3HPA after two days in culture. Usually there is no differentiation at all. The picture resembles very much that of 109. [WEI 99]
2(3HP)E films
A similar positive result to chemical postmodification of 2(3HP)E with lysine is obtained when D-lysine is entrapped
CHARACTERIZATION OF THE CELL NETWORKS
113
mechanically within the polymer layer during the electrochemical polymerization procedure.
serum. The difference is striking during the first three days in culture when neurons in medium with 10% fetal bovine serum are at least two to three times as big as neurons without serum. Also, cell differentiation in serum cultures has a pace approximately 10 times faster than that of neurons in serumfree cultures. While visible, but possibly still inactive, network structures appear already during the first three days in medium containing serum, coherent networks form only past day 10 at the earliest in serum-free cultures.
137 ITO-glass slip coated with 2-(3-hydroxyphenyl)ethanol in the presence of D-lysine. Cells of a two day old serum-free NBM+B27 culture are spread dispersely and develop rather nicely. [WEI 99]
Derivatives of sialic acid (neuramic acid): Effect of the electrochemical deposition of 3-hydroxybenzyl hydrazine onto ITO covered glass substrates and subsequent covalent coupling of neurons to that polymeric matrix
Probably due to concentration dependent incompatibilities (5.5 mg per 5ml) and to the mentioned competitive reaction pathways of the 3HBH polymer with sugar in the medium, no preferred cell adhesion (below 5%) could be observed on 3HBH-modified ITO electrodes. On the contrary, adhered cells did not show any signs of differentiation, although they looked transparent and did not degrade within the first three days. Summary of observations
Neurons in serum-free culture tend to stay much smaller in size than in cultures with
The survival rate of cultures strongly depends on cell density. If the number of cells lies below a critical threshold of about 106 cells per ml, the culture was doomed to die after 4 weeks at the latest. Another measure is the cell density on the substrate after seeding. If there is a closed (monolayer) carpet of adjacent neurons, cultures will usually develop nicely. In contrast, cultures made sort of a quantum leap after three weeks when the cell density was above that threshold. Suddenly, bigger clusters spread out and formed dense carpets of dispersed neurons. At the same time, glial cells emerged and filled the holes. From that on, the cultures are very tolerant towards low pH (down to 6.5) and low temperatures over extended periods of up to one day. Those cultures lived for more than six months and usually died from contamination, not from age. In general, it can also be stated, that neuronal cell cultures are rather tolerant to low temperatures down to room temperature and low pH down to 6.5 for several hours. In contrast, temperatures above 39°C or a pH above 8 are leading to signs of apoptosis (irrecoverable axon degradation, soma degradation) within minutes to hours.
114
Amplifier for recording signals of low amplitudes A composite two-stage, non-inverting amplification unit with a total amplification of 990 or 1551, respectively, in SMD design has been developed. It consists of 30 integrated quad operational amplifiers (MC33272, Motorola) to serve an overall of 60 channels. The amplifiers have the following characteristics: unity gain stability, slew rate of 10 V·s-1, 18 nV·Hz-1/2 of noise, 100 µV input offset, 16 MΩ input resistance, and a bandwidth of 24 MHz @ 100 KHz. The amplifier may be powered by two ±5.0 V battery units or a stabilized ±5.0 V power source. Each stage amplifies either 33-fold (first stage) or 47-fold (second stage) with a resulting noise level of the unshielded setup between 20 mV and 60 mV (peak to peak) after amplification. As mentioned above, the typical input noise level is about 18 nV·Hz-1/2 and there seems to be hardly any additional pickup of noise from the environment or power lines. With shielding the unit and the cables, the noise level may be quenched a little more. Rarely very stereotypical spikes will show up with a time frame of one to two samples. Therefore, they can be recognized and distinguished from real neuronal signals, and be sorted out rather easily. However, under regular operation, the offsets drop to -4.7 V after amplification and show still inexplicable input saturation. Only if the inputs are set to ground by 10 kΩ resistors, the offsets will level around 0.35V, varying somewhat for each channel. Higher resistances than 10 kΩ will not compensate the offsets properly and will therefore shift them towards the amplification limit of -4.7 V as well which is confined by the supply voltage of ±5.0 V. Unfortunately, the
RESULTS AND DISCUSSION resulting voltage devider will cut the signal amplitude unacceptably. If used, all incoming signals below 100 µV will already be concealed by the noise level. No filtering is required with the exception of a 20 nF capacitive cut-off for inexplicable pickup of noise at around 680 MHz, probably originating from the computer. To reduce its total dimensions, a stacked sandwich design of two circuit boards has been chosen. 32 channels are served by the first circuit board, the remaining 28 channels are addressed by a second board of the same layout, but flipped and stacked on top of the first circuit board. The amplifiers are arranged in a square around the MEA, leaving a square opening in the center for manual and optical access. Since there are 64 channels available theoretically, one channel in each corner of the top circuit board stays disconnected. With this arrangement, the total dimensions of the amplifiying unit is reduced to approx. 100 mm · 100 mm · 50 mm. Gold plated contact pins with spring-dampened tips are contacting the electrode pads of the MEA. A metal plated box might shield the whole unit against external noise. 60 wires are connecting the amplifier directly to the inputs of the 64-channel A/D-board with a speed of up to 333 ksamples. The 1:1 layout of the amplifier board is attached at the end of the thesis for photoreproduction.
AMPLIFIER FOR RECORDING SIGNALS OF LOW AMPLITUDES
115
amplifiers have been chosen. First amplification is 33 or 47, respectively, second amplification is 33. (The amplification is calculated by the ratio of 1+RB'/RA and 1+RB"/RA, respectively. [TIT 93]) The sizes of RB and RA
138 Schematic circuit design of a single non-inverting amplifier consisting of two separate amplification stages. Initially, two Motorola MC33274 SMD operational
139 Picture of the lower amplifier stage with the first 32 channels mounted on a MEA with perfusion chamber. The first amplification stage is seen on top, while the second amplification stage is on the bottom of the board.
have been chosen as 330 kΩ (470 kΩ) and 10 kΩ because smaller magnitudes led to higher negative experimental offsets of about -2.2 V which are not predicted by a PSpice™ simulation. In addition, saturation of the amplifiers can only be avoided by connecting each input to ground by a 10 kΩ resistor (Rin). The 20 nF capacitor CA as a cut-off filter parallel to RB' removes the noise at 680 MHz, probably originating from the nearby computer.
Each operational amplifier is serving four inputs (Motorola, MC33274 quad-opamp). Neither the signal leads to the A/D-board in the computer (mini connectors on the upper edge of the board) nor the power supply (top center) is connected in this picture.
116
Signal recording software
The signal recording software has been realized with Testpoint™ as well. The 60 channels are represented in the same arrangement as the electrodes on the MEA. This way, the signal spread may be observed easily. The sampling rate may be set up to 5550 Hz per channel, which touches the uppermost sampling limit of the A/D-board. Although this sampling rate does not allow a high resolution signal shape analysis, it is certainly fast enough to separate single spikes in a bursting network.
140 Hardcopy of the coarse-view signal recorder realized ™ with Testpoint . Signals from all 60 channels can be recorded and displayed simultaneously for a short time. The graphical displays represent the electrode arrangement of the MEA. That way, the origin and the
RESULTS AND DISCUSSION The recorded signals are stored directly on hard disk before being displayed. As a very disadvantage of the software, a continuous recording of more than eight channels with simultaneous graphical display will cause a buffer overflow, even with a 350 MHz Pentium™ PC with 128 MB of RAM running under Microsoft® Windows 98™. In that case, the data has to be analyzed on a different computer or after recording, respectively.
pathway of the signals may be detected and traced. On this picture, only 32 channels (plus one more channel that is actually not connected) from the lower amplifier board are sampled with a sampling rate of 4 ksamples per second and channel. Already recorded signals can be visualized afterwards with that software as well.
AMPLIFIER FOR RECORDING SIGNALS OF LOW AMPLITUDES Noise characteristics of the amplifier
For testing the amplifier performance before manifolding its channels, a one-channel version has been tested on a neuronal culture grown in a perfusion chamber on a MEA. The ground of the amplifier had been
117
connected to the platinum wire in the chamber cover-glass as well as to the ground of the computer. Sampling rate was 16 000 samples per second. There is hardly any pickup of noise from the environment, even though the amplifier unit is not yet shielded.
[V]
A 72m
66m
60m
54m
48m
42m
36m 0
0.05
0.1
0.15
0.2
0.25
0.3
0.35
0.4
0.45
0.5
0.55
0.6
0.65
0.7
0.75
0.8
0.85
0.9
0.95
1
[s]
[V]
B 72m
66m
60m
54m
48m
42m
36m 0
5
10
15
20
25
30
35
40
45
50
55
60
65
70
75
80
85
90
95
100
[ms]
[V]
C 60m 56m 52m 48m 44m 40m 0
0.5
1
1.5
2
2.5
3
3.5
4
4.5
5
5.5
6
6.5
7
7.5
8
8.5
9
9.5
10
[ms]
141 Idle state amplifier characteristics to evaluate the noise level of the amplifier prototype. The sampling rate had been set to 16 000 samples per second. Overall noise is about 30 mV after an amplification of 1551. This is equivalent to an internal amplifier and system noise of 25 µV at this sampling rate (A). Therefore, a signal to
noise ratio of 4:1 could be expected if capacitively recorded neuronal signal amplitudes of about 100 µV are assumed. A zoom into a 10 ms frame (B) reveals a slight but almost negligible pickup of 50 Hz noise from the power lines. A zoom into a 10 ms frame gives an impression of signal resolution: a neuronal spike of 1 ms duration will be defined by 16 points.
Summary and outlook
Summary [A] This thesis depicts the setup of an autonomous recording system which aims at the use in analytical investigations independently from laboratory facilites. It includes the development of a modular perfusion chamber for use at any desired location, the portrayal of a combined temperature and medium supply controller, of its mechanics and electronics, and the design and programming of a 60-channel amplifier unit for signal recording from multi electrode arrays. It could be shown that cells can already survive in the autonomous perfusion chambers for up to three weeks. It turned out that cell survival is prolonged with timed medium flow rather than continuous perfusion. For it is already difficult to grow serum-free cultures in standard culturing wells, it is especially difficult to grow them in the perfusion chambers. In contrast, it is no problem to grow serum cultures in it right after cell extraction. [B] As an alternative to the modification of plain electrode pads with TiN to enhance its capacitive as well as its save charge injection properties, it could be shown that iridium can be electrodeposited in a polypyrrole matrix as a promising biocompatible material with very good capacitive-electrical and low impedance characteristics.
5
[C] A new adhesion promoting strategy based on the electropolymerization of phenol derivatives has been presented and compared to conventional adhesion promoting strategies. One of the striking outcomes is the superiority of 2-(3-hydroxyphenyl)-ethanol [2(3HP)E] or 3-hydroxybenzylhydrazine [3HBH] coatings to protein or peptide mediated approaches in serum-free medium. They can compete with conventional strategies as polyamino acid modified substrates but have the advantage to act only locally at the electrodes. With respect to cell adhesion and neuron differentiation, one unexpected observation was that cells in serum-free culture will not accept substrates that have been modified with physisorbed PDL and/or laminin in the regular manner, while cells in media that contain fetal bovine serum do. This finding might hint at an adhesion mechanism that is more complex than a simple key-lock interaction between laminin and integrins at the outer cell membrane. Proteins from the serum might be involved (alosterically) and be indispensable in a successful adhesion promoting interplay with laminin and positively charged surface layers or cell receptors. The reader might have noticed that the portrayed project is accessible only in a multidisciplinary approach. There are many working fronts and tasks which have to be looked at simultaneously. Therefore, not all of the problems could be addressed and
OUTLOOK
119
Outlook
The data evaluation has to be adjusted with regard to the classification of medical substances, pesticides, drugs, neurotransmitters, their homologous compounds and antagonists, as well as water soluble aromas. The choice of cellular entities and electrode geometries might be adapted as required. The classification will be performed mainly by neural network analysis or time series analysis, respectively.
The global view
Impedance spectroscopic
solved equally well within the time frame of one dissertation. However, many of the roots of the implied problems have been unearthed. In this respect, the way has been paved to reach the set goal, the development of a bioanalytical tool for qualitative and quantitative biochemical analysis, in the not so far future.
Cells from the cortex of embryonic chicken (E7-E10) or mice (E15) will be immobilized covalently or biologically on the electrode substrates through adhesion promoting deposits (polylysine derivatives, laminin derivatives, protein fragments, glycolipids, ...). That way, the response behavior of the network forming neuronal cultures towards neuropharmacological agents may be investigated. It has been shown in this thesis and by others [GRO 97] that those neuronal networks can be cultured in vitro for more than six months. Furthermore, works by GROSS et al. demonstrate that neuronal networks respond histiotypically to internal and external parameters. [HAR 97A · GRO 97] As a first step, the impedances (evaluation of the electronic cell coupling to the electrode) and the stationary spiking patterns of the network (biological response behavior) will be characterized as functions of external parameters. In a second step, concentration related network responses towards key substances, and changes in electrode impedances will be investigated systematically. In that context, the deviation from various naturally occurring or artificially induced (electronically or chemically conditioned, e.g. with bicucullin, strychnine, ...) stationary starting patterns will be of interest.
characterization of the micro electrode arrays
For comparative reasons, the MEAs have to be characterized electrochemically in order to evaluate any additional modification of its electrode pads. Reference impedance data is also of relevance when evaluating adhesion related changes in the IS, as suggested below. Characterization of adhesion strength by impedance spectroscopy
Impedance spectroscopy is a powerful tool to characterize and evaluate electrodemembrane junctions. Due to the low potential amplitudes of around 10 mV, it is suited to investigate the cell adhesion coupling to the electrode probably without influencing the cells electrically. That kind of stimulus in general is not sufficient to trigger action potentials in neurons. With IS, one could not only determine the sealing of the electrode or the distance of the cell to the electrode but could also detect cell movement over time. Different electroactive monomers as peptide linkers
For some amino acids are prone to oxidation (Y and T), instead of 3HPA and 3PPA different electroactive monomers could be linked to the peptide epitopes that may be
120
electropolimerized cathodically. Candidates of choice are vinylic monomers like acrylonitrile and methacrylonitrile or their derivatives. Apparently they bind strongly to metallic surfaces as well. [TGY 93] Investigation of long term stability of the adhesion promoting coatings
The stability of the adhesion promoting coatings could be tested by impedance spectroscopy over time. One could think of in vitro studies with and without cell cultures. If cell cultures are used, cells should not grow on the electrodes of interest to eliminate cell-induced alteration of the polymers from those that result from reactive components in solution. Alternative electrode grids for adhesion studies
To test adhesion strategies on other materials than ITO, SEM grids made from carbon, gold, or platinum with different mesh dimensions could be pressed thermally (with an iron) in polystyrene culturing dishes (e.g. Cell+) and covered electrochemically with appropriate polymers. Cell development and differentiation could directly be compared to that on conventional culturing substrates. Modification of the ManLev strategy
Alternatively to the combined ManLev3HBH strategy that is somewhat prone to competitive reaction pathways, the originally proposed concept by BERTOZZI [SER 96] could be modified to a ManLevPhy strategy which does not depend on a reaction partner on the substrate anymore. If a phenyl-, pyrryl-, thiophenyl- or anilinyterminated ManLev will be taken up by the cells, and be expressed on the cell surface as a sialic acid, terminated by one of those electroactive species mentioned above, cells could be seeded in the regular manner onto
SUMMARY AND OUTLOOK electrode substrates, that do not have to be modified in advance. Cells would rather be attached to the electrode areas by applying constant or varying voltage patterns to the interface regions, thereby electropolymerizing and immobilizing the cells. As tested in preliminary experiments, a voltage up to +0.9 V even over prolonged periods of up to 24 hours does not affect cell growth and cell differetiation noticably. For steric reasons, electropolymerization would probably be only successful in the presence of an electroactive monomer species acting as an diluent which has to be tested on its biocompatibility first. Optimizing the chemical and electrochemical parameters for iridium deposition
A key factor for a successful electrochemical iridium deposition has been the presence of potassium sulfate (K2SO4) in the electrolyte. Since this has been an empirical finding, its role in the electrochemical process should be investigated to understand its contribution, and maybe to replace it by a more potent additive. Furthermore, the electrochemical parameters could be optimized to form a more stable iridium layer without the help of a polymeric matrix component (like polypyrrole). In a first approach, one could think of an electrodeposition procedure with simultaneous ultrasonic treatment. Although the iridium-polypyrrole co-deposit is showing satisfactory impedance characteristics, its long-term stability has not yet been investigated under physiological conditions. It might be possible that the polypyrrole will degrade over time. Combining the two approaches, the iridiumpolypyrrole co-deposition and the
OUTLOOK electrochemical iridium activation to form iridium oxide, one could also think of chemically dissolving the polypyrrole after electrochemical co-deposition with iridium to free the necessary space for the less dense iridium oxide. In a repetitive oxidative cycling procedure, the emerging iridium oxide could then fill those cavities without exerting too much stress onto the final layer. As a result, one would expect a homogeneous, pin-hole-free, and stable iridium oxide layer due to its dovetailed texture.
121
leaving the network alone for a certain time and refresh its food supply quickly at selected hours of the day. Programming of the recording software with C++ or Delphi
No data have been collected on the longterm impedance behavior and on the mechanical and chemical stability of those iridium-polypyrrole co-deposits under physiological conditions. In that respect, it might be of interest, how much the kind and amount of anions in the polypyrrole will affect its conductivity and impedance over time.
Because the execution of any program written with the virtual device programming software Testpoint™ by Keithley ® Instruments is interpreter-mediated and not low level, the execution speed decreases rapidly in complex programs, especially in those with graphic oriented tasks like the display of signals in 60 separate graphic windows. Keithley Instruments® is providing device driver libraries (.dlls) for programmers to control the A/D hardware, which can be included in any low level programming language like C++ or Pascal/Delphi. In order to realize a software package that allows continuous recording of all 60 channels with simultaneously updating the graphic displays, there is probably no alternative to low level programming.
Electrochemical activation of iridium
Recording from spinal cord or cortex
during electrodeposition
neurons of embryonic mice (E14)
As mentioned earlier, iridium oxide might simultaneously be formed from the electrodeposited iridium through alternating reductive and oxidative redox-cycling in an aqueous solution of H2IrCl6. Since the parameters for a direct electrochemical activation of electrodeposited iridium have not been found yet, some experimental work is required to adjust the right conditions.
To compare the adhesion studies and network recordings more easily and more reliably with results from other groups, it might be advisable to use neurons from embryonic mice.
Long term stability of iridium embedded in a polypyrrole matrix
Optimization of the temperature controller and the stepper pump
One could think of controlling the stepper and temperature controller by a computer through a serial or parallel interface. That way, a feeding cycle could be programmed,
Olfactometry with bio-electronic noses
Artificial odor analysis is a complex task. Today, it is still restricted to special applications only. This is mainly due to the unsurpassed high sensitivity of the various olfactory systems in the animal kingdom. In most cases, today's chemical analysis methods can recognize substances with equal sensitivities, while the synergetic
SUMMARY AND OUTLOOK
122
combination of receptors in the olfactory epithelium and of information processing in the brain may amplifiy sensations of smell to limits still beyond physical or chemical detection limits. [PLA 87 · BRE 94 · AXE 95 ·
Optical signal recording techniques
cultures from embryonic stem cells
As proposed in the section about potential sensitive fluorescent dyes, a capacitiveoptoelectrical electrode device could be developed as a high-speed alternative to conventional multimicroelectrode arrays. With such a system, one would not be restricted to a limited number of electrodes but could record from any spot of the culture in parallel. Certainly, this development is a major project and will take some time to establish.
(ES)
Neurobionic devices with neuronal
[BAN 98]
cell lines
LRN 96 · STH 96 · GÖP 98 · HIL 98 · ZIE 98B]
With respect to odor analysis with neural networks, an experimentally more demanding co-culture of olfactory bulb and olfactory epithelium could be considered. Establishment of neuronal cell
For producing reproducible and less cost intensive sensor devices based on neural networks in culture, a culturing protocol for embryonic stem cells should be developed alternatively to those of primary cultures from embryos or from neonatal animals. Embryonic stem cells are clonal cell lines derived from the 4-day mouse embryo and having biological properties similar to cells of the inner cell mass and primitive ectoderm. They replicate indefinitely in tissue culture. This ability is a natural property of the cells and is not dependent on an oncogenic mutation or pertubation of the genome in contrast to tumor cell lines (neuroblastoma, P19, PC12, ...). ES cells have the full potential of normal early embryonic cells to form the developing nervous system. BAIN et al. have shown in 1995 that some aspects of the pathway between ES cells and neurons can be reconstituted in vitro. [BAI 95]
Regarding the possibility of neurobionic sensor devices to become a standard analytical tool, primary cell cultures are not suitable for the rather complicated and costintensive extraction procedures as well as the necessary time consuming calibration and standardization steps. However, there is hope that somewhen in the future neuronal cell lines will be available which might show the same characteristics as primary cell cultures regarding differentiation and formation of regular synaptic contacts. Cell lines can be duplicated easily and have predictable features. With controlled, localized seeding, growth factor directed differentiation, and the help of mitotic repressors reproducible and long-term stable network formation will be feasible. In that respect neurobionic devices will become commercially available as cheap and reliable sensor systems with many applications not only in scientific research but also in every day life.
Appendix
Protocols and procedures Solutions
As a preceding note it should be mentioned that none of the mediums prepared have been tested for their osmolarity due to the lack of an adequate microosmometer. In the literature, the recommended osmolarities vary between 320 and 340 milliosmol anyway. According to our own experience, the mainly used Neurobasal™ medium (Cat. No. 21103, Gibco Life Technologies) worked perfectly well without the control of its osmolarity. But as soon as reproducible analytic results are desired, the medium has to be uniform in all experiments. Frozen goods should be warmed up slowly by first thawing them in the refrigerator. Only then they should be warmed up to room temperature by taking them out of the refrigerator. Furthermore, frozen solutions should not be thawed more than once. It has turned out in many labs that the quality will suffer tremendously for yet not fully understood reasons with repeated refreezing of thawed substances and solutions. Therefore one has to think in advance of a clever distribution of the prepared stock solutions onto bottles or syringes with adequate volumes. Ultrapure water
Ultrapure water (Millipore, Milli-Q Plus™) was autoclaved for preparing several solutions mentioned below.
6 70% ethanol
70% (v/v) ethanol (700 ml technical ethanol and 300 ml destilled water) served for sterilizing instruments like forcepts and scalpels, and for sterilizing polymer films and culturing chambers in case they were not autoclavable. D1SGH
Sterile D1SGH is a base medium for intermediate storage of tissue right after extraction and for preparation and freezing of solutions of trypsin inhibitor and especially of trypsin-DNase I. Trypsin may not be dissolved in regular cell culturing medium for its inactivation by divalent cations like Ca2+ or Mg2+. The recipe is taken from the lab manual of the CNNS and has not been modified. [LAB 96] amount
8.0 g
substance (notes, company, ordering#)
NaCl (ICN Biomedicals,
MW g·mol-1
concentration
58.5
0.14 mol
KCl (ICN Biomedicals, 191427)
74.6
5.36 mmol
60 mg Na2HPO4·2H2O (ICN Biomedicals, 194739)
178.0
0.38 mmol
30 mg KH2PO4 (ICN Biomedicals, 194727)
136.1
0.22 mmol
7.5 g
180.0
41.67 mmol
342.0
8.77 mmol
238.3
9.86 mmol
194848)
0.4 g
C6H12O6 Glucose (ICN Biomedicals, 194672)
3.0 g
C12H22O11 Sucrose (ICN Biomedicals, 821713)
2.35 g
C8H18N2O4S HEPES (ICN Biomedicals, 101926)
1000 ml
H2O (bidest.)
18.0
55.56 mol
APPENDIX
124
After mixing the substances, the osmolarity of the solution may be adjusted to 320-330 milliosmol with ultrapure water. The pH is set to 7.4 with 0.1N HCl or 0.1N NaOH, respectively. The solution is then sterile filtered through a cellulose acetate filter with pore sizes of 0.22 µm and stored in adequate, autoclaved bottles at 8°C for further use. Life time of that solution is up to 6 months. Gibco Neurobasal™ serum-free medium (NBM or SFM)
unknown composition. Furthermore, growth of glial cells has to be suppressed at a later date in serum-free cultures and therefore exposes the culture to less stress by not needing to add a mitotic disruptor in its very vulnerable early days. amount
2.00 ml
The idea of knowing the exact composition of a serum-free medium is valid only at its first use with the seed of cells. Cell metabolism will not only change concentrations slowly but will also alter the entire composition with the consumption as well as excretion of available or lacking substances, respectively. [BAN 96] However, with a perfusion system, a steady flow of new medium replacing partly the old might result in a defined gradient of substances which keeps the culture in a steady, predictable state of activity. In that respect, a serum-free medium is a bit ’more defined‘ than a medium containing serum of
MW g·mol-1
concentration
146.15
0.5 mmol
B-27 supplement (Gibco Life Technologies, 17504-010)
7.31 mg C5H10N2O3 L-glutamine (Gibco Life Technologies, 21051-016)
100 ml
A comparative study led to the conclusion that medium containing serum (MEM, Gibco Life Technologies, 61100-53, with 510% fetal bovine serum, Gibco Life Technologies, 10108-157, and 5-10% horse serum, Gibco Life Technologies, 26050-039) did neither support long term cell viability nor differentiation with neural cell cultures from the brain of embryonic chicken (E7E10). Instead, a defined, serum-free medium was chosen for culturing those cells (up to 6 month). Serum-free medium suppresses the growth of glial cells up to 2 weeks, until a stable culture has developed. Those cultures probably excrete factors by themselves which promote glial expression thereafter.
substance (notes, company, ordering#)
Neurobasal™ (Gibco Life Technologies, 21103-031)
Approximately 10 ml of the sterile medium are poured into a beaker containing the nonsterile L-glutamine. Then, the sterile, slowly thawed B-27 supplement is added to the main solution. After dissolution of the L-glutamine, this solution is transferred through a 0.22 µm syringe filter to the bottle containing the residue of the supplement. The B-27 bottle is carefully rinsed with that medium and poured back to the main bottle. This procedure is recommended to make sure that all of the supplement has been transferred to the final medium. If necessary, the osmolarity of the medium is adjusted to 320-330 milliosmol with sterile ultrapure water. The pH is set to 7.4 with sterile 0.1N HCl or 0.1N NaOH, respectively. Recommended life time of the medium is 6 months when stored at 8°C. Neurobasal™ SFM is shipped without glutamate. The accompanying instruction leaflet recommends the addition of 25 µmol of glutamate (equivalent to 3.7 mg of glutamic acid to 100 ml of medium, ICN Biomedicals, 101793, C5H10NO4, MW: 147.1 g·mol-1) for the first four days in culture. Glutamate will promote cell differentiation during that period, but has a
PROTOCOLS AND PROCEDURES toxic effect on neurons thereafter (Ca2+pathway: induction of apoptosis). The further addition of antioxidants like vitamin E (α-tocopherol) or vitamin C (ascorbic acid) has been mentioned in the literature and may increase long term viability as well as protect the cells during their very delicate differentiation period in the first few days. This theory has not been tested yet. The addition of 25 µmol of 2mercaptoethanol (equivalent to 175 µl to 100 ml of medium, Sigma-Aldrich, M 6250, d20 1.114, MW: 78.13 g·mol-1) for increasing long term viability and differentiation in olfactory, cortical, and hippocampal neurons, as mentioned by GRILL-JR. [GRL 93] and ISHII, [ISH 93] could not be verified for cultures of fetal chicken brain neurons. Minimum Essential Medium (MEM)
If medium containing serum is desired, the following recipe will work for spinal cord cultures of embryonic mice. It is adapted from the lab manual of the CNNS. [GRO 96] The first component is the MEM base medium itself. Serum is added as required: For the first four to eight days, a mixture of 10% (v/v) of heat inactivated fetal bovine serum and of 10% (v/v) of heat inactivated horse serum is added to the MEM. Lateron, only 10% (v/v) of horse serum will keep the culture going. Serum contains certain factors which are not known in detail yet. It promotes glial growth and network formation. If glial cells are not desired, mitotic disruptors like 7.5 µM cytosine BD arabinofuranoside and 20 µM cytosine (AraC-C, Sigma Aldrich, C6645 and C3506) or 2.9 nM 5'-fluoro-2'-deoxyuridine (FdU-U, Sigma Aldrich, F0503) have to be added to the culture after 4 to 5 days past seeding. [GRO 96]
125
If MEM containing serum is offered to neurons from the brain of embryonic chicken, the neurons will only cluster in heaps of about 20-100 cells which will show a few strong axons after 4 days. No formation of loosly woven networks could be observed with this kind of medium. The base minimum essential medium needs some additives as listed in the table below. amount
8.53 g
substance (notes, company, ordering#)
MW g·mol-1
concentration
84.0
26.2 mmol
180.0
33.3 mmol
MEM (Gibco Life Technologies, 61100-053)
2.2 g
NaHCO3 (Sigma-Aldrich, S 8875)
6.0 g
C6H12O6 Glucose (ICN Biomedicals, 194672)
1000 ml
H2O (bidest.)
18.0
55.56 mol
After mixing the substances, the osmolarity of the solution may be adjusted to 320-330 milliosmol with ultrapure water. The pH is set to 7.4 with 0.1N HCl or 0.1N NaOH, respectively. The solution is then sterile filtered through a cellulose acetate filter with pore sizes of 0.22 µm and stored in adequate, autoclaved bottles at 8°C for further use. Life time of that solution is up to 4 months. The bicarbonate concentration is recommended by Gibco Life Technologies and adjusted to a CO2 tension of 5%. If the incubator is working at different partial pressures of CO2, the bicarbonate concentration can be varied accordingly. Assuming a linear correlation between partial pressure of CO2 and bicarbonate concentration, the amount of NaHCO3 for 8% of CO2 would correspond to 3.2 g to 3.7 g, and to 4.0 g to 4.6 g for 10% of CO2, respectively. Sera
As mentioned above, heat inactivated fetal bovine serum (Gibco Life Technologies,
APPENDIX
126
10108-157) and heat inactivated horse serum (Gibco Life Technologies, 26050-039) are added to the MEM in amounts of 10% (v/v) each during the first four to eight days. After that period, 10% of horse serum is sufficient for healthy long term culturing. If the serum is not sold as heat inactivated already, heat inactivation is done by keeping the serum at 56°C for 30 minutes. [LDL 94] It is recommended to not add serum to the MEM before the MEM has been sterile filtered for its tendency to form vast amounts of bubbles during the filtration procedure. Enzymes for cell dissociation: trypsin and DNase I
Given enzyme activities are related to a standardized test in which Nα-benzoyl-Larginine ethyl ester (BAEE) is being decomposed by the enzyme of interest. Trypsin with an activity of 1000-1500 BAEE units per mg solid will lead to cell dissociation. Common concentrations are 1 mg of trypsin per ml medium. It is very important that trypsin acts in a medium that does not contain bivalent cations as Ca2+ or Mg2+, because those will impair its activity (Boehringer Biomedicals product catalog). As an alternative to trypsin, the less potent papain (ICN Biomedicals, 100924) may be used in the presence of cysteine. However, papain will prolong the incubation period during the cell extraction and seeding procedure. DNase I dissolves the sticky DNA oozing from disrupted cells. It prevents renewed cell agglutination through free floating DNA. DNase I with an enzyme activity of 2000 BAEE units per milligram solid is effective in concentrations of 0.01 mg to 1 mg per milliliter enzyme solution. Although some people prefer to chemically dissociate the mechanically preminced cells first in a trypsin containing solution alone and treat them with DNase I
in a second resuspension step thereafter, mixing trypsin and DNase I right away works perfectly fine and saves the time consuming second step, thus exerting less stress onto the cells. amount
substance (notes, company, ordering#)
MW g·mol-1
concentration
50 mg Trypsin (1000-1500 BAEE units per mg solid, SigmaAldrich, T 4799) 5 mg DNase I (4710 U per mg solid, Fluka, 31135) 50 ml
D1SGH
After mixing, the pH is set 7.4 with 0.1N HCl or 0.1N NaOH, respectively. The solution is then sterile filtered through a cellulose acetate filter with pore sizes of 0.22 µm into 50 Eppendorf cups in portions of 1 ml and stored at –18°C. Life time of the enzyme solution is up to 9 months. Trypsin inhibitor
No trypsin inhibitor is needed to stop trypsin activity after cell dissociation, because the cells are transferred as a pellet to medium, containing bivalent cations, which will impair trypsin activity. In addition, the 20-fold dilution from 0.05 ml (approximate size of the cell pellet, certainly varying with the amount of cells extracted) to 1 ml did not affect cell development in culture. Furthermore, the entire solution is replaced by new medium within the perfusion chamber after some hours anyway. For the sake of completeness, 50 mg of trypsin inhibitor (7000 BAEE units per mg solid, Gibco Life Technologies, 17075-029) may be dissolved in 50 ml of MEM, NBM, or D1SGH, distributed onto 50 Eppendorf cups after sterile filtration with cellulose acetate filters (pore sizes of 0.22 µm), and stored at –18°C for up to 9 months. 1 mg of trypsin inhibitor of that kind inhibits 1 to 3 mg of trypsin with activities of 10 000
PROTOCOLS AND PROCEDURES
127
BAEE units per mg protein. According to the product catalog of Boehringer Biomedicals, even 10 to 100 µg per ml are already sufficiently deactivating. Nutrient broth
To control sterility of the media after their preparation, it is recommended to pour approximately 1 ml of freshly prepared medium to 5 ml of a solution of bacteria nutrient broth. The mixture is kept for a few days at 37°C. Any drop in pH to acidic and/or change in transparancy to a milky appearance of the solution does indicate a contamination by fungi or bacteria. However, a contamination by viruses will not show that way. amount
4 g
substance (notes, company, ordering#)
MW g·mol-1
concentration
Nutrient broth (Gibco Life Technologies, 12795-019)
120 ml
H2O (bidest.)
18.0
6.67 mol
The solution is sterile filtered through a cellulose acetate filter with pore sizes of 0.22 µm and stored in sterile 10 ml test tubes. Life time of the nutirent broth is up to 18 months. Autoclaving procedure
A Tuttnauer table autoclave (Tuttnauer, 2540EL) has been used. It has turned out that autoclaving the MEAs (with the polycarbonate holding clamps glued to them), the silicone rubber sealing rings, and the sandwich cover-glasses in beakers filled with destilled water will avoid heat activated chemical modification of the components. Although all components should be thermostable up to at least 130°C, it occured several times that the clamps melted due to failure of the temperature controller of the autoclave only when they were not immersed in water. Also, the appearance of the silicone rubber seemed to be cleaner
after autoclaving it in water than after a regular ’humid‘ autoclaving procedure. The autoclaving procedure of choice therefore was that for liquids: 121°C for 20 minutes. After cooling down, the components were dried in the air flow under the sterile hood. Preparation of the electrodes
Electrodes usually have to be pretreated with adhesion promoting factors. Those can either be applied electrochemically (2(3HP)E, 3HBH, ...) or physisorbed from solution (PDL, laminin). In the first case, the electrode plates have to be rinsed with 70% ethanol for sterilization and dried thereafter in the flow of the sterile work bench. Autoclaving is not recommended, because the high temperature could lead to an alteration or destruction of the thin polymer films. (Actually, this has still to be tested.) In the latter case, up to two drops of PDL (1mg·ml-1) and/or laminin (≤ 100 µg·ml-1) are set onto the center of the autoclaved electrode plates at least 30 minutes before the cell extraction procedure is started. The water from those PDL+laminin drops does evaporate only slowly under the hood. The area may also be hydrophilized with a handheld butane torch in advance. In that case, the flame is approached to the substrate swiftly and woodpecker-like up to five times. It is very important to be aware of the thermal stress of that procedure onto the substrate. While hydrophilization supports physisorption of the adhesion factors, it becomes disadvantageous at the time of chamber assembly. Then, the medium tends to slip under the sealing ring and spreads all over the electrode area. This leads to a higher consumption of suspended cells. After hydrophilization, it is important to let
APPENDIX
128
the substrates cool off before applying the desired adhesion factors in order to not alter or destroy them by heat. The PDL+laminin may be allowed to dry completely before non-absorbed residues or water-soluble parts are rinsed off with sufficient amounts of bidestilled water. (Soluble PDL seems to be toxic to cells.) Finally, remaining drops of bidestilled water have to evaporate before the chambers can be assembled and be charged with the cell suspension. Cell extraction procedures
Fertilized chicken eggs (gallus domesticus) may be stored for up to one week at temperatures between 17°C and 22°C. Each day, one or two eggs are laid into the egg incubator (Grumbach, BSS). They are incubated for 7 to 10 days at 38.5°C and ambient humidity between 40% to 60% with or without any further manipulation (e.g. rolling). For cell extraction ·
a sterile hood (CleanAir, DLF 460EC)
·
a small table centrifuge (Hettich, EBA III),
·
a CO2 incubator at 37°C and 5% CO2 (Integra Biosciences, BIOSAFE eco),
·
a sterile petri dish (Ø 13 mm) with cap for cell extraction (Sarstedt, Cell+),
·
another sterile petri dish or a cell culturing plate, preferably with adhesion promoting surfaces, for cell storage and reference culturing (Sarstedt, Cell+),
·
an autoclaved PASTEUR pipette which had been ’flame-polished‘ by melting and thereby narrowing its tip slightly with a butane burner flame (Roburn, MicroTorch),
·
two alcohol sterilized tweezers with needle-sharp tips (INOX, type 1),
·
two alcohol sterilized scalpel blades,
·
and an alcohol sterilized or autoclaved beaker (500 ml) are used.
The tools are arranged and prepared on the working area of the hood 15 minutes after the hood has been turned on, and after its working area has been wiped completely with 70% ethanol. It is recommended to roll up one’s sleeves and besprinkle ones hands and lower forearms with skin-friendly sterilizing fluid (BODE, Sterilium) or 70% ethanol each time before entering the sterile area under the hood. 15 minutes prior to cell extraction, a 1 ml trypsin and DNase I containing cup from the freezer is thawed under the running hood after spraying the surface of the cup with 70% ethanol. In general, any cups and bottles are sprayed with 70% ethanol before bringing them under the running hood. After alcohol sterilization, critical parts of tweezers, scalpels (tips), and bottles (necks) may be flamed with a butane burner flame to exclude any source of contamination. Alternatively, instruments may be autoclaved. Before starting with the cell extraction procedure, a sterile petri dish or two wells of a cell culturing plate are filled with approximately 1 ml of NBM each and stored in the CO2 incubator until needed. After thawing, the trypsin-DNase I solution may be stored in the CO2 incubator as well. One egg is then taken out of the egg incubator, and its outer shell is rinsed thoroughly with 70% ethanol. It is opened at its bottom side with the blunt end of the tweezers by cracking its shell 1/4th below the bottom, thereby forming a cap that can be removed easily. The egg is then held horizontally in a way that allows the liquid content to flow out partly. At the same time, the egg is turned around its long axis until the embryo is floating on top of the liquids.
PROTOCOLS AND PROCEDURES The sharp ends of the tweezers are positioned around the neck of the embryo and pressed together firmly, thereby decapitating the embryo instantly. The pair of tweezers is then positioned under the head in a way that allows the head to rest between the two levers. The head is transferred to the petri dish and rolled onto its forehead. This way, the occipital part of the brain is accessible easily. With the one pair of tweezers, the head is held in position from front, while with the other pair of tweezers, the thin skin on top of the hind brain is cut along the median from posterior into rostral direction, and tugged cautiously along the horizontal plane, until the two hemispheres are exposed. Slightly sagittal from anterior direction, the tweezers are slipped under the rostral part of the brain. That way, the brain can be peeled slowly from the head by lifting it towards the posterior and placing it upside down (with its ventral part pointing upwards) behind the head. This way, the meninges, which are partly reddish due to the blood vessels, can be gripped from the ventral side of the brain and pulled upwards until they are torn apart and are removed from the hemispheres. The meninges cannot always be removed as a whole. The brain substance itself shines completely white. The brain is then transferred onto the cap of the petri dish and minced for approximately 30 to 60 seconds (depending on its size) with scalpel blades until it has a smooth texture. The dish may be turned several times for 45 degrees to assure homogeneous mincing. After that, the minced brain will be immersed in the trypsin and DNase I containing solution and sucked into the
129
PASTEUR pipette. The suspension is transferred back into the cup and triturated gently several times. The cup will then be incubated in the CO2 incubator for 4 to 6 minutes, depending on the amount of cells and on the homogeneity of the suspension. After incubation, the cells are triturated again a bit more vigorously for complete homogenization. Depending on the amount and the size of the remaining cell aggregates, this has to be done 15 to 45 times, but should not exceed 50 times. Probably this is the most stressful procedure for the cells and should be reduced to a minimum. The cup with the milky cell suspension is centrifuged for 3 min at 5.5 g (or 2500 r·min-1, index 2.5). The cell pellet may then be incubated in trypsin inhibitor after renewed trituration and centrifuged again afterwards. However, cells will develop perfectly without trypsin inhibitor when the pellet is transferred directly into a cell culturing well with prewarmed NBM, and dissociated by gentle trituration. The supernatant of the trypsin solution may be discarded or transferred partly to the second well with prewarmed NBM for comparative development studies. However, if the ratio of trypsin solution to NBM exceeds one, cell development and cell differentiation will be inhibited completely. Cells from the pellet suspension are distributed onto various culturing chambers as needed. This procedure may be quite time consuming. It is therefore recommended to store the stock cell suspension meanwhile in the CO2 incubator. The following flowchart will summarize the single steps as described above.
APPENDIX
130
Preparation (up to 45 minutes)
Start the hood 15 minutes prior to work Wipe work bench with 70% ethanol Thaw trypsin - DNase I solution as well as laminin and PDL solution Sterilize instruments and materials with 70% ethanol Prewarm NBM and trypsin-DNase I solution in CO 2 incubator (Hydrophilize autoclaved MEAs briefly with torch) Drop laminin and PDL solution onto the electrode area of the MEA and let dry Rinse MEAs thoroughly with bidestilled water and let dry Cell extraction procedure (up to 20 minutes)
Rinse outer egg shell with 70% ethanol Open egg on bottom side and decapitate embryo Transfer head to petri dish and extract brain Remove meninges and transfer brain to cap of petri dish Mince brain with scalpels up to 1 minute while turning the cap temporarily Transfer cells into (prewarmed) trypsin-DNase I solution and mix gently Incubate for 4 to 6 minutes in CO2 incubator Triturate 15 to 45 times until fairly homogeneous Centrifuge for 3 minutes at 5.5 g (2500 r/min or index 2.5) (Incubate cell pellet in trypsin inhibitor for 5 minutes and centrifuge) Transfer cell pellet to prewarmed NBM solution and dissociate gently (Transfer supernatant to prewarmed NBM) Store culture plate in CO2 incubator Cell distribution onto perfusion chambers (up to 15 minutes)
Take 0.2 ml of cell suspension from stock Return culture well plate to CO2 incubator Fill perfusion chamber with cell suspension and assemble Transfer perfusion chamber to CO2 incubator or recording station Repeat procedure until all chambers have been filled 142 Summary of the cell extraction and seeding procedure. Steps in dotted fields are not necessarily required. With autoclaving the preparation can consume
up to 2.5 hours. Drying the MEAs in the flow of the sterile work bench after the application of laminin and/or PDL will already take one hour.
PROTOCOLS AND PROCEDURES
Longer exposure of the cell cultures to ambient room temperature for up to 30 minutes did not affect cell viability noticably. However, an increase of temperature above 39°C led to rapid deterioation of network connections and subsequent cell death. Likewise low pH down to 6.5 will not affect cell viability for several hours, at least if the downward gradient forms slowly over time. But higher pH above 8.0 will rapidly lead to axon recession and death of the whole network within minutes. In an undesirable synergetic effect, higher temperatures will decrease the solubility of carbondioxide in the medium, thus raising the pH level at the same time. Counting the number of viable cells [SIG 96]
Trypan Blue is one of several stains recommended for use in dye exclusion procedures for viable cell counting. This method is based on the principle that live (viable) cells do not take up certain dyes, whereas dead (non-viable) cells do. Staining facilitates the visualization of cell morphology. Transfer 0.5 ml of 0.4% Trypan Blue solution (w/v) to a test tube. Add 0.3 ml of fresh medium and 0.2 ml of the cell suspension (dilution factor = 5) and mix thoroughly. Allow to stand for 5 to 15 minutes. If cells are exposed to Trypan Blue for extended periods of time, viable cells, as well as non-viable cells, may begin to take up dye. With the cover-slip in place, use a PASTEUR pipette to transfer a small amount of Trypan Blue-cell suspension mixture to both chambers of a standard hemocytometer. Carefully touch the edge ot the cover-slip with the pipette tip and allow each chamber to fill by capillary action. Do not overfill or
131
underfill the chambers. Count all the cells in the central 1 mm square and the four 1 mm corner squares of each chamber. Only count cells that lie within the square or those that touch the upper and left edges of each square but not those that touch the right and bottom edges. Non-viable cells will stain blue. Keep a separate count of viable and non-viable cells. Each square of the hemocytometer, with cover-slip in place, represents a total volume of 0.1 mm3. Since 1·104 mm3 is equivalent to approximately 1 ml, the subsequent cell concentration per ml (and the total number of cells) will be determined using the following calculations: cells per ml = the average count per square · dilution factor (= 5) · 104 (count of 10 squares). The number of total cells is equivalent to the number cells per ml · the original volume of fluid from which the sample was removed. Cell viability in percent is the ratio of total viable cells (unstained) and total cells (stained and unstained) · 100. Culture maintenance [FRE 90 · MQD 94 · COH 95 · BAN 98]
The medium of the cultures may be replaced after the first day, thereby removing dead cell debris and other remnants. This is only recommended for regular cultures with serum and grown on PDL+laminin. Cultures in serum-free medium tend to mind the medium replacement and might die as a consequence. Usually half of the medium has to be exchanged after 3 to 4 days. An indication is the drop in pH and the associated change in color of the pH indicator phenolphtalein from pink-orange to orange-yellow.
APPENDIX
132
Electrodeposition of iridium
For electrochemical metal deposition and oxidation of the iridium films, a computer controlled EG&G potentiostat (model 273 with EG&G Research Electrochemistry Software M270) was used. Iridium was deposited onto blank platinum strips with dimensions 0.5⋅10 mm2 after cleaning them thoroughly with acetone. The strips were inserted into PTFE electrode mountings and immersed into the iridium solution in the PTFE well (figure 146). The whole assembly was heated on a laboratory heating plate. The silver/silver chloride reference electrode (Cl- | AgCl, Ag: in saturated aqueous E0 = +0,222 V KCl [HIB 76]) and the platinum counter electrode were separated from the working electrode by means of an argarose membrane which was saturated with KCl as well. Qualitative evaluation of the electrodeposited metal layers before and after oxidation was performed by SEM, SFM (not included), EDX, and XPS for iridium. Impedance spectroscopy (IS) was applied for quantitative characterization. The iridium plating bath contained 1 g iridium (IV) chloride hexahydrate (hexachloroiridic acid, H2IrCl6·6H2O, Fluka, 58210) per 250 ml of 0.1 M HCl (final concentration approx. 0.01 M). Potassium sulfate (K2SO4, Fluka, 60532) was added up to a concentration of 0.3 M, since no iridium films could be obtained without that special supporting electrolyte salt in contrast to an earlier publication by VUKOVIC and CUKMAN. [VUK 92] As the electrolyte, potassium chloride (KCl, ICN Biomedicals, 191427) was added up to a concentration of 0.3 M. Iridium plating could only be observed at temperatures above 65°C (338 K).
It was deposited onto the platinum with 1 to 250 cycles between 0 V and -2 V, with scanrates of 0.3 to 0.5 V⋅s-1, respectively, and with vertex-delays between 0 s and 60 s at temperatures between 65°C and 95°C. These parameter boundaries led to different fine grain iridium layers with various extruding iridium clusters on the surface, differing visibly in size. parameters for electrodeposition of iridium
Thin, stable layers, rather fine grained, but rough, partly inhomogeneous, but without ruptures voltage ramp [V]
scan-rate [V·s-1]
vertexdelay [s]
# of cycles
temp. [°C]
0 to -2
0.5
1
150
65
0.6 to -1.6
0.1
100
15
65
Thick, black iridium layers with macroscopically homogeneous textures and velvet-like appearances. However, mechanical stability of these layers is rather poor. voltage ramp [V]
scan-rate [V·s-1]
vertexdelay [s]
0 to -2
0.5
60
# of cycles
temp. [°C]
25 -100 70 - 85
Electrochemical oxidation of electrodeposited iridium
The electrochemically iridium covered platinum strips were cycled 400 to 5000 times with triangular waves between -0.3 and 1.3 V against a Ag/AgCl reference electrode in 0.5 M H2SO4 at a scan-rate of 1 V⋅s-1 without any vertex-delay as a slightly modified process after GOTTESFELD & MCINTYRE. [GOT 79] Direct formation of an oxide layer from an K2SO4 containing H2IrCl6 solution, as described by JAWORSKI et al., [JAW 92] could not be obtained. Iridium-polypyrrole co-deposition
Iridium-covered platinum strips were rinsed thouroughly with destilled water and
PROTOCOLS AND PROCEDURES
133
transfered to a different bath that contained an aqueous pyrrole solution. For that purpose, pyrrole (Sigma, P 4892) was added 'as is' to bidestilled water with 0.3 M KCl to a final concentration of 0.1 M without prior purification (slightly brownish appearance). As expected, most of the pyrrole did not dissolve but rather formed an emulsion even after ultrasonication for 10 minutes. parameters for electrodeposition of pyrrole
Highly fractal, rather fine grained, and highly porous but still stable polypyrrole deposit. voltage ramp [V]
scan-rate [V·s-1]
vertexdelay [s]
# of cycles
temp. [°C]
-0.4 to +1.3
0.1
0
5
60
Thin, dense, and stable polypyrrole film of black-greyish-green appearance. voltage ramp [V]
scan-rate [V·s-1]
vertexdelay [s]
# of cycles
temp. [°C]
-0.3 to +0.8
0.4
0
3
72
Thick, dense, black polypyrrole layers with bumpy textures. High mechanical stability, especially after 10 hours of drying on air. voltage ramp [V]
scan-rate [V·s-1]
vertexdelay [s]
# of cycles
temp. [°C]
-0.3 to +1.0
0.5
60-600
5
75
Alternatively, iridium and pyrrole could be electrodeposited onto platinum in a combined electrochemical cycling procedure. For that purpose, pyrrole was added to an iridium(IV) chloride hexahydrate solution as mentioned above. The potential was cycled 5 times at 75°C between -1.6 V and +0.8 V, with a scan-rate of 0.5 V·s-1. The potential was delayed each time for 100 s at the starting potential of -1.6 V. As a result, a rather thick and sandy layer developed. However, brittle polymer bubbles (like on a pizza dough) appeared as well. Probably this phenomenon results from the low pH that has an influence on the texture of polypyrrole. In addition, the low
pH leads to a mere chemical polymerization after 10 to 30 minutes. Surface modification with adhesion promoting substances Physorption of poly-D-lysine / laminin films on ITO and MEA-surfaces after flame activation
Before exposing the substrate surfaces to solutions of PDL and/or laminin, they are exposed several times (1 to 4) briefly to the flame of a butane-torch to ‘activate’ their uppermost layer. The temperature of the flame may reach 1300°C. To minimize stress phenomena in the material, the flame is wiped swiftly over the point of interest or approached woodpecker-like to the surfaces. The heat-activation leads to a noticable increase in their hydrophilic properties, probably by removing any pollution oxidatively, and by forming hydrophilic surface groups like hydroxy- or carboxygroups, depending on the material of the substrate. The idea is to enhance the physisorption of PDL or laminin on the substrate. A mixture of an bidest. aqueous solution of 100 mg·ml-1 PDL without any additives, and an bidest. aqueous solution of 100 µg·ml-1 laminin without any further additives are allowed to sit on the ITO surface for up to one hour (or until dry) under the sterile flow bench. The supernatant is then discarded and the surface rinsed at least three times with sterile bidest. water. Electropolymerization of phenol and pyrrole derivatives for adhesion studies
Phenol, pyrrole, and their derivatives have been used in various concentrations between 0.01 M and 0.2 M. The aqueous solutions contained approximately 0.3 M of KCl as the electrolyte salt. Deposition was always performed at room temperature. Substrates
APPENDIX
134
have been cleaned with soapy water, then with acetone, and finally with destilled water. parameters for electrodeposition of phenol, pyrrole and their derivatives
Polymer layers that have been used and investigated by C. WEINL. [WEI 99] voltage ramp [V]
scan-rate [V·s-1]
vertexdelay [s]
# of cycles
temp. [°C]
0.1 to 1.1
0.5
0
60-120
25
Polymer layers that have been used mainly for cell adhesion studies in this thesis. voltage ramp [V]
scan-rate [V·s-1]
vertexdelay [s]
# of cycles
temp. [°C]
-0.1 to 1.0
0.3-0.4
20
5-50
25
Earlier parameters for electrodeposition of 3HPA-laminin epitopes and for CV studies of the polymer deposition process. voltage ramp [V]
scan-rate [V·s-1]
vertexdelay [s]
# of cycles
temp. [°C]
0.2 to 1.2
0.1
20
20
25
-0.2 to 1.4
0.1-0.4
0
10-30
25
Postmodification of 3HBH polymeric films with amino acids
Substrates with electropolymerized 3HBH films are treated with a solution of 0.5 molar amino acid, 0.6 molar DCC, and 30 mmolar DMAP in absolute DMF or THF, respectively, to form an active ester of the acid which will react with the 3HBH to form a peptide-like bond. Solubility of the acids is rather poor in these solvents though. However, other organic solvents tend to dissolve the polymer. The substrate with the solution is heated to 40°C for approx. 20 minutes. Electronic parts
All electronic parts have been purchased at Conrad Electronics, Hirschau, Germany (regular electronic parts, voltmeter LCD display), RS Components GmbH, Mürfelden-
Walldorf, Germany (SMD sized amplifier ICs, telephone plugs), or Bürklin, Munich, Germany (test pins and caps). Chamber assembly
A critical issue in chamber assembly is the need for permanent and strong coupling of the brackets onto the substrate. The bracket material itself should be made from thermostable plastics like polycarbonate, for in general the chamber has to be autoclaved lateron. Where possible, the brackets can be fixed by screws. In case of gluing, one has to keep in mind that the glue has to withstand high thermal (autoclaving) as well as mechanical (base of a lever) stress lateron. Many strong glues have been tested and did fail for the following reasons: They either did not stick with sufficient strengths to smooth surfaces like glass and/or plastics (metal two component resins), they did not withstand repetitive autoclaving (superglue, hyloglue, Hartkleber, ...), or they detached from the substrates or plastics with longer exposure to the warm and humid atmosphere of the incubator (UHU greenit, UHU two component resin, Araldit™ two component resin, superglue). In case of attaching brackets made from polycarbonate onto glass, indium tin oxide covered glass, or silicon nitride covered glass, the only suitable glue tested seems to be the black flange sealant 5910 from Loctite, Munich, Germany, after cure for 24h at 70°C. Other polysiloxanes (Dow Corning, 732 RTV multi purpose sealant, Midland, MI, U.S.A.; Marston-Bentley-Domsel, Hylosil, Zülpich, quick-mix, Germany; Glas Silikon, Osnabrück, Germany) may work as well, but do not hold the two components together as reliably as the silicone flange sealing paste. Some polysiloxanes only adhere well to glass (polysiloxanes for aquarium assembly) but poorly to plastics.
ALTERNATIVE DEVICES FOR ELECTROPOLYMERIZATION For gluing the brackets with polysiloxanes, it is important to press them relatively tightly onto the glue, and to test their fix positioning by slightly scraping over their surfaces: If they do not move noticably anymore, chances are high that they will withstand higher tensions after cure. However, if there is a cushion of glue between bracket and substrate, the bracket will detach most likely with mechanical stress. The polysiloxane was cured at 70°C for at least 24 hours; longer curing (at higher temperatures) seems to increase stability even more. Polysiloxane is a perfect glue for attaching brackets made from glass onto glasslike substrates, since it does not adhere to plastics with the same strength. Unfortunately, it is not easy to drill holes into glass without special equipment. Dissolving the lower surface of the plastic brackets with appropriate organic solvents (toluene for polycarbonate, acetone for polyacryl) and pressing it onto dust or fragments of glass, which will be incorporated into the bracket material, did not show a significant increase in adhesion strenghts.
Alternative devices for electropolymerization For parallely coating electrodes with electropolymerizable adhesion factors, a 24-channel potentiostat setup has been developed. It is intended for mass throughput of electrodes, after optimal coating compositions have been found. 24-channel potentiostat
The 24-channel potentiostat for electropolymerisation purposes is only a manifold-type version of the one-channel
135
potentiostat described in the materials section above. The only difference is the implementation of a multiplexer unit for quasi-parallel control of each channel and an additional 1 µF capacitor at the working electrode to keep the applied potential constant over the entire multiplexing period. (Calculation: with a time constant τ = RCell·C [MΩ·µF = s], during which the potential, supplied by the capacitor, has decreased to e-1, and with typical values of RCell ≥ 100 kΩ for polymerization events at small-sized electrodes, the potential is stable for approx. 1 ms (with ln y = -t/τ for y = 0.99, that is, if the applied potential is allowed to drop to 99% of its initial value). With charging times of only 1 µs for a 1 µF capacitor, with charging currents of 0.2 A and desired potential steps of 0.2 V (resulting from the definition of one FARAD), and with assumed multiplexer switching delays of about 1 µs, all 24 channels may be served within less than 50 µs.) The 24 channels are distributed over 3 identical circuit boards with eight independent potentiostats and current to voltage converters, each (in both cases Burr Brown, OP602AB).
APPENDIX
136
5
B
D/A 1 D/A 2 +15V INH
A/D 0
6 4
A A/D 6 A/D 4 A/D 2
C
7
3 0 1 2 7/1
5/1
4/1
3/1
2/1
Potentiostaten mit Multiplexer & Strom-Spannungswandler Version 1.0 2/96 Entwurf und Beratung: Gerd Noetzel Layout und Realisation: Axel Blau
1/1
5*3
RRef.
0/1
(0.1 inch)
2
ROff.
Flatband cable connector to the A/D - D/A-computer board
+15V
A B C
INH 7 5 4
D/A 1
6
D/A 2
2 1 0 3
INH -15V
+15V
GND
A B C
GND
Transistors BS 170: coupling of +5 V TTL signals from the Multiplexer Multiplexer computer to HC 4501BE Pull-up resistor HC 4501BE +15 V of the circuit for Inhibit 1 for D/A 2 for D/A 1
Variable resistors for offset correction of the opamps
Operational amplifier OP 6502 as a potentiostat
Opa
I-U-Conv.
Operational amplifier OP 6502 as a currentto-voltage converter
GND
Flatband cable connector to the electrodes
143 Circuit layout of one of the tree circuit boards of the 24channel potentiostat. The design of each channel is equivalent to that of the onechannel potentiostat. The only two differences are 1.) the implementation of a multiplexer unit to switch between the single channels, and 2.) the buffering of the applied potential by an additional 1 µF capacitor. (Upper signal leads are black, that on the bottom are slightly grey.)
ALTERNATIVE DEVICES FOR ELECTROPOLYMERIZATION Software for simultaneous control of 24 potentiostat channels
Below is a hardcopy of the 24 channel setup programmed with the software Testpoint™ from Keithley Instruments®. From button panel 1 all other panels may be called. On panel 2, the potentials, the cycling parameters, and the number of experiments may be set. On panel 3, the shape of the potential will be chosen. On panel 4, the set parameters may be distributed independently onto different channels. That way, a different potential pattern may be applied to each channel independently. Furthermore, each channel may be switched on or off by
145 Hardcopy of the software package driving the 24channel potentiostat. Arbitrary voltage patterns may be set, previewed and applied to the working electrode for
137
choice. File handling is controlled by panel 4 as well. Panel 5 is showing the time and resultion resulting from the chosen parameters as well as the actual potential and the measured current at a specific electrode while running the experiment (upper empty displays). On panel 6, the chosen potential pattern that will be applied to a certain electrode may be previewed. In panel 7, various environmental parameters (temperature, pH, ...) may be entered which will be inserted into the file header. During the experiment, the measured current may be displayed as a function of the applied potential on a separate graphic display for each channel simultaneously (not shown).
each channel independently. During the experiment, measured parameters are displayed as numbers and can also be viewed graphically on a separate panel for all 24 channels simultaneously (not shown).
138
Electrode mounting
As an alternative mounting device for electropolymeric film deposition onto interdigitated electrodes, a cylindric PTFE clamp has been developed. It fits exactly into a well of a regular 24-well culturing tray. On its bottom slope, an electrode plate (interdigitated comb electrode, ITO-plate) with dimensions of up to 10 mm · 10 mm · 1 mm may be clamped and contacted with two test pins. On its back, there are the reference (Ag/AgCl) and the counter electrode (Pt) wires next to each other with a length of 10 mm and a diameter of 0.5 mm, each. Every electrode mounting may be served independently from all the others by the 24-channel potentiostat. Figure 146 displays one of those electrode mountings. For single experiments and in cases, where the reference electrode or the counter electrode should be separated from the polymerization chamber, a PTFE brick with two separate cylindrical chambers has been build. The volumes of the two chambers are kept apart by an agarose stick in the central hole of the brick. In the upper left corner, there is an additional cavity for the insertion of a thermometer. A PTFE ring will seal the mounting towards the environment. Some advantages of those mountings are their easy handling and the facile connection of the electrode plates, the small effective working volumes of less than a milliliter, their firm fit within the culturing wells, and the fact that they can be autoclaved. However, there are some practical problems as well, mainly due to the material properties of PTFE: its hydrophobicity will sometimes lead to improper wetting of the inserted electrodes, mainly in small liquid volumes.
APPENDIX Furthermore, some organic compounds tend to diffuse into the PTFE (e.g. pyrrole).
146 Cylindrical PTFE mounting device for electrochemical surface modification of small electrode plates. It may either be inserted in a two chamber PTFE brick as shown above, or into a well of a 24-well cell culturing plate (figure below). The two chambers may be separated by an agarose diaphragm.
147 Each PTFE mounting device may be inserted in one of 24 well of a regular cell culturing plate. With this setup, 24 electrode plates (interdigitated electrode plates of ITO slips) may be modified in parallel with the same or different electropolymerizable adhesion molecules, respectively.
ALTERNATIVE CELL CULTURING CHAMBERS
Alternative cell culturing chambers Various chamber designs and their characteristics
The following paragraph will present some of the preceding perfusion chamber designs that were replaced one by one with newer versions. The only intention of this comparative exhibition is to demonstrate the evolution of the concept and the necessary
139
simplification process during chamber development. It may become clear from that comparison, what kind of mistakes should be avoided. As a preceding remark, it should be mentioned that in all cases an ITOcovered glass will be used as a heating element. It is always placed in such a way, that the ITO side does not stay in direct contact with the culturing medium.
B
C
D A 148 Different perfusion chamber designs with approximate scale of 1:1. While design A, made from PTFE, included a three-way PTFE valve and a separate septum-covered inlet for analytes, later designs like B and
C, which were made out of polyacryl, were heading towards smaller dimensions and simplification. The most simple but least flexible device was chamber D, made out of glass.
APPENDIX
140
Design A
Sketch of the very first design of a perfusion chamber made from PTFE with dimensions 68.6 mm · 40 mm · 14 mm. It is rather similar to the stainless steel perfusion chamber design by GROSS. [GRO 94] However, it implements a separate screw-on septum-covered access for analytes and a stepper-motor controlled PTFE valve. Four screw-on LUER-plugs serve as tubing connectors for tubing that carries fresh medium (front) to and waste (rear) from the chamber. From bottom in the central opening, a round glass slide (∅ 23 mm) is glued with special PTFE glue (LOCTITE, 770 + 406) to a PTFE rim. The whole unit is sitting on a MEA and sealed by a biocompatible Viton™ or Kalrez™ (perfluoro-) rubber ring between MEA and glass slide. Two channels are connecting the resulting chamber (with a volume of approx. 500 µl) between medium and analyte inlet, and valve outlet. Those channels are entering the chamber at a second rim. An ITO-covered glass plate as a heating unit with same dimensions as the MEA is placed below the MEA. The whole assembly is sitting on a transparent methyl-methacrylate tray with dimensions 80 mm · 80 mm · 6 mm and a central hole. On the central area, regions are spared out for the heating plate and the MEA. Rubber bands are holding the arrangement in place. The central square cavity has thin wires on its left and right side to contact the ITO of the heating plate from below. A small channel is left out at the rear edge of that cavity for housing the temperature sensor. Wiring is accessible through the back end of the tray. The chamber is microscopically accessible from top and/or bottom.
The chamber has a few serious disadvantages, though. The manufacturing process is rather complicated, especially that of the supply channels. There are sealing problems around the PTFE valve. Furthermore, PTFE is not as chemically inert as presumed. The problem with PTFE is that organic solvents may diffuse into the material and stay there for prolonged time. As a result, those chemicals (e.g. analytes) may be dissolved in fresh medium (HESS‘ law of distribution), thereby intoxicating the culture and leading to irreproducible analytical results. Design B
In the second design, no internal valve is provided. Furthermore, the size of the chamber is reduced drastically to dimensions 20 mm · 20 mm · 4 mm. The frame of the chamber is made of methyl-methacrylate. Firstly, a silicon rubber sealing ring, made from a septum, is placed onto the MEA. That ring has to be filled up with cell suspension before an ITO-covered glass plate is placed on top of it. Only then, the frame is pressed from top onto the core and glued onto the MEA (semi-) permanently either with adhesive tape (Tesa Power Strips™, photo strips, carpet tape) or with removable (photo) glue. From top, two facing screws contact the ITO electrically. Two thin syringe needles or polyimide covered glass capillaries from gas chromatography with outer diameters of 0.5 mm are inserted into diagonally facing channels within the frame. They are piercing the sealing ring from both sides and serve as medium inlet or waste outlet, respectively. This sort of intermediate design has some major disadvantages, though. It is very difficult and time-consuming to glue the frame onto the MEA, for there is no glue
ALTERNATIVE CELL CULTURING CHAMBERS with short enough curing times. And prolonged times outside of the incubator are stressing the cultures from the very beginning. If superglue is used, the cultures are contaminated immediately by toxic fumes that diffuse into the sealing ring and from there into the medium (this is a general problem with glues that contain organic solvents). The glue cannot be replaced by adhesive tape because apparently there is no adhesive tape that withstands the humidity within the incubator or that of spilled medium. Furthermore, adhesive tape is usually not strong enough over time to withstand the tractive force of the pressed sealing ring. Therefore, chambers usually loosen from the MEA within hours. In addition, rather often the capillaries become clogged by pieces of rubber when they pierce the sealing ring. Finally, gas bubbles can only be removed by awkwardly turning the chamber. However, due to surface tension and adhesion phenomena, also then they cannot always be placed right in front of the capillaries, making this task of gas ejection a very difficult one. Design C
The frame of design C is similar to that of design B. It has even a little smaller dimensions with 20 mm · 16 mm · 2 mm. As the only major difference, a square cavitiy is spared out on top for inserting the ITOcovered glass. This way, the frame can be glued onto the MEA before the sealing ring at its center will be loaded with the cell suspension. The MEA-frame composite may also be autoclaved if the frame is made of polycarbonate and the glue is resistant to heat and/or humidity (like silicone sealant, especially LOCTITE, 5910). Other glues (two component resins, superglue, contact glue) will fail for various reasons, as mentioned in the chamber assembly chapter.
141
The sealing ring may be pierced by the capillaries in advance as well. That way, any congestion can be removed before final chamber assembly. Once the sealing ring has been filled with cell suspension, the ITOcovered glass will be placed on top of the ring and pressed onto it by means of two screws. The heads of the screws will also contact the ITO-layer electrically for heating puroses. At one side of the frame, there is a cavitiy to house the temperature sensor. With this chamber, the issue of expelling unwanted gas bubbles is still a problem. For the capillaries are entering the chamber from the sides, gas bubbles cannot be ejected automatically with increased medium flow, as already discussed above. Design D
As an alternative, the most simple design D consists of a ITO-covered glass plate with dimensions 20 mm · 16 mm · 1 mm. On the opposite side of the ITO layer, a circular shaped chamber is milled. On front and back, two channels for inserting capillaries are leaving the central area towards the edges. The glass plate will be glued onto the MEA permanently with biocompatibe (silicone-) glue. After curing and autoclaving, it will be charged with the cell suspension through the capillaries. The chamber volume depends on the diameter and depth of the central region. It will be in the range of 1 µl to 10 µl. The ITO may be contacted with wires from above. Polishing the milled side of the glass is somewhat tedious. It is also time consuming to coat the central MEA surface with adhesion promoting substances like PDL and/or laminin for the small diameters of the capillaries and the slow evaporation of water through them. A problem could also arise if the cell suspension contains some larger cell clusters that might clog the capillaries.
APPENDIX
142
Finally, there is no way to open the chamber without losing the culture.
scale. In addition, component placement is sketched in each case.
Circuit boards for
60-channel amplifier
photoreproduction
The amplifier is a two-sided circuit board and has to be realized twice. The two boards may be stacked on top of each other.
In the follwing paragraph, the circuit boards for photoreproduction are presented in a 1:1
155 Top layer of the amplifier circuit for photoreproduction
CIRCUIT BOARDS FOR PHOTOREPRODUCTION
143
156 Bottom layer (already mirrored) of the amplifier circuit for photoreproduction.
157 Top (left) and bottom (right) layer of the amplifier circuit (top: first amplification stage, amplification of 47; bottom: second amplification stage, amplification of 33 or vice versa) and component placement for four channels. The SMD operational amplifiers (MC33272, Motorola) are placed at the center. It is very important to check for the right connection of the power supply because wrong
association will destroy the amplifiers within seconds. The same is true for the insertion of the 10 µF capacitors. The component placement is identical for each of the eight quad-amplifier on the top and on the reverse side of the board, respectively.
APPENDIX
144
Part list for the two stacked amplifier boards
2*32
SMD type quad-operational amplifiers MC33272 (Motorola)
3*60
10 kΩ SMD resistors
2*30
330 kΩ SMD resistors
2*30
470 kΩ SMD resistors
2*30
20 nF SMD capacitors
2*32
0.1 µF SMD capacitors
2*32
10 µF miniature capacitors
60
gold testing contact pins
various
1.27 mm sockets
various
2.54 mm sockets
160 Placement of the components on the single-channel potentiostat circuit board.
One-channel potentiostat Part list for the one-channel potentiostat
159 Single layer one-channel potentiostat circuit for photoreproduction.
2
operational amplifiers OPA 602 (Burr Brown)
1
330 Ω reference resistor
2
100 kΩ variable resistor (side access)
various
2.54 mm sockets
2
8-pin DIL sockets
1
3.5 mm audio stereo socket (for power supply)
CIRCUIT BOARDS FOR PHOTOREPRODUCTION
145
Motor and temperature controller
1
1 MΩ variable resistor (top access)
1
1.2 kΩ resistor
1
2 kΩ variable resistor
1
3 kΩ variable resistor (top access)
1
33 kΩ resistor
1
330 Ω resistor
1
5.6 kΩ resistor
various
1.27 mm sockets
various
2.54 mm sockets
1
10 µF capacitor
4
10 µF capacitors
2
100 Ω variable resistors
1
16 DIL socket
1
2-state 2.54 mm mini-switch (H/F)
6
2-state miniatur switches
161 Placement of the components on the two-part motor and temperature controller board. There are switches for two choice slow/fast-mode motor operation, for forward/reverse-motor operation, for system on/off, for separate motor on/off, for motor half/full-step, and for toggling the display between sensed and adjusted temperature. The upper display circuit board for a backlit Falcon DPM951 voltmeter display is installed via four 1.27 mm sockets on top of the stepper motor (with the appropriate plugs), whereas the driving circuit board is placed vertically behind the stepper motor. Both boards are connected by two flatband cables: one three-wire cable for the display of the temperature and one four-wire cable for the stepper motor.
1
3.9 V ZEHNER diode
1
8-pin DIL socket
1
flat top western telephone socket 6/6
1
LM555 timer IC (National Semiconductor) or equivalent
1
LM759 power amplifier Semiconductor)
Part list for the temperature & motor controller
1
Falcon DMP951 panel mount 5V digital multimeter (Trumeter)
1
SAA1042 bipolar stepper driver IC (National Semiconductor)
1
0.01 µF capacitor
1
1 µF capacitor
1
3.6 mm socket
walkman-type
power
circuit
board
operational (National
146
APPENDIX
162 Single layer motor driver and temperature controller circuit (bottom) with display adaptor (top) for photoreproduction.
LITERATURE ADE 87
Adelman, G. (ed.) (1987) Encyclopedia of neuroscience, Birkhäuser, I and II
AKI 91
Akin, T.; Najafi, K. (1991) A Micromachined Silicon Sieve Electrode for Nerve Regeneration Applications, IEEE Transactions on Biomedical Engineering, 5: 128-131
AND 89 Anderson, D. J.; Najafi, K.; Tanghe, S. J. et al. (1989) Batch-Fabricated Thin-Film Electrodes for Stimulation of the Central Auditory System, IEEE Transactions on Biomedical Engineering, 36: 693-704 AOK 87 Aoki, M. (1987) State space modeling of time series, Springer-Verlag, Berlin ARS 95
(1995) Conducting Isopolymers: Preparation, Properties, and Applications, Journal für praktische Chemie Chemiker Zeitung, 337: 1-11
ATK 90
Atkins, P. W. (1990) Physical Chemistry (4th edition), Oxford University Press
AXE 95
Axel, R. (1995) The molecular logic of smell, Scientific American, 273: 154-159
BAI 95
Bain, G.; Kitchens, D.; Yao, M.; Huettner, J. E.; Gottlieb, D. I. (1995) Embryonic stem cells express neuronal properties in vitro, Developmental Biology, 168: 342-357
Arsalani,
N.;
Geckeler,
K.
E.
BAN 98 Banker, G.; Goslin, K. (editors) (1998) Culturing Nerve Cells, second edition, The MIT Press BAR 90
Bartlett, P. N.; Gardner, J. W.; Whitaker, R. G. (1990) Electrochemical Deposition of Conduction Polymers onto Electronic Substrates for Sensor Applications, Sensors and Actuators A, 21-23: 911-914
BDT 98
Burckardt, R., Göpel, W.
Investigation of Bioaffinity with Electrochemical Detection - Characterization of Different Combinations of Markers and Electrodes, Conference Proceedings of the 7th IMCS, Beijing,
(1998)
China: 175-177 BED 94
Bedlack, R. S. Jr.; Wie, M. D.; Fox, S. H.; Gross, E.; Loew, L. M. (1994) Distinct electric potentials in soma and neurite membranes, Neuron, 13: 1187-1193
LITERATURE
148
BEE 88
Beebe, X.; Rose, T. L. (1988) Charge injection limits of activated iridium oxide electrodes with 0.2 ms pulses in bicarbonate buffered saline, IEEE Transactions on Biomedical Engineering, 35(6): 494-495
BEL 96
Belmont, C.; Tercier, M.-L.; Buffle, J.; Fiaccabrino, G. C.; Koudelka-Hep, M. (1996) Mercury-plated iridium-based microelectrode arrays for trace metals detection by voltammetry: optimum conditions and reliability, Analytica Chimica Acta, 329: 203-214
BER 97
Bertozzi,
C.
(1997)
Project
presentation
@
http://www.cchem.berkeley.edu /~crbgrp/, Internet
BIL 89
Billingham, N. C.; Calvert, P. D. (1989) Electrically conducting polymers a polymer science viewpoint, Advances in Polymer Science: 1-104
BLA 95
Blau,
Modifikation und Charakterisierung von Mikroelektrodenstrukturen zur Optimierung der kapazitiven Kommunikation mit Nervenfasern, Diploma Thesis, University of Tuebingen
BLA 97
Blau, A.; Ziegler, Ch.; Heyer, M.; Endres, F.; Schwitzgebel, G.; Matthies, T.; Stieglitz, T.; Meyer, J.-U.; Göpel, W. (1997) Characterization and
A.
(1995)
Optimization of Microelectrode Arrays for in-vivo Nerve Signal Recording and Stimulation, Biosensors & Biolelectronics, 12: 883-892
BOC 70
Bockris, J. O'M.; Reddy, A. K. N. (1970) Modern electrochemistry, Plenum Press
BOE 75
Boeckh, J. (1975) Nervensysteme und Sinnesorgane der Tiere, Herder Verlag, Freiburg
BOP 92
Boppart, S. A.; Wheeler, B. C.; Wallace, C. S. (1992) A Flexible Perforated Microelectrode Array for Extended Neural Recordings, IEEE Transactions on Biomedical Engineering, 39: 37-42
BOV 95 Bove, M.; Grattarola, M.; Martinoia, S.; Verreschi, G. (1995) Interfacing cultured neurons to planar substrate microelectrodes: Characterization of the neuron-to-microelectrode junction, Bioelectrochemistry and
Bioenergetics, 38: 255-265 BRD 80
Bard, A. J.; Faulkner, L. R. (1980) Electrochemical methods: fundamentals and applications, Wiley, New York
BRE 94
Breer, H. (1994) Signal recognition and chemo-electrical transduction in olfaction, Biosensors & Biolelectronics, 9: 625-632
BRG 96
Berger, R. ; Gerber, C.; Gimzewski, J. K.; Meyer, E.; Günthrodt, H.-J. (1996) Thermal analysis using a micromechanical calorimeter, Applied Physics Letters, 69: 40-42
REFERENCES
149
BRI 96A Brischwein, M.; Baumann, W.; Ehret, R.; Schwinde, A.; Kraus, M.; Wolf, B. (1996) Abhörstation für lebende Zellen: Mikrosensorik in Forschung und Klinik, Biospektrum, 3: 48-49 BRI 96B Brischwein, M.; Baumann, W.; Ehret, R.; Schwinde, A.; Kraus, M.; Wolf, B. (1996) Mikrosensorische Systeme in der zellbiologischen Grundlagenforschung und der medizinischen Diagnostik, Naturwissenschaften, 83: 193-200 BRI 98
Brischwein, M. et al.; Ehrfeld, W. (ed.) (1998) The physiocontrol microsystem (PCM): Analysis of cellular behaviour for biomedical research in Microreaction Technology: Proceedings to the first international conference on microreaction technology, Springer-Verlag, Berlin
BRT 94
Brecht,
A.;
Gauglitz,
G.
(1994)
Optimised
layer
systems
for
immunosensors based on the RIFS transducer, Fresenius, 349: 360-
366 BRT 96
Brecht, A.; Burckard, R.; Rickert, J.; Stemmler, I.; Schuetz, A.; Friedrich, Th.; Gauglitz, G.; Göpel, W. (1996) Transducer based approaches for parallel binding assays in HTS, Journal of Biomolecular Screening, 1: 191-201
BRU 83
Brummer, S. B.; Robblee, L. S.; Hambrecht, F. T. (1983) Criteria for selecting electrodes for electrical stimulation: theoretical and practical considerations, Annals of the New York Academy of Sciences, 405: 159-
171 BRW 93 Brewer, G. J.; Torricelli, J. R.; Evege, E. K.; Price, P. J. (1993) Optimized survival of hippocampal neurons in B27-supplemented Neurobasal, a new serum-free medium combination, Journal of Neuroscience Research, 35:
567-576 BRW 95 Brewer, G. J.
Serum-free B27/neurobasal medium supports differentiated growth of neurons from the striatum, substantia nigra, septum, cerebral cortex, cerebellum, and dentate gyrus, Journal of
(1995)
Neuroscience Research, 42: 674-683 BRW 96 Brewer, G. J.; Price, P. J. (1996) Viable cultured neurons in ambient carbon dioxide and hibernation storage for a month, Neuroreport, 7: 1509-1512 BUC 75
Buckley, B. N.; Burke, L. D. (1975) The Oxygen Electrode Part 5. Enhancement of Charge Capacity of an Iridium Surface in the Anodic Region, Journal of the Chemical Society - Faradaic Transactions I, 71:
1447-1459
LITERATURE
150
BUR 84
Burke, L. D.; Scannell, R. A. (1984) An investigation of hydrous oxide growth on iridium in base, Journal of Electroanalytical Chemistry, 175: 119-141
CAE 89
Caesar, M. (1989) Zellkulturen als in-vitro-Modell in der Neurobiologie: histologische und physiologische Untersuchungen an Hippocampus- und Cortex-Slice-Kulturen, Doctoral Dissertation, University of Tuebingen
CAN 97 Canepari, M.; Bove, M.; Maeda, E. Cappello, M.; Kawana, A. (1998) Experimental analysis of neuronal dynamics in cultured cortical networks and transitions between different patterns of activity, Biological
Cybernetics, 77: 153-162 CHR 88
R. Christen, F. Vögtle, (1988) Organische Chemie, Von den Grundlagen zur Forschung, Band I, 1. Auflage, Otto Salle Verlag / Verlag Sauerländer
CLA 93
Clark, P.; Britland, S.; Connolly, p. (1993) Growth cone guidance and neuron morphology on micropatterned laminin surfaces, Journal of Cell Science, 105: 203-212
CLA 94
Clark, P. (1994) Cell behaviour on micropatterned surfaces, Biosensors & Biolelectronics, 9: 657-661
CLR 95
Clarke, R. J.; Zouni, A.; Holzwarth, J. F. (1995) Voltage sensitivity of the fluorescent probe RH421 in a model membrane system, Biophysical Journal, 68: 1406-1415
CNO 90 Connolly, P.; Clark, P.; Curtis, A. S. G.; Dow, J. A. T.; Wilkinson, C. D. W. (1990) An extracellular Microelectrode Array for Monitoring Electrogenic Cells in Culture, Biosensors & Biolelectronics, 5: 223-234 CNO 92 Conolly, P.; Moores, G. R.; Monaghan, W.; Shen, J.; Britland, S.; Clark, P. (1992) Microelectronics and nanoelectronic interfacing techniques for biological systems, Sensors and Actuators B, 6: 113-121 COH 89 Cohen, M. L.; Hoyt, R. H.; Saffitz, J. E.; Corr, P. B. (1989) A high density in vitro extracellular electrode array: description and implementation, American Journal of Physiology, 257: H681-689 COH 95 Cohen, J.; Wilkin, G. P. (etds.) (1995) Neural Cell Culture, IRL Press / Oxford University Press COT 94
Cotman, C. W.; Cribbs, D. H.; Kahle, J. (1994) Controlled Growth of Neurons: Toward Establishing Neural Networks in Culture in: Stenger, D. A.; McKenna, T. M. (eds.) Enabling Technologies for Cultured Neural Networks, Academic Press, New York
REFERENCES
151
CWY 83 Conway, B. E.; Mozota, J. (1983) Surface and bulk processes at oxidized iridium electrodes - II. Conductivity-switched behaviour of thick oxide films, Electrochimica Acta, 28: 9-16
DEN 98
Denyer, M. C. T.; Riehle, M.; Britland, S. T.; Offenäuser, A. (1998) Preliminary study on the suitability of a pharmacological bio-assay based on cardiac myocytes cultured over microfabricated microelectrode arrays, Medical & Biological Engineering & Computing / MBEC Cellular
Engineering Special Feature, 36: 638-644 DER 89
J. C. (1989) Functionalized polypyrrols. New molecular materials for electrocatalysis and related applications, Accounts of Chemical Research, 22: 249-255
DIA 82
Diaz, A. F.; Castillo, J.; Kanazawa, K. K.; Logan, J. A.; Salmon, M. ,. F. O. (1982) Conducting Poly-N-alkylpyrrole Polymer Films, Journal of Electroanalytical Chemistry, 133: 233-239
Deronzier, A.; Moutet,
DMD 85 Diamond, M. C.; Scheibel, A. B.; Elson, L. M. (1985) The human brain coloring book, Harper Perennial / Harper Collins Publishers DOD 91 Dodd, G.; Bartlett, P.; Gardner, J. (1991) Complex sensor systems: odour detection by the sense of smell and by electronic noses, Biochemical Society Transactions, 19: 36-39 DUB 97 Dubin, A. E.; Harris, G. L. (1997) Voltage-activated and odor-modulated conductances in olfactory neurons of Drosophila melanogaster, The Journal of Neurobiology, 32: 123-137 EDS 96
Edström, A.; Ekström, P. A.R.; Tonge, D. (1996) Axonal outgrowth and neuronal apoptosis in cultured adult mouse dorsal root ganglion preparations: Effects of neurotrophins, of inhibition of neurotrophin actions and of prior axotomy, Neuroscience, 75: 1165-1174
EDW 95 Edwards, P. R.; Gill, A.; Pollard-Knight, D. V.; Hoare, M.; Buckle, P. E.; Lowe, P. A.; Leatherbarrow, R. J. (1995) Kinetics of protein-protein interactions at the surface of an optical biosensor, Analytical Biochemistry, 231: 210-217 EGE 98
Egert, U.; Schlosshauer, B.; Fennrich, S.; Nisch, W.; Gfejtl, M.; Knott, T.; Müller, T.; Hämmerle, H. (1998) A novel organotypic long-term culture of the rat hippocampus on substrate-integrated multielectrode arrays, Brain Research Protocols, 2: 229-242
EGG 90
Eggers, M. D.; Astolfi, D. K.; S.Liu; Zeuli, H. E.; Doeleman, S. S.; McKay, R.; Khuon, T. S.; Ehrlich, D. J. (1990) Electronically wired petri dish: A microfabricated interface to the biological neuronal network, Journal of Vacuum Science and Technology, B8: 1392-1398
LITERATURE
152
EIG 94
Eigen, M.; Rigler, R. (1994) Sorting single molecules: Application to diagnostics and evolutionary biotechnology, Proceedings of the National Academy of Sciences of the United States of America, 91: 5740-5747
END 93
Ende, D.; Mangold, K.-M. (1993) Impedanzspektroskopie, Chemie in unserer Zeit, 27: 134-141
ENG 81
Engel, J.; Odermatt, E.; Engel, A.; Madri, J. A.; Furthmayr, H.; Rohde, H.; Timpl, R. (1981) Shapes, domain organizations and flexibility of laminin and fibronectin, two multifunctional proteins of the extracellular matrix, Journal of Molecular Biology, 150: 97-120
ENG 92
Engel, J. (1992) Laminin and other strange proteins, Biochemistry, 31: 10644-10651
FAI 97
Faissner, A. (1997) The tenascin gene family in axon growth and guidance, Cell and Tissue Research, 290: 331-341
FAT 93
Fattinger, Ch.; Koller, H.; Schlatter, D.; Wehrli, P. (1993) The difference interferometer: A highly sensitive optical probe for quantification of molecular surface concentration, Biosensors & Biolelectronics, 8: 99-
107 FEN 96
Fennrich, S.; Stier, H.; Föhr, K.-J.; Ray, D.; Ghersi-Egea, J.-F.; Schlosshauer, B. (1996) Organotypic rat brain culture as in vivo-like model system, Methods in Cell Science, 18: 283-291
FER 93
Ferrer, J. E.; Victori, L. (1993) XPS study of electrochemically generated iridium oxide films, Afinidad, 50: 281-285
FLO 94
Florin, E. L.; Moy, V. T.; Gaub, H. E. (1994) Adhesion forces between individual ligand-receptor pairs, Science, 264: 415-417
FLU 85
Fluhler, E.; Burnham, V. G.; Loew, L. M. (1985) Spectra, membrane binding, and potentiometric responses of new charge shift probes, Biochemistry, 24: 5749-5755
FRE 90
Freshney, R. I. (1990) Tierische Zellkulturen: ein Methoden-Handbuch, Walter De Gruyter & Co., Berlin
FRO 91A Fromherz, P.; Dambacher, K. H.; Ephardt, H.; Lambacher, A.; Müller, C. O.; Neigl, R.; Schaden, H.; Schenk, O. Vetter, T. (1991) Fluorescent dyes as probes of voltage transients in neuron membranes, Berichte der Bunsen Gesellschaft für Physikalische Chemie - An International Journal of Physical Chemistry, 95: 1333-1345 FRO 91B Fromherz, P.; Offenhäusser, A.; Vetter, T.; Weis, J. (1991) A Neuron-Silicon Junction: A Retzius Cell of the Leech on an Insulated-Gate Field-Effect Transistor, Science, 252: 1290-1293
REFERENCES FRO 94
153
Fromherz, P.; Müller, C. O. (1994) Cable properties of a straight neurite of a leech neuron probed by a voltage-sensitive dye, Proceedings of the National Academy of Sciences of the United States of America, 91: 46044608
GAR 91 Gardner, J. W.; Bartlett, P. N. Electropolymerized
Thin
Potential Applications of Films in Nanotechnology,
(1991)
Organic
Nanotechnology, 2: 19-32 GIE 98
Gierschner, J.; Egelhaaf, H.-J.; Oelkrug, D.; Müllen, K. (1998) Electronic deactivation and energy transfer in doped oligophenylenevinylene nanoparticles, Journal of Fluorescence, 8: 37-44
GÖP 94
Göpel, W. (1994) Chemische Sensoren - technische Sinnesorgane für Riechen und Schmecken, Spektrum, 1: 97-100
GÖP 98
Göpel, W.; Ziegler, Ch.; (coordinating authors); Breer, H.; Schild, D.; (biological section); Apfelbach, R.; ; Joerges, J; Malaka, R.; (contributing authors) (1998) Bioelectronic Noses: A Status Report, Part I, Biosensors & Biolelectronics, 13: 479-493
GOT 79
Gottesfeld, S.; McIntyre, J. D. E. (1979) Electrochromism in Anodic Iridium Oxide Films / II. pH Effects on Corrosion Stability and the Mechanism of Coloration and Bleaching, Journal of the Electrochemical
Society, 126: 742-751 GRA 93 Grattarola, M.; Martinoia, S. (1993) Modeling the Neuron-Microtransducer Junction: From Extracellular to Patch Recording, IEEE Transactions on Biomedical Engineering, 40: 35-41 GRA 94 Grattarola, M.; Bove, M.; Verreschi, G. (1994) Characterization of growth and electrical activity of nerve cells cultured on microelectronic substrates: towards hybrid neuro-electronic devices, Journal of Materials
Science: Materials in Medicine, 5: 684-687 GRF 87
Graf, J.; Iwamoto, Y.; Sasaki, M.; Martin, G. R.; Kleinman, H.K.; Robey, G.A.; Yamada, Y. (1987) Identification of an amino acid sequence in laminin mediating cell attachment, chemotaxis, and receptor binding, Cell, 48: 989-996
GRI 82
Grinvald, A.; Manker, A.; Segal, M. (1982) Visualization of the spread of electrical activity in rat hippocampal slices by voltage-sensitive optical probes, Journal of Physiology (London), 333: 269-291
GRI 83
Grinvald, A.; Fine, A.; Farber, I. C.; Hildesheim, R. (1983) Fluorescence monitoring of electrical responses from small neurons and their processes, Biophysical Journal, 42: 195-198
LITERATURE
154
GRI 88
Grinvald, A.; Frostig, R. D.; Lieke, E.; Hildesheim, R. (1988) Optical imaging of neuronal activity, Physiological Reviews, 68: 1285-1366
GRL 93
Grill, R. J. Jr.; Pixley, S. K. (1993) 2-Mercaptoethanol is a Survival Factor for Olfactory, Cortical and Hippocampal Neurons in Dissociated Cell Culture, Brain Research, 613: 168-172
Short-term
GRO 79 Gross, G. W. (1979) Simultaneous Single Unit Recording in vitro with a Photoetched Laser Deinsulated Gold Multimicroelectrodes Surface, IEEE Transactions on Biomedical Engineering, BME 26: 273-279 GRO 93 Gross, G. W.; Rhoades, B. K.; Reust, D. L.; Schwalm, F. U. (1993) Stimulation of monolayer networks in culture through thin-film indium-tin oxide recording electrodes, Journal of Neuroscience Methods, 50: 131-
143 GRO 94 Gross, G. W.; Schwalm, F. U. (1994) A closed flow chamber for long-term multichannel recording and optical monitoring, Journal of Neuroscience Methods, 52: 73-85 GRO 95 Gross, G. W.; Rhoades, B. K.; Azzazy, H. M. E.; Wu, M.-C. (1995) The use of neuronal networks on multielectrode arrays as biosensors, Biosensors & Biolelectronics, 26: 353-373 GRO 95B Gross, G. W.
Internal dynamics of randomized mammalian neuronal networks in culture in: Stenger, D. A.; McKenna, T. M. (eds.) Enabling Technologies for Cultured Neural Networks, Academic Press,
(1995)
New York GRO 96 Gross, G. W.; Gargan, L. (1996) procedure manual, Lab Manual
Neuronal cell culture laboratory
GRO 97 Gross, G. W.; Harsch, A.; Rhoades, B. K.; Göpel, W. (1997) Odor, drug and toxin analysis with neuronal networks in vitro: extracellular array recording of network responses, Biosensors & Biolelectronics, 12: 373-
393 GRO 99 Center for Network Neuroscience (1999) http://www.biol.unt.edu/cnns/, Internet
CNNS
Home
Page
@
GRS 95
Grushina, N. V.; Saprykina, T. I. (1995) Iridium Electrodeposition from Chloride-Perchlorate Solutions, Russian Journal of Applied Chemistry, 68: 113-115
GSS 94
Gross, E.; Bedlack, R. S. Jr.; Loew, L. M.
Dual-wavelength ratiometric fluorescence measurement of the membrane dipole potential,
Biophysical Journal, 67: 208-216
(1994)
REFERENCES HAE 94
155
Haemmerle, H.; Egert, U.; Mohr, A.; Nisch, W. (1994) Extracellular recording in neuronal networks with substrate integrated microelectrode arrays, Biosensors & Biolelectronics, 9: 691-696
HAI 95
Haidarliu, S.; Shulz, D.; Ahissar, E. (1995) A multi-electrode array for combined microiontophoresis and multiple single-unit recordings, Journal of Neuroscience Methods, 56: 125-131
HAM 94 Hamilton, J. D. (1994) Time series analysis, Princeton University Press HAV 98 Hamann, C. H.; Vielstich, W. (1998) Elektrochemie, 3. Auflage, VCH Publishers, Inc. HAR 97A Harsch, A. (1997) Extrazelluläre Ableitungen an neuronalen Netzwerken für die Biosensorik, Doctoral Dissertation, University of Tuebingen HAR 97B Harsch, A.; Ziegler, C.; Göpel, W. (1997)
Strychnine analysis with neuronal networks in vitro: extracellular array recording of network responses, Biosensors & Biolelectronics, 12: 827-835
HAU 96 Haugland, R. P. (1996) Handbook of fluorescent probes and research chemicals, sixth edition, Molecular Probes, Product Catalogue HEA 94
Healy, K. E.; Lom, B.; Hockberger, P. E. (1994) Spatial distribution of mammalian cells dictated by material surface chemistry, Biotechnology and Bioengineering, 43: 792-800
HEI 93
Heidemann R. G.; Kooyman, R. P. H.; Greve, J. (1993) Performance of a high sensitive optical waveguide Mach-Zehnder-Interferometer immunosensor, Sensors and Actuators B, 10: 209-217
HEN 95
Henrion, R.; Henrion, G. (1995) Multivariate Datenanalyse: Methodik und Anwendung in der Chemie und verwandten Gebieten, Springer-Verlag, Berlin
HEU 97
Heuschkel, M. O.; Guérin, L.; Renaud, P. (1997) Microfluidic system for perfusion of solutions to neurons in a network @ Eurosensors XI, Eurosensors Symposium
HIB 76
Hibbert, D. B.; James, A. M. (1976) Dictionary of Electrochemistry, John Wiley & Sons, New York
HIC 95
Hickman, J. J.; Stenger, D. A. (1995) Interaction of cultured neurons with defined surfaces in: Stenger, D. A.; McKenna, T. M. (eds.) Enabling Technologies for Cultured Neural Networks, Academic Press, New York
HIC 99
Hickman, J. J. (1999) Biological interface design for sensor applications, Workshop Bioelectronische Signalwandlung in Membran-FETVerbundstrukturen, 22. April 1999, MPI für Polymerforschung, Mainz
LITERATURE
156
HIL 98
Hill, S. (1998) Sniff'n' shake, New Scientist, 157: 34-37
HOL 98
Holgate, S. A. (1998) Nosy doctor's aide sniffs out disease, New Scientist, 157: 17-17
HRS 95
Harris R. D.; Wilkinson, J. S. (1995) Waveguide surface plasmon resonance sensors, Sensors and Actuators B, 29: 261-267
HRV 95 Harvey, A. C. (1995) Time series models / Zeitreihenmodelle, 2nd edition, Oldenburg Verlag, München HUB 98 Huber, M.; Heiduschka, P.; Kienle, S.; Pavlidis, C.; Mack, J.;Walk, T.;Jung, G.;Thanos, S. (1998) Modification of glassy carbon surfaces with synthetic laminin-derived peptides for nerve cell attachment and neurite outgrowth, Journal of Biomedical Materials Research, 41: 278-288
HVN 96 Heavner, G. A. (1996) Active sequences in cell adhesion molecules: Targets for therapeutic intervention, Drug Discovery Today, 1: 295-304 HZE 96
Heinze, J.; Synowczyk, A.; Tschuncky, P.; (ed. Beck, F.) Elektrochemische Synthese und Charakterisierung von leitfähigen Polymeren, GdCh- Monographie, 3: 501-513
ICH 93
(1996)
intrinsisch
Ichikawa, M.; Iijima, T.; Matsumoto, G. [Ono, T.; Squire, L. R.; Raichle, M. E.; Perrett, D. I.; Fukuda, M. (edts.)] (1993) Real-time optical recording of neuronal activities in the brain in: Brain mechanisms of perception and memory: From neuron to behavior, Oxford University Press
ISH 93
Ishii, K.; Katayama, M.; Hori, K. Yodoi, J.; Nakanishi, T. (1993) Effects of 2-Mercaptoethanol on Survival and Differentiation of Fetal Mouse Brain Neurons Cultured In Vitro, Neuroscience Letters, 163: 159-162
JAC 77
Jacobson, B. S.; Branton, D. (1977) Plasma mebrane: rapid isolation and exposure of the cytoplasmic surface by use of positively charged beads, Science, 195: 302-304
JAM 96
Jameison, F.; Sanchez, R.; Dong, L.; Leland, J.; Yost, D.; Martin, M. (1996) Electrochemiluminescence based quantitation of classical clinical chemistry analytes, Journal of Analytical Chemistry, 68: 1298-1302
JAN 95
Janders, M. (1995) Herstellung und Charakterisierung von DünnschichtMikroelektroden aus Iridiumoxid und Titannitrid zur Stimulation und Ableitung elektrisch aktiver Zellsysteme, Diploma Thesis, University of
Tuebingen JAT 78
Jatzkewitz, H. (1978) Neurochemie, Georg Thieme Verlag, Stuttgart - New York
REFERENCES JAW 92
157
Jaworski, R. K.; Cox, J. A.; Strohmeier, B. R. (1992) Characterization of oxide films electrochemically deposited from solutions of palladium chloride and sodium hexachloroiridate, Journal of Electroanalytical
Chemistry, 325: 111-123 JEN 97
Jenker, M.; Fromherz, P. (1997) Bistability of membrane conductance in cell adhesion observed in a neuron transistor, Physical Review Letters, 79: 4705-4708
JIM 92
Jimbo, Y.; Kawana, A. (1992) Electrical stimulation and recording from cultured neurons using a planar electrode array, Bioelectrochemistry and Bioenergetics, 29: 193-204
JOL 96
Jolley, M. E. (1996) Fluorescence polariation assays for the detection of proteases and their inhibitors, Journal of Biomolecular Screening, 1: 3338
KAM 97 Kamioka, H.; Jimbo, Y.; Charlety, P. J.; Kawana, A.
Planar electrode arrays for long-term measurement of neuronal firingin cultured cortical slices, Cellular Engineering, 2: 148-153
(1997)
KAR 95 Karlsson, R.; Stahlberg, R. (1995) Surface plasmon resonance detection and multispot sensing for direct monitoring of interactions involving lowmolecular-weight analytes and for determination of low affinities,
Analytical Biochemistry, 228: 274-280 KAS 98
Kaspar, M. (1998) Diplomarbeit Michael Caspar, University of Tuebingen
KAT 71
Katz, B.
(1971) Nerv, Muskel und Synapse: Einführung in die Elektrophysiologie, Georg Thieme Verlag, Stuttgart - New York
KIE 97
Kienle, S.
Diploma Thesis,
Mikrostrukturierte Peptid-Funktionalisierung von Oberflächen und kombinatorische Peptidbibliotheken zur Untersuchung von Antigenpräsentation und Transportsystemen, Doctoral Dissertation,
(1997)
University of Tuebingen KIS 83
Kissinger, P. T.; Heineman, W. R. (1983) Cyclic voltammetry, Journal of Chemical Education, 60: 702-706
KIS 96
Kissinger, P. T.; Heineman, W. R. (1996) Laboratory techniques in electroanalytical chemistry, Marcel Dekker, Inc.
KLF 88
Kleinfeld, D.; Kahler, K. H.; Hockberger, P. E.
(1988) Controlled Outgrowth of Dissociated Neurons on Patterned Substrates, The Journal of Neuroscience, 8: 4098-4120
LITERATURE
158
KLM 85 Kleinman, H. K.; Cannon, F. B.; Laurie, G. W.; Hassell, J. R.; Aumailley, M.; Terranova, V. P.; Martin, G. R.; Dubois-Dalcey, M. (1985) Biological activities of laminin, Journal of Cell Biology, 27: 317-325 KNG 83 Kang, K. S.; Shay, J. L. (1983) Blue Sputtered Iridium Oxide Films (Blue SIROFs), Journal of the Electrochemical Society, 130: 766-769 KNO 96 Knoll, W.; Matsuzawa, M.; Offenhäusser, A.; Rühe, J. (1996) Tailoring of surfaces with ultrathin layers for controlled binding of biopolymers and adhesion and guidance of cells, Israel Journal of Chemistry, 36: 357-
369 KOO 94 Koolman, J.; Röhm, K.-H. (1994) Taschenatlas der Biochemie, Georg Thieme Verlag, Stuttgart - New York KOR 75 Koryta, J.; Dvorak, J.; Bohackova, V. (1975) Lehrbuch der Elektrochemie, Springer-Verlag, Berlin KOR 91 Koryta, J. (1991) Ions, electrodes and membranes, 2nd edition, Wiley, New York KÖT 84
Kötz, R., Neff, H.; Stucki, S. (1984) Anodic iridium oxide films, Journal of the Electrochemical Society, 131: 72-76
KOU 94 Kounaves, S. P.; Deng, W.; Hallock, P. R.; Kovacs, G. T. A.; Storment, C. W. (1994) Iridium-based Ultramicroelectrode Array Fabricatred by Microlithography, Journal of Analytical Chemistry, 66: 418-423 KOV 87 Kovacs, G. T. A.; Stephanides, M.; Knapp, W. R.; McVittie, J. P. P.; Hentz, V. R.; Rosen, M. J. (1987) Development of Chronic Implant Neural Prosthesis Microelectrode Arrays, Proceedings of the Institute of Electrical and Electronics Engineers: IEEE Montech Conference on Biomedical Technology, Montreal, PQ, Nov. 1987 KOV 92 Kovacs, G. T.; Storment, C. W.; Rosen, J. M.
Regeneration microelectrode array for peripheral nerve recording and stimulation,
(1992)
IEEE Transactions on Biomedical Engineering, 39: 893-902 KOV 94A Kovacs, G. T.; Storment, C. W.; Halks Miller, M.; Belczynski Jr., C. R.; Della Santina, C. C.; Lewis, E. R.; Maluf, N. I. (1994) Silicon-substrate microelectrode arrays for parallel recording of neural activity in peripheral and cranial nerves, IEEE Transactions on Biomedical Engineering, 41:
567-577 KOV 94B Kovacs, G. T. A. (1994) Neuronal Stimulation/Recording Technology: Introduction to the Theory, Design, and Modeling of Thin-Film Microelectrodes for Neural Interfaces in: Stenger, D. A.; McKenna, T. M. (eds.) Enabling Technologies for Cultured Neural Networks, Academic
Press, New York
REFERENCES
159
KRA 93 Kraus, M.; Baumann, W.; Brischwein, M. Ehret, R.; Leroux, C.; Wolf, B. (1993) Biosensorik mit zellulären Systemen, Bioscope, 1: 24-33 KSJ 91
Kandel, E. R.; Schwartz, J. H.; Jessell, T. M. (1991) Principles of Neural Science, Elsevier Science Publishing Co., Inc., Amsterdam
KSJ 96
Kandel,
E.
R.;
Schwartz,
J.
H.;
Jessel, T. M. (ed.) (1996) Neurowissenschaften / Eine Einführung, Spektrum Akademischer Verlag
LAM 98 Lam, L. (1998) Nonlinear physics for beginners / Fractals, chaos, solitons, pattern formation, cellular automata and complex systems, World Scientific LAU 99
Lauterborn, W.
(1999)
Software for non-linear data analysis @
www.dpi.physik.uni-goettingen.de, Internet
LBR 92
Lambrechts, M.; Sansen, W. (1992) Biosensors: Microelectrochemical Devices, Institute of Physics Publishing
LER 97
Lerchner, J.; Wolf, G.; Torralba, A.; Torra, V. (1997) Ambient pertubation reduction in microsized calorimetric systems, Thermochimica Acta, 302: 201-210
LIA 96
Liang, P.; Sanchez, R.; Martin, M. (1996) Electrochemiluminescence based detection of beta lactam antibiotics and beta lactamases, Journal of Analytical Chemistry, 68: 2426-2431
LID 83
Lide, D. R. (1983) Handbook of Chemistry and Physics, 63rd edition, CRC Press Inc.
LIL 55
Lilly, J. C.; Hughes, J. R.; Alvord, E. C.; Garkin, T. W. (1955) Brief noninjurious electric waveforms for stimulation of the brain, Science, 121: 468-469
LOD 95
Lodish, H.; Baltimore, D.; Berk, A.; Zipursky, S. L.; Matsudaira, P.; Darnell, J. (1995) Molekular Cell biology, 3rd ed., Scientific American Books
LOE 77
Loeb, G. E.; Marks, W. B.; Beatty, P. G.
Analysis and Microelectronic Design of Tubular Electrode Arrays Intended for Chronic, Multiple Single-Unit Recording from Ruptured Nerve Fiber, Medical &
(1977)
Biological Engineering & Computing, 15: 195-201 LOO 79
Loots, G. P.; Loots, J. M.; Browne, J. M. M.; Schoeman, J. L. (1979) A rapid silver impregnation method for nervous tissue: A modified protargolperoxide technique, Stain Technology, 54: 97-101
LITERATURE
160
LOW 92 Loew, L. M.; Cohen, L. B.; Dix, J.; Fluhler, E. N.; Montana, V. Salama, G.; Wu, J. Y. (1992) A naphthyl analog of the aminostyryl pyridinium class of potentiometric membrane dyes shows consistent sensitivity in a variety of tissue, cell, and model membrane preparations, The Journal of Membrane
Biology (Springer), 130: 1-10 LRN 96
Laurent, G. (1996) Odor images and tunes, Neuron, 16: 473-476
LUC 96
Lucklum, R.; Rösler, S.; Hartmann, J.; Hauptmann, P. (1996) On-line detection of organic pollutants in water by thickness shear mode resonators, Sensors and Actuators B, 35-36: 103-111
LUR 92
Lurija, A. R.
(1992) Das Gehirn in Aktion: Einführung in die Neuropsychologie, Rowohlt Taschenbuch Verlag, Reinbek
MAE 95 Maeda, E.; Robinson, H. P.; Kawana, A. (1995) The mechanisms of generation and propagation of synchronized bursting in developing networks of cortical neurons, The Journal of Neuroscience, 15: 6834-
6845 MAH 98 Maher, M. P.; Pine, J.; Wright, J.; Tai, Y.-C. (1998) The neurochip: A new tool for studying neuronal circuits, Journal of Neuroscience Methods, 3: 1-22 MAL 98 Michal, G. (ed.) (1998) Biochemical Pathways, Spektrum Akademischer Verlag MAR 87 Martin, G. R.; Timpl, R. (1987) Laminin and other basement membrane components, Annual Review of Cell Biology, 3: 57-85 MAR 88 Martin, G. R.; Timpl, R.; Kühn, K. (1988) Basement membrane proteins: Molecular structure and function, Advances in Protein Chemistry, 39: 150 MAS 92 Massia, S. P.; Hubbell, J. A. (1992) Vascular Endothelial Cell Adhesion and Spreading Promoted by the Peptide REDV of the IIICS Region of Plasma Fibronectin Is Mediated by Integrin a4ß1, The Journal of Biological
Chemistry, 267: 14019-14026 MAS 93 Massia, S.; Rao,
S. S.; Hubbel, J. A. (1993) Covalently immobilized
laminin peptide Tyr-Ile-Gly-Ser-Arg (YIGSR) supports cell spreading and co-localization of the 67-kilodalton laminin receptor with alpha-actinin and vinculin, The Journal of Biological Chemistry, 268: 8053-8059
MCA 92 McAdams, E. T., McLaughlin, J. A.; Holder, D. S.
Sattelite symposium on neuroscience and technology / 14th Annual International Conference of IEEE Engineering in Medicine and Biology Society, Lyon,
(1992)
IEEE/EMBS Conferences on Biomedical Engineering: 245-253
REFERENCES
161
MCA 95 McAdams, E. T.; Lackermeier, A.; McLaughlin, J. A.; Macken, D.; Jossinet, J. (1995) The linear and non-linear electrical properties of the electrodeelectrolyte interface, Biosensors & Biolelectronics, 10: 67-74 MCD 87 Macdonald, J. R. (1987) Impedance Spectroscopy Emphasizing Solid Materials and Systems, John Wiley & Sons, New York MCI 80
McIntyre, J. D. E.; Peck Jr., W. F.; Nakahara, S. (1980) Oxidation State Changes and Structure of Electrochromic Iridium Oxide Films, Journal of the Electrochemical Society, 127: 1264-1268
MCK 99 Mack, J. (1999) Orgnische Festphasensynthese von oligomeren T-ZellEpitopen und von Komponenten zur Oberflächenmodifizierung unter Verwendung heterobifunktioneller Tetraethylenglykole, Medienverlag
Köhler MCS 99 Boven & Möller / Multichannel* Systems (1999) Multichannel Systems Home Page @ http://www.multichannelsystems.com/, Internet MEY 95 Meyer, J.-U.; Blau, C.; Stieglitz, T. (1995) Multikontaktierung von Nerven mit Mikrostrukturen, Spektrum der Wissenschaft, 6: 98-102 MIC 77
Michell, D., Rand, D. A. J. & Woods, R. (1977) Analysis of the anodic oxygen layer on iridium by X-ray emission, electron diffraction and electron microscopy, Journal of Electroanalytical Chemistry, 85: 117-
126 MIL 85
Miller, R.; Miller, M. R. (1985) Mathematics for electricians and electronics technicians, Audel / G. K. Hall & Co.
MIN 96
Minuth, W. W.; Kloth, S.; Aigner, J.; Sittinger, A.; Röckl, W. (1996) Approach to an organo-typical environment for cultured cells and tissues, Biotechniques, 20: 498-501
MLR 96 Miller, J. P. (1996) Brain waves deciphered, Nature, 384: 115-117 MNT 89 Montana, V.; Farkas, D. L.; Loew, L. M. ratiometric
fluorescence
measurements
Dual-wavelength membrane potential,
(1989) of
Biochemistry, 28: 4536-4539 MOH 95 Mohr, A. (1995) Entwicklung und Charakterisierung von DünnschichtMikroelektroden-Arrays zur Signalableitung elektrisch Zellsysteme, Doctoral Dissertation, University of Tuebingen
MOH 97 Mohr, A.; Finger, W.; Föhr, K. J.; Nisch, W.; Göpel, W.
aktiver
(1997)
Performance of a thin film microelectrode array for monitoring electrogenic cells in vitro, Biosensors & Biolelectronics, 12: 827-835
MON 94 Montague, G.; Morris, J. (1994) Neural-network contributions in biotechnology, Trends in Biotechnology, 12: 312-324
LITERATURE
162
MOS 95 Mosekilde, E.; Mouritsen, O. G.
Modelling the dynamics of biological systems / Nonlinear phenomena and pattern formation,
(1995)
Springer-Verlag, Berlin MOT 84 Motoo, S.; Furuya, N. (1984) Hydrogen and Oxygen Adsorption on Ir(111), (100) and (110) Planes, Journal of Electroanalytical Chemistry, 167: 309-315 MQD 94 Marquardt, H.; Schäfer, S. G. (Hrsg.) (1994) Lehrbuch der Toxikologie, BI Wissenschaftsverlag - Mannheim MRC 92 March, J. (1992) Advanced organic chemistry, fourth edition, John Wiley & Sons, New York MRN 96 Martin, K. C.; Kandel, E. R. (1996) Cell adhesion molecules, CREB, and the formation of new synaptic connections, Neuron, 17: 567-570 MRT 93 Martinoia, S.; Bove, M.; Carlini, G.; Ciccarelli, C.; Grattarola, M.; Storment, C.; Kovacs, G. (1993) A general-purpose system for long-term recording from a microelectrode array coupled to excitable cells, Journal of Neuroscience Methods, 48: 115-121 MTI 94
Martini, R. (1994) Expression and functional roles of neural cell surface molecules and extracellular matrix components during development and regeneration of peripheral nerves, Journal of Neurocytology, 23: 1-28
MTN 94 Martin, B. M. (1994) Tissue Culture Techniques - An Introduction, Birkhäuser MUE 86 Müller, W.; Windisch, H.; Tritthart, H. A. (1986) Fluorescent styryl dyes applied as fast optical probes of cardiac action potential, European Biophysics Journal, 14: 103-111 MYL 95 Meyle, J.; Gueltig, K.; Nisch, W. (1995) Variation in contact guidance by human cells on a microstructured surface, Journal of Biomedical Materials Research, 29: 81-88 NAP 88
Naples, G. G.; Mortimer, J. T.; Scheiner, A.; Sweeney, J. D. (1988) A spiral nerve cuff electrode for peripheral nerve stimulation, IEEE Transactions on Biomedical Engineering, 35: 905-16
NEH 96
Neher, E.; Sakmann, B. (1992) Die Erforschung von Zellsignalen mit der Patch-Clamp-Technik, Spektrum der Wissenschaft, 5: 48-56
NEI 78
Neises, B.; Steglich, W. (1978) Einfaches Verfahren zur Veresterung von Carbonsäuren, Angewandte Chemie, 7: 556-557
REFERENCES
163
NIC 95
Nicholls, J. G.; Martin, A. R.; Wallace, B. G.; Niehaus-Osterloh, M. (Übers.) (1995) Vom Neuron zum Gehirn: Zum Verständnis der zellulären und molekularen Funktion des Nervensystems, Gustav Fischer Verlag, Stuttgart
NIE 96
Nieto, M. A. (1996) Molecular biology of axon guidance, Neuron, 17: 1039-1048
NIS 94
Nisch, W.; Boeck, J.; Egert, U.; Haemmerle, H.; Mohr, A. (1994) A thin film microelectrode array for monitoring extracellular neuronal activity in vitro, Biosensors & Biolelectronics, 9: 737-741
NLA 96
Nicolau, D. V.; Taguchi, T.; Tanigawa, H. Yoshikawa, S. (1996) Control of the neuronal cell attachment by functionality manipulation of diazonaphtho-quinone/novolak photoresist surface, Biosensors &
Biolelectronics, 11: 1237-1252 NOV 88 Novak, J. L.; Wheeler, B. C. (1988) Multisite hippocampal slice recording and stimulation using a 32 element microelectrode array, Journal of Neuroscience Methods, 23: 149-159 ORG 88 Becker, H. G. O.; Schwetlick, K. et al. (Autorenkollektiv) (1988) Organikum / 17. Auflage, VEB Deutscher Verlag der Wissenschaften PAN 97
Pancrazio, J. J.; Bey, P. P.; Loloee, A.; Manne, S. R.; Chao, H.-C.; Howard, L. L.; Gosney, W. M.; Borkholder, D. A.; Kovacs, G. T. A.; Manos, P.; Cuttino, D. S.; Stenger, D. A. (1997) Description and demonstration of a CMOS amplifier-based-system with measurement and stimulation capability for bioelectrical signal transduction, Biosensors & Biolelectronics, 13: 971-
979 PAR 96
Parak, W. J. (1996) Aufbau und Charakterisierung eines LAPS-Systems zur noninvasiven Membranpotentialmessung, Diploma Thesis, Technical University of Munich
PAR 97
Parak, W. J.; Hofmann, U. G.; Gaub, H. E.; Owicki, J. C. (1997) Lateral resolution of light-addressable potentiometric sensors: an experimental and theoretical investigation, Sensors and Actuators A, 63: 47-57
PIG 93
Pigott, R. (1993) The adhesion molecule facts book, Academic Press, New York
PIN 80
Pine, J. (1980) Recording action potentials from cultured neurons with extracellular microcircuit electrodes, Journal of Neuroscience Methods, 2: 19-31
PIN 87
Pine, J.; Gilbert, J.; Regehr, W. (1987) Artifical Organs: Microdevices for stimulating and recording from cultured neurons, VCH Publishers, Inc.
LITERATURE
164
PLA 87
Plattig, K.-H. (1987) Der Geruchssinn des Menschen / Chemische, physikalische, physiologische und psychologische Vorgänge beim Riechen, Physik in unserer Zeit, 5: 146-158
POT 95
Potter, S. M.; Pine, J.; Fraser, S. E. (1995) Neural transplant staining with DiI and vital imaging by 2-photon laser-scanning microscopy, Pfefferkorn Conference XIV, 8: 1-16
POT 96
Potter, S. M.; Mart, A.; Pine, J. (1996) High-speed CCD camera, with random pixel selection, SPIE High-speed imaging conference, 11: 1-14
PRS 89
Parsons, T. D.; Kleinfeld, D.; Raccuia-Behling, F.; Salzberg, B. M. (1989) Optical recording of the electrical activity of synaptically interacting Aplysia neurons in culture using potentiometric probes, Biophysical
Journal, 56: 213-221 PSC 99
Panasonic Medical Systems (1999) Multi-channel Extracellular Recording System @ http://www.panasonic.co.jp/med/medsystem-e.html, Internet
RAN 94 Ranieri, J. P.; Bellamkonda, R.; Bekos, E. J.; Gardella-JA Jr; Mathieu, H. J.; Ruiz, L.; Aebischer, P. (1994) Spatial control of neuronal cell attachment and differentiation on covalently patterned laminin oligopeptide substrates, International Journal of Developmental Neuroscience, 12:
725-35 RAN 95 Ranieri, J. P.; Bellamkonda, R.; Bekos, E. J.; Vargo, T. G.; Gardella, J.A. Jr.; Aebischer, P. (1995) Neuronal cell attachment to fluorinated ethylene propylene films with covalently immobilized laminin oligopeptides YIGSR and IKVAV. II, Journal of Biomedical Materials Research, 29: 779-85
RAW 89 Rawn, D. (1999) Biochemistry, Neil Patterson Publishers, Burlington RED 63
Reid, F. H. (1963) Electrodeposition of the Platinum-Group Metals, Metallurgic Reviews, 8: 167-211
REG 88
Regehr, W. G.; Pine, J.; Rutledge, D. B. (1988) A long-term in vitro siliconbased microelectrode neuron connection, IEEE Transactions on Biomedical Engineering, 35: 1023-1033
REI 92
Reichert, H. (1992) Introduction to Neurobiology, Georg Thieme Verlag, Stuttgart - New York
REY 86
Reynolds, J. R. (1986) Advances in the chemistry of conducting organic polymers: A review, Journal of Molecular Electronics, 2: 1-21
RHO 94 Rhoades B. K.; Gross, G. W. (1994) Potassium and calcium channel dependence of bursting in cultured neuronal networks, Brain Research, 643: 310-318
REFERENCES RIC 97
Rickert, J.
165
(1997)
Massensensitive Biosensoren zur spezifischen
Detektion von Affinitätsreaktionen, Doctoral Dissertation, University of
Tuebingen RLE 83
Robblee, L. S.; Lefko, J. L.; Brummer, S. B. (1983) Activated Ir: An Electrode for Reversible Charge Injection in Saline Solution, Journal of the Electrochemical Society, 130: 731-733
ROB 68
Robinson,
D.
A. (1968) The Electrical Properties of Metal Microelectrodes, Proceedings of the Institute of Electrical and Electronics Engineers: IEEE, 56: 1065-1071
ROH 94 Rohr, S.; Salzberg, B. M. (1994) Multiple site optical recording of transmembrane voltage (MSORTV) in patterned growth heart cell cultures: Assessing electrical behavior, with microsecond resolution, on a cellular and subcellular scale, Biophysical Journal, 67: 1301-1315
RSN 93
Robinson, H. P. C.; Kawahara, M.; Jimbo, Y.; Torimitsu, K.; Kuroda, Y.; Kawana, A. (1993) Periodic synchronized bursting and intracellular calcium transients elicited by low magnesium in clutured cortical neurons, Journal of Neurophysiology, 70: 1606-1616
RTN 95
Rutten, W. L. C.; Frieswijk, T. A.; Smit, J. P. A.; Rozijn, T. H.; Meier, J. H. (1995) 3D Neuro-electronic interface devices for neuromuscular control: Design studies and realisation steps, Biosensors & Biolelectronics, 10: 141-153
RÜH 97 Rühe, J. (1997) Polymers Grafted from Solid Surfaces, Macromolecular Physical Chemistry, 126: 215-218 RUT 88
Rutishauser, U.; Jessell, T. M. (1988) Cell adhesion molecules in vertebrate neural development, Physiological Reviews, 68: 819-57
RUT 93
Rutishauser, U. (1993) Adhesion molecules of the nervous system, Current Opinion in Neurobiology, 3: 709-15
RUZ 94
Ruzicka, J. (1994) Discovering flow injection: Journey from sample to a live cell and from solution to suspension, Analyst, 119: 1925-1934
SCH 99
Scholl, M.; Sprössler, C.; Offenhäusser, A.; Knoll, W.; Maelicke, A. (1999) Tayloring neuronal networks to FET array patterns, Workshop Bioelectronische Signalwandlung in Membran-FET-Verbundstrukturen, 22. April 1999, MPI für Polymerforschung, Mainz
SCT 96
Schechter, B. (1996) How the brain gets rhythm, Science, 274: 339340
LITERATURE
166
SEN 96
Senseman, D. M. (1996) High-speed optical imaging of afferent flow through rat olfactory bulb slices: Voltage-sensitive dye signals reveal periglomerular cell activity, The Journal of Neuroscience, 16: 313-324
SEP 89
Sephel, G. C.; Tahiro, K. I.; Sasaki, M.; Greatorex, D.; Martin, G. R.; Yamada, Y.; Kleinman, H. K. (1989) Laminin A chain synthetic peptide which supports neurite outgrowth, Biochemical & Biophysical Research Communications, 162: 821-829
SER 96
Service, R. F. (1996) Making cells selectively sticky [news], Science, 273: 1493-1493
SFF 95
Schaffner, A. E.; Barker, J. L.; Stenger, D. A.; Hickman, J. J. (1995) Investigation of the factors necessary for growth of hippocampal neurons in a defined system, Journal of Neuroscience Methods, 62: 111-119
SHY 78
Shay, J. L.; Beni, G.; Schiavone, L. M. (1978) Electrochromism of anodic iridium oxide films on transparent substrates, Applied Physics Letters, 33: 943-944
SIG 96
Sigma Chemie (1996) Biochemikalien, organische Verbindungen und Diagnostika, Product Catalogue, 1751-1753
SIN 98
Sinn-Hanlon,
J.
(1998)
Chickscope
@
http.//chickscope.
beckman.uiuc.edu/explore/embryology/day02/comparative.html, Internet
SMI 97
Smith, T. W. (1997) Avian Embryo @ http://www.msstate.edu/dept /poultry/avianemb.htm, Internet
SOE 93
Soekarno, A.; Lom, B.; Hockberger, P. E.
Pathfinding by neuroblastoma cells in culture is directed by preferential adhesion to positively charged surfaces, Neuroimage, 1: 129-144
SON 98
Song, H.; Ming, G.; He, Z.; Lehmann, M.; McKerracher, L.; Tessier-Lavigne, M.;Poo, M. (1998) Conversion of Neuronal Growth Cone Responses from Repulsion to Attraction by Cyclic Nucleotides, Science, 281: 1515
SOO 93
Van der Schoot, B. H.; Jeanneret, S.; Van der Berg, A.; De Rooij, N. F. (1993) Microsystems for flow injection analysis, Analytical Methods and Instrumentation, 1: 38-42
SOR 98
Sorribas, H.; Padeste, C.; Gennser, U.; Sonderegger, P.; Tiefenauer, L. (1998)
(1993)
Microstructured biofunctionalised glass for neuron cell guidance and recording, Biosensors (Symposium)
SPR 98
Sprössler, C.; Richter, D.; Denyer, M.; Offenhäusser, A. (1998) Long-Term Recording System Based on Field-Effect Transistor Arrays for Monitoring Electrogenic Cells in Culture, Biosensors & Biolelectronics, 13: 613-618
REFERENCES
167
SRG 96
Sergeyeva, T. A.; Lavrik, N. V.; Piletsky, S. A.; Rachkov, A. E.; Elskaya, A. V. (1996) Polyaniline label-based conductometric sensor for IgG detection, Sensors and Actuators B, 34: 283-288
STE 93
Stenger, D. A.; Pike, C. J.; Hickman, J. J.; Cotman, C. W. (1993) Surface determinants of neuronal survival and growth on self-assembled monolayers in culture, Brain Research, 630: 136-147
STF 98
Sternfeld, M.; Ming, G.-L.; Song, H.-J-; Sela, K.; Timberg, R.; Poo, M.-M.; Soreq, H. (1998) Acetylcholinesterase enhances neurite growth and synapse development through alternative contributions of its hydrolytic capacity, core protein and variable c termini, The Journal of
Neuroscience, 18: 1240-1249 STH 96
Smith, D. P. (1996) The sweet, sweet smell of diacetyl, Neuron, 16: 469-471
STL 93
Steuhl, K. P.; Pavlidis, C.; Knorr, M.; Thanos, S.; Thiel, H. J. (1993) Immunohistologic, ultrastructural and morphometric characterization of organ cultures of the human limbus epithelium, Ophtalmologe, 90:
656-661 SVN 79
Schiavone, L. M.; Dautremont-Smith, W. C.; Beni, G.; Shay, J. L. (1979) Electrochromic iridium oxide films prepared by reactive sputtering, Applied Physics Letters, 35(10): 823-825
SWZ 95 Schweizer-Berberich, M.; Harsch, A.; Göpel, W. (1995) Wie menschlich sind elektronische Nasen?, Technisches Messen, 62: 237-249 TAK 92
Takeda, Y.; Ross, P. D.; Mudd, C. P. (1992) Thermodynamics of cro protein-DNA interactions, Proceedings of the National Academy of Sciences of the United States of America, 17: 8180-8184
TAN 92
Tanghe, S. J.; Wise, K. D. (1992)
Iridium Oxide High-Performance
Stimulating Sites for Multielectrode Probe Arrays, Training class at the
University of Michigan TGY 93
Tanguy, J.; Viel, P.; Deniau, G.; Lecayon, G. (1993) Study of the grafting and of the electrochemical polymerization of acrylic monomers on a metallic surface by impedance spectroscopy, Electrochimica Acta, 38:
1501-1512 THI 97
Thiébaud, P.; De Rooij, N. F.; Koudelka-Hep, M., Stoppini, L. (1997) Microelectrode arrays for electrophysiological monitoring of hippocampal organotypic slice cultures, IEEE Transactions on Biomedical Engineering,
44: 1159-1163 TIE 93
Tietze,U.; Schenk, Ch. (1993) Halbleiter-Schaltungstechnik, 10. Auflage, Springer-Verlag, Berlin
LITERATURE
168
TOL 86
Tolvanen, M.; Gahmberg, C. G. (1986) In vitro attachment of mono- and oligosaccharides to surface glycoconjugates of intact cells, The Journal of Biological Chemistry, 261: 9546-9551
TSA 96
Tsacopulos, M.; Magistretti, P. J. (1996) Metabolic coupling between glia and neurons, The Journal of Neuroscience, 16: 877-885
TWA 94 Twardoch, U. M. (1994) Integrity of ultramicro-stimulation electrodes determined from electrochemical measurements, Journal of Applied Electrochemistry (London), 24: 835-857 ULM 99 Ulmer, H. (1999) Hybride modulare Sensorsysteme für die Gasanalytik und Olfaktometrie, Doctoral Dissertation, University of Tuebingen VAL 92
Valentini, R. F.; Vargo, T. G.; Gardella J. A. Jr.; Aebischer, P. (1992) Electrically charged polymeric substrates enhance nerve fibre outgrowth in vitro, Biomaterials, 13: 183-90
VAL 93
Valentini, R. F.; Vargo, T. G.; Gardella J. A. Jr.; Aebischer, P. (1993) Patterned neuronal attachment and outgrowth on surface modified, electrically charged fluoropolymer substrates, Journal of Biomaterial
Science & Polymer Education, 5: 13-36 VAR 95 Valderrama, E.; Garrido, P.; Cabruj, E.; Heiduschka, P.; Harsch, A.; Göpel, W. (1995) Microfabrication and Characterisation of Microelectrode Arrays for in vivo Nerve Signal Recording, Conference Proceedings Eurosensors IX, June 25-29, Stockholm, Sweden, 1: 63-66 VDM 94 Van der Meer,B. W.; Coker, G. III; Simon chen, S.-Y. (1994) Resonance Energy Transfer / Theory and Data, VCH Publishers, Inc. VRA 94 Vranesic, I.; Iijima T.; Ichikawa, M.; Matsumoto, G.; Knöpfel,T. (1994) Signal transmission in the parallel fiber-Purkinje cell system visualized by high-resolution imaging, Proceedings of the National Academy of Sciences
of the United States of America, 91: 13014-13017 VUK 92 Vukovic, M.; Cukman, D. (1992) Comparative Study of Anodic Behaviour of Electrodeposited Ruthenium, Iridium and Rhodium Coatings on Titanium in Acid Solution, Croatica Chemica Acta, 65: 871-880
WAN 98 Wang, X.-H.; Berninger, B.; Poo, M.-M. (1998) Localized synaptic actions of neurotrophin-4, The Journal of Neuroscience, 18: 4985-4992 WEH 96 Wehr, M.; Laurent, G. (1996) Odour encoding by temporal sequences of firing in oscillating neural assemblies, Nature, 384: 162-165 WEI 99
Weinl,
C.
(1999)
Axonwachstums
auf
University of Tuebingen
Optimierung biokompatiblen
der
Zelladhäsion
Polymeren,
und
Diploma
des
Thesis,
REFERENCES WIL 94
169
Wilson, R. J. A.; Breckenridge, L.; Blackshaw, S. E.; Connolly, P.; Dow, J. A. T.; Curtis, A. S. G.; Wilkinson, C. D. W. (1994) Simultaneous multisite recordings and stimulation or single isolated leech neurons using planar extracellular electrode arrays, Journal of Neuroscience Methods, 53:
101-110 WLK 93 Wilkinson, C. D. W. (1993) Research on Information Processing by Neural Networks Cultured on Substrates, Japanese Journal of Applied Physics (1), 32: 6210-6212 WLT 95 Walter, J. S.; McLane, J.; Cai, W.; Khan, T.; Cogan, S. (1995) Evaluation of a thin-film peripheral nerve cuff electrode, Journal of Spinal Cord Medicine, 18: 28-32 YAC 95 Yacoub-George, E.; Wolf, H. (1995) A miniaturized ISFET-ELISA system with a pretreated fused silica capillary as reaction cartridge, Conference Proceedings Eurosensors IX, June 25-29, Stockholm, Sweden, 468: 898-900 YAM 89 Yamanaka, K. (1989) Anodically Electrodeposited Iridium Oxide Films (AEIROF) from Alkaline Solutions for Electrochromic Display Devices, Japanese Journal of Applied Physics, 28: 632-637 ZAN 92
Zhang, H.; Miller, R. H.; Rutishauser, U. (1992) Polysialic acid is required for optimal growth of axons on a neuronal substrate, The Journal of Neuroscience, 12: 3107-14
ZIE 98A Ziegler, Ch.; Harsch, A.; Göpel, W. (1998) Natural Neural Networks for Quantitative Sensing of Neurochemicals: an Artificial Neural Network Analysis, Conference Proceedings of the 7th IMCS, Beijing, China: 801-803
ZIE 98B Ziegler, Ch.; Göpel, W.; (coordinating authors); Hämmerle, H.; Jung, G.; Laxhuber, L.; Schmidt, H.-L.; Schütz, S.; Vögtle, F.; Zell, A.; (contributing authors) (1998) Bioelectronic Noses: A Status Report, Part II, Biosensors & Biolelectronics, 13: 539-571
170
ACACEMIC TEACHERS
My academic teachers have been: @ University of Tübingen E. Bayer, D. Christen, H. Eckstein, G. Gauglitz, W. Göpel, G. Häfelinger, H. P. Hagenmaier, M. Hanack, V. Hoffmann, G. Jung, S. Kemmler-Sack, W. Koch, D. Krug, E. Lindner, I.-P. Lorenz, U. Nagel, P. W. Nakel, H. Oberhammer, D. Oelkrug, H. Pauschmann, G. Pausewang, H. Pommer, B. Rieger, A. Rieker, V. Schurig, F. F. Seelig, H.-U. Siehl, H. Stegmann, J. Strähle, H. Suhr, W. Voelter, K.-P. Zeller, C. Ziegler @ University of Miami A. Fernandez, C. D. Hoff, E. Y. Lee, W. L. Purcell @ University of North Texas G. W. Gross