The Benefits of Labor Mobility in a Currency Union by Christopher L. House, Christian Proebsting and Linda L. Tesar
Discussion at the Sixth Annual ABFER Conference Martin Berka Massey University
May 22, 2018
Important, timely and interesting questions
Does labour market adjustment substitute for exchange rate adjustment? How does net migration compare between the US states, Canadian provinces and European countries? Are unemployment rate differences (temporal and spatial) associated with stronger net migration in North America than in Europe? Causality?
Important, timely and interesting questions
Higher gross & net migration rates in US and Canada than in the EU Net migration out of high-unemployment areas in North America higher than in EU (big difference!) Involved DSGE search-and-matching multi-sector, multi-country model with migration and unemployment A lot in the model! Hand-to-mouth & optimizing households choose: location, n, C , K Convex moving cost Φ Firms produce final nontraded good using traded intermediate inputs. Intermediate goods constructed in 2-stage process: Cobb-Douglas & CES aggregation of varieties Detailed labour market
Model Very large and involved search-and-matching multi-country model Intricate labour market modeling But migration cost is calibrated zero Look forward to seeing where the authors take the model: currently seems almost separate from the empirics Useful to think about migration in this framework. Some recent work: Thoenissen and Smith (2017 WP): DSGE small open economy business-cycle model with human capital transmitted by migration Bodenstein et al. (2016 WP): search-and-matching labour market in an otherwise standard small-open-economy DSGE framework to study Sectoral (T vs NT) dimension of immigration seems relevant for crowding-out employment effects in the US (Burstein et al. 2017 WP)
I would like to see some discussion of real exchange rate in the model
Why Double Demean?
Deviations from state-specific mean u correlated with deviations from state-specific mean migr Cross-state differences matter, too: institutional labor market differences between EU states language and cultural differences between EU states
Such low-frequency variables removed from the data by double-demeaning? Traditional ”European rigidity” stories revolve around these considerations With decades of data, lower frequency should be informative
Exchange rates and labor mobility as substitutes
Big and important question: is the Eurozone an optimal currency area? How could labor mobility substitute nominal exchange rate fluctuations? Low vs. High frequency of adjustment?
Better question: is labour mobility optimal given nominal price rigidities in the EZ? Frequency of adjustment more aligned Real exchange rate levels seem aligned with the fundamentals in the Eurozone, controlling for labor wedges.
Rose (2010) effect: can you discuss pro-trade effects into model?
States vs. States
Comparing intra- with inter-national Size heterogeneity and linguistic/legal heterogeneity Without speaking the language, migration (sometimes within a country) need not help If labour-market regulations prevent taking employment in another country, migration need not help Potentially large unobserved internal (intra-national) migration Can you treat the size heterogeity in your current regression?
Use sub-national data?
NUTS Eurostat has an excellent (recent) regional database: Nomenclature of Territorial Units and Statistics (NUTS) Level 1, 2, and 3: http://ec.europa.eu/eurostat/web/nuts/background E.g.: Level 2 Max: Northrein-Westfalen, population 18m (Ontario = 13m, NY=20m) Min: ˚ Aland (FI): 30k (YU = 36k, WY = 580k but US Samoa = 55k)
Number of sub-national units: 287 vs 50ish vs 13
Reasonably similar distribution of populations, as US/Canada but with larger total and longer history. Allows to disentangle within- vs. between- country results in the EU Downside: Data starts in 2005 (12 years, but large cross-section).
NUTS
Migration
Unemployment
Unemployment Eurozone regional unemployment rates (169 regions) 40 35 30 25 20 15 10 5 0 05
06
07
08
09
10
11
12
13
14
15
16
Unemployment Mean Regional Unemployment Rate (EU NUTS2 regions, double-demeaned) 6 4 2 0 -2 -4 -6 -8 05
06
07
08
09
10 Mean
11
12
+/- 1 S.D.
13
14
15
16
Net migration data for NUTS2 regions, EU Mean absolute net migration is 0.47% I construct double-demeaned variables like in the paper STD of net migration: 0.46% (in paper: US & Can: 0.48% EU: 0.32) STD of unemployment: 3.1% (paper: US 1%, Can: 1.03% EU: 2.5%)
EU migration (regions)
EU unemployment across regions 5.00
6.00
4.00
5.00
3.00
4.00
2.00
3.00
1.00
2.00
0.00 ‐1.00
1.00 2005
2006
2007
2008
2009
2010
2011
2012
2013
2014
2015
2016
0.00
‐2.00
‐1.00
‐3.00
‐2.00
‐4.00
‐3.00 mean(u)
median(u)
std(u)
2005
2006
2007
2008
2009
mean(mig)
2010
2011
med(mig)
2012
2013
std(mig)
2014
2015
2016
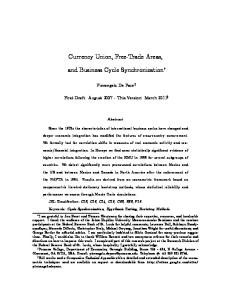
Unemployment and Migration Net Migration Rate vs. Unemployment Rate 287 EU NUTS2 Regions, double-deflated variables 50 40 30
mig
20 10 0 -10 -20 -30
-20
-15
-10
-5
0 u
5
10
15
Unemployment and Migration: not just cross-section
AT11 - Burgenland (AT), MIG AT21 - Kärnten, MIG AT32 - Salzburg, MIG BE10 - Région de Bruxelles-Capitale / Brussels Hoofdstedelijk Gewest, MIG BE23 - Prov. Oost-Vlaanderen, MIG BE31 - Prov. Brabant Wallon, MIG BE34 - Prov. Luxembourg (BE), MIG BG32 - Severen tsentralen, MIG BG41 - Yugozapaden, MIG CH02 - Espace Mittelland, MIG CH05 - Ostschweiz, MIG CY00 - Kypros, MIG CZ03 - Jihozápad, MIG CZ06 - Jihovýchod, MIG DE11 - Stuttgart, MIG DE14 - Tübingen, MIG DE23 - Oberpfalz, MIG DE26 - Unterfranken, MIG DE40 - Brandenburg, MIG DE71 - Darmstadt, MIG DE80 - Mecklenburg-Vorpommern, MIG DE93 - Lüneburg, MIG DEA2 - Köln, MIG DEA5 - Arnsberg, MIG DEB3 - Rheinhessen-Pfalz, MIG DED4 - Chemnitz, MIG DEF0 - Schleswig-Holstein, MIG DK02 - Sjælland, MIG DK05 - Nordjylland, MIG EL41 - Voreio Aigaio, MIG EL51 - Anatoliki Makedonia, Thraki, MIG EL54 - Ipeiros, MIG EL63 - Dytiki Ellada, MIG ES11 - Galicia, MIG ES21 - País Vasco, MIG ES24 - Aragón, MIG ES42 - Castilla-la Mancha, MIG ES52 - Comunidad Valenciana, MIG ES62 - Región de Murcia, MIG ES70 - Canarias (ES), MIG FI1C - Etelä-Suomi, MIG FR21 - Champagne-Ardenne (NUTS 2013), MIG FR24 - Centre (FR) (NUTS 2013), MIG
AT12 - Niederösterreich, MIG AT22 - Steiermark, MIG AT33 - Tirol, MIG BE21 - Prov. Antwerpen, MIG BE24 - Prov. Vlaams-Brabant, MIG BE32 - Prov. Hainaut, MIG BE35 - Prov. Namur, MIG BG33 - Severoiztochen, MIG BG42 - Yuzhen tsentralen, MIG CH03 - Nordwestschweiz, MIG CH06 - Zentralschweiz, MIG CZ01 - Praha, MIG CZ04 - Severozápad, MIG CZ07 - Strední Morava, MIG DE12 - Karlsruhe, MIG DE21 - Oberbayern, MIG DE24 - Oberfranken, MIG DE27 - Schwaben, MIG DE50 - Bremen, MIG DE72 - Gießen, MIG DE91 - Braunschweig, MIG DE94 - Weser-Ems, MIG DEA3 - Münster, MIG DEB1 - Koblenz, MIG DEC0 - Saarland, MIG DED5 - Leipzig, MIG DEG0 - Thüringen, MIG DK03 - Syddanmark, MIG EE00 - Eesti, MIG EL42 - Notio Aigaio, MIG EL52 - Kentriki Makedonia, MIG EL61 - Thessalia, MIG EL64 - Sterea Ellada, MIG ES12 - Principado de Asturias, MIG ES22 - Comunidad Foral de Navarra, MIG ES30 - Comunidad de Madrid, MIG ES43 - Extremadura, MIG ES53 - Illes Balears, MIG ES63 - Ciudad Autónoma de Ceuta (ES), MIG FI19 - Länsi-Suomi, MIG FI1D - Pohjois- ja Itä-Suomi, MIG FR22 - Picardie (NUTS 2013), MIG FR25 - Basse-Normandie (NUTS 2013), MIG
AT13 - Wien, MIG AT31 - Oberösterreich, MIG AT34 - Vorarlberg, MIG BE22 - Prov. Limburg (BE), MIG BE25 - Prov. West-Vlaanderen, MIG BE33 - Prov. Liège, MIG BG31 - Severozapaden, MIG BG34 - Yugoiztochen, MIG CH01 - Région lémanique, MIG CH04 - Zürich, MIG CH07 - Ticino, MIG CZ02 - Strední Cechy, MIG CZ05 - Severovýchod, MIG CZ08 - Moravskoslezsko, MIG DE13 - Freiburg, MIG DE22 - Niederbayern, MIG DE25 - Mittelfranken, MIG DE30 - Berlin, MIG DE60 - Hamburg, MIG DE73 - Kassel, MIG DE92 - Hannover, MIG DEA1 - Düsseldorf, MIG DEA4 - Detmold, MIG DEB2 - Trier, MIG DED2 - Dresden, MIG DEE0 - Sachsen-Anhalt, MIG DK01 - Hovedstaden, MIG DK04 - Midtjylland, MIG EL30 - Attiki, MIG EL43 - Kriti, MIG EL53 - Dytiki Makedonia, MIG EL62 - Ionia Nisia, MIG EL65 - Peloponnisos, MIG ES13 - Cantabria, MIG ES23 - La Rioja, MIG ES41 - Castilla y León, MIG ES51 - Cataluña, MIG ES61 - Andalucía, MIG ES64 - Ciudad Autónoma de Melilla (ES), MIG FI1B - Helsinki-Uusimaa, MIG FR10 - Île de France, MIG FR23 - Haute-Normandie (NUTS 2013), MIG
Net migration rates vs Unemployment rates (both double-demeaned, 287 EU NUTS2 regions) 50 40 30 20 10 0 -10 -20 -30 -20
-15
-10
-5
0 U
5
10
15
Unemployment and Migration: not just cross-section
AT11 - Burgenland (AT), MIG AT21 - Kärnten, MIG AT32 - Salzburg, MIG BE10 - Région de Bruxelles-Capitale / Brussels Hoofdstedelijk Gewest, MIG BE23 - Prov. Oost-Vlaanderen, MIG BE31 - Prov. Brabant Wallon, MIG BE34 - Prov. Luxembourg (BE), MIG BG32 - Severen tsentralen, MIG BG41 - Yugozapaden, MIG CH02 - Espace Mittelland, MIG CH05 - Ostschweiz, MIG CY00 - Kypros, MIG CZ03 - Jihozápad, MIG CZ06 - Jihovýchod, MIG DE11 - Stuttgart, MIG DE14 - Tübingen, MIG DE23 - Oberpfalz, MIG DE26 - Unterfranken, MIG DE40 - Brandenburg, MIG DE71 - Darmstadt, MIG DE80 - Mecklenburg-Vorpommern, MIG DE93 - Lüneburg, MIG DEA2 - Köln, MIG DEA5 - Arnsberg, MIG DEB3 - Rheinhessen-Pfalz, MIG DED4 - Chemnitz, MIG DEF0 - Schleswig-Holstein, MIG DK02 - Sjælland, MIG DK05 - Nordjylland, MIG EL41 - Voreio Aigaio, MIG EL51 - Anatoliki Makedonia, Thraki, MIG EL54 - Ipeiros, MIG EL63 - Dytiki Ellada, MIG ES11 - Galicia, MIG ES21 - País Vasco, MIG ES24 - Aragón, MIG ES42 - Castilla-la Mancha, MIG ES52 - Comunidad Valenciana, MIG ES62 - Región de Murcia, MIG ES70 - Canarias (ES), MIG FI1C - Etelä-Suomi, MIG FR21 - Champagne-Ardenne (NUTS 2013), MIG FR24 - Centre (FR) (NUTS 2013), MIG
AT12 - Niederösterreich, MIG AT22 - Steiermark, MIG AT33 - Tirol, MIG BE21 - Prov. Antwerpen, MIG BE24 - Prov. Vlaams-Brabant, MIG BE32 - Prov. Hainaut, MIG BE35 - Prov. Namur, MIG BG33 - Severoiztochen, MIG BG42 - Yuzhen tsentralen, MIG CH03 - Nordwestschweiz, MIG CH06 - Zentralschweiz, MIG CZ01 - Praha, MIG CZ04 - Severozápad, MIG CZ07 - Strední Morava, MIG DE12 - Karlsruhe, MIG DE21 - Oberbayern, MIG DE24 - Oberfranken, MIG DE27 - Schwaben, MIG DE50 - Bremen, MIG DE72 - Gießen, MIG DE91 - Braunschweig, MIG DE94 - Weser-Ems, MIG DEA3 - Münster, MIG DEB1 - Koblenz, MIG DEC0 - Saarland, MIG DED5 - Leipzig, MIG DEG0 - Thüringen, MIG DK03 - Syddanmark, MIG EE00 - Eesti, MIG EL42 - Notio Aigaio, MIG EL52 - Kentriki Makedonia, MIG EL61 - Thessalia, MIG EL64 - Sterea Ellada, MIG ES12 - Principado de Asturias, MIG ES22 - Comunidad Foral de Navarra, MIG ES30 - Comunidad de Madrid, MIG ES43 - Extremadura, MIG ES53 - Illes Balears, MIG ES63 - Ciudad Autónoma de Ceuta (ES), MIG FI19 - Länsi-Suomi, MIG FI1D - Pohjois- ja Itä-Suomi, MIG FR22 - Picardie (NUTS 2013), MIG FR25 - Basse-Normandie (NUTS 2013), MIG
AT13 - Wien, MIG AT31 - Oberösterreich, MIG AT34 - Vorarlberg, MIG BE22 - Prov. Limburg (BE), MIG BE25 - Prov. West-Vlaanderen, MIG BE33 - Prov. Liège, MIG BG31 - Severozapaden, MIG BG34 - Yugoiztochen, MIG CH01 - Région lémanique, MIG CH04 - Zürich, MIG CH07 - Ticino, MIG CZ02 - Strední Cechy, MIG CZ05 - Severovýchod, MIG CZ08 - Moravskoslezsko, MIG DE13 - Freiburg, MIG DE22 - Niederbayern, MIG DE25 - Mittelfranken, MIG DE30 - Berlin, MIG DE60 - Hamburg, MIG DE73 - Kassel, MIG DE92 - Hannover, MIG DEA1 - Düsseldorf, MIG DEA4 - Detmold, MIG DEB2 - Trier, MIG DED2 - Dresden, MIG DEE0 - Sachsen-Anhalt, MIG DK01 - Hovedstaden, MIG DK04 - Midtjylland, MIG EL30 - Attiki, MIG EL43 - Kriti, MIG EL53 - Dytiki Makedonia, MIG EL62 - Ionia Nisia, MIG EL65 - Peloponnisos, MIG ES13 - Cantabria, MIG ES23 - La Rioja, MIG ES41 - Castilla y León, MIG ES51 - Cataluña, MIG ES61 - Andalucía, MIG ES64 - Ciudad Autónoma de Melilla (ES), MIG FI1B - Helsinki-Uusimaa, MIG FR10 - Île de France, MIG FR23 - Haute-Normandie (NUTS 2013), MIG
Net Migration Rate vs. Unemployment rate 287 EU NUTS2 Regions, double-deflated 50 40 30 20 10 0 -10 -20 -30 -20
-15
-10
-5
0 U
5
10
15
Within-Europe double-demeaned results
netmi,t = β0 + β1 uˆi,t + �i,t Method βˆ1 s.e. R¯ 2 # obs
Pool
FE
RE
Robust-M
Robust-S
−0.78∗∗∗ (0.019) 0.35 3,350
−0.78∗∗∗ (0.02) 0.29 3,350
−0.78∗∗∗ (0.019) 0.35 3,350
−0.6∗∗∗ (0.012) 0.42 3,350
−0.51∗∗∗ (0.018) 0.16 3,350
Stubborn highly significant negative correlation Paper: US −0.272∗∗∗ , Can US −0.223∗∗∗ , EU −0.082∗∗∗
Why are my results so different?
1 2
I made mistakes 2005 - 2016 sample has a series of major shocks (GFC, Eurozone debt crisis) With fixed costs to moving, nonlinearity: large shocks may prompt migration
3
4
My double-deflating doesn’t use population weights (ran out of time) but I don’t think this matters greatly By construction? Granularity: how much of these results is driven by level of aggregation? Most say nobody migrates to/from the Earth But this also raises question: what drives the comovement?
5
Results weaker without double-demeaning, but still stronger than in paper
Impulse response
uˆi,t = βi + β1 uˆi,t−1 + β1 uˆi,t−2 + �ui,t Estimated responses to a unitary shock: t = 1 : 1.08 t = 2 : 0.81 t = 3 : 0.48...
Somewhere between the response of US and Canada in the paper
Other things
New bilateral data seem very promising How is S pinned down in the model? How can labor mobility substitute nominal exchange rate fluctuations? Related question: is labour mobility optimal given nominal price rigidities and institutional rigidities in the Eurozone? Real exchange rate levels seem aligned with the fundamentals in the Eurozone, but only after controlling for labor wedges.
I look forward to the updated paper
Thank you!