BAYESIAN HIERARCHICAL MODEL FOR ESTIMATING GENE ASSOCIATION NETWORK FROM MICROARRAY DATA Dongxiao Zhu,a and Alfred O Hero b a
Bioinformatics Program,b Depatments of EECS, Biomedical Engineering and Statistics University of Michigan,Ann Arbor, MI 48105 1. INTRODUCTION
Estimating gene association networks from gene microarray data is the key to decipher complicated web of functional relationship between genes [1]. However, the process remains to be challenging due to the relatively few independent samples and the large amount of correlation parameters [2]. In a gene association network, vertices represent genes, and edges represent biological association between genes. The network edges are declared to be present if the corresponding correlation parameters are significantly different from a non-zero threshold [3]. The approach has been very useful in inferring gene association networks, and facilitating network based discovery [3]. However, as a Frequentist approach, it often suffers from the “overfitting” problem especially for analyzing small sample size data. Approaches that are able to globally estimate the correlation parameters with variance regularization followed by the seamless correlation thresholding are highly desirable. The desirable approaches fall naturally into the framework of Bayesian hierarchical models [4]. We assume the correlation parameters are exchangeable meaning that the joint distribution (Eq. 1) is invariant to permutations of the indexes. Biologically, this represents a lack of knowledge that could differentiate one pair of biological associations from the others. We then regularize variances of the correlation estimations by specifying a parent normal distribution from which marginal correlation parameters are sampled (Fig. 1). The posterior distributions of correlation parameters provide a seamless combination of the correlation estimation and strength thresholding. 2. METHODS We use ρ to denote the true strength of association between a pair of gene expression profiles. For G gene expression ¡ ¢ profiles in a microarray data set, there are Λ = G 2 correlation parameters ρ that need to be estimated, denoted as This work was partially supported by grants from the National Institute of Health (EY01115), The Foundation Fighting Blindness, Sramek Foundation and Research to Prevent Blindness.
ρλ , λ = 1, . . . , Λ. We define ρˆλ as the λth sample correlaˆ λ as the hyperbolic arc-tangent transtion coefficient, and Γ formation of ρˆλ . Then the transformed sample correlation ˆ λ = atanh(ˆ coefficients Γ ρλ ) are asymptotically Gaussian distributed with means of Γλ and stabilized variance approximations of σλ2 = 1/(N − 3). Here N is the sample size. Simulation studies show that the variance approximation works reasonably well even at a relatively small sample size, e.g. N ≤ 10. We assume known variances to reduce computational complexity. Furthermore, we don’t have a prior information about these Γ0 s, and assuming independency between them in marginal correlation approaches cause the “overfitting” problem [2]. In the Bayesian hierarchical model, we assume that these parameters are exchangeable, and are drawn from a normal distribution with unknown hyperparameters (α, β) (Fig. 1): p(Γ1 , . . . , ΓΛ |α, β) =
Λ Y
N (Γλ |α, β 2 )
(1)
λ=1
In order to generate conditional posterior distributions p(Γλ |α, β, y) for each parameter Γλ , λ = 1, . . . , Λ, where y represents the microarray data, we performed simulation steps as follows [4]: 1. Assign prior distribution for β, i.e. uniform prior distribution p(β) ∝ 1. 2. Draw β from posterior distribution p(β|y).
p(β|y) ∝
p(β)
QΛ
b λ |ˆ N (Γ α, σλ2 + β 2 ) N (ˆ α|ˆ α, Vα )
λ=1
∝ p(β)Vα1/2
Λ Y
−1/2
(σλ2 + β 2 )
λ=1
where α ˆ and Vα are defined as: PΛ 1
exp(−
bλ − α (Γ b)2 (3) ), 2 2(σλ + β 2 )
ˆ
2 +β 2 Γλ λ=1 σλ
α ˆ = PΛ
(2)
1 2 +β 2 λ=1 σλ
,
(4)
and Vα−1 =
Λ X
σ2 λ=1 λ
1 . + β2
(5)
3. Draw α from p(α|β, y). Combining the data with the uniform prior density p(α|β) yields, p(α|β, y) ∼ N (ˆ α, Vα ).
(6)
ˆ where α ˆ is a precision-weighted average of the Γ’s and Vα is the total precision. Note, we define precision as inverse of variance. 4. Draw Γλ from p(Γλ |α, β, y)
Fig. 1. Bayesian hierarchical model structure.
ˆ λ , Vλ ), p(Γλ |α, β, y) ∼ N (Θ
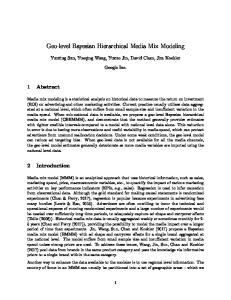
(7) Estimation Comparison: Bayesian vs. Simple MSE:upper, Variance:lower
and Vλ =
1 2 σλ
1 +
1 β2
(8)
.
Bayesian N=20
Simple N=20
Bayesian N=4
Simple N=4
Bayesian N=20
Simple N=20
Bayesian N=4
Simple N=4
(9)
ˆ λ , i.e. 5. Take hyperbolic tangent transformation of Γ ˆ λ ), ρˆλ = tanh(Γ
0.05
1 ˆ 1 2 Γλ + β 2 α σλ , 1 1 2 + β2 σλ
(10)
and the sampling distribution ρˆλ is the desired posterior distribution. 3. SIMULATIONS We evaluated the performance of the full Bayesian estimation by comparing with the marginal estimation in terms of Mean Squared Error (MSE) and variance. Fig. 2 plots MSE’s and variances of the Bayesian correlation estimation and the marginal correlation estimation over 500 simulations. It is evident in Fig. 2 that the MSE of Bayesian estimation is about three-fold smaller than that of the marginal estimation. A much dramatic contrast was observed at the small sample size that clearly shows the advantages of the Bayesian estimations for the small sample size problem. Comparison of variances follows the same trend (Fig. 2). 4. ESTIMATING CO-EXPRESSION NETWORK FROM GALACTOSE METABOLISM DATA We also demonstrated the application of our Bayesian approach and compared it with the previous Frequentist approach [3] using a yeast galactose metabolism two-color microarray data [5]. Following the procedure in method section, we simulated the empirical posterior distribution for
0.00 0.15 0.30
ˆλ = Θ
0.20
ˆ λ , Vλ are defined as: where Θ
Fig. 2. Mean Squared Errors (MSE’s) and Variances of the Bayesian estimations versus the simple estimations over 500 runs of simulations.
each correlation parameter Γ. Similar to the previous analysis, we used 0.6 as the correlation cutoff value, and declared the statistical association to be biologically relevant when their (1 − q) × 100% posterior confidence intervals do not intersect with [-0.6, 0.6] at the significant level q. Comparison of the networks inferred from Bayesian hierarchical model and from the previous approach in terms of top hub nodes shows much agreement with certain discrepancies. 5. REFERENCES [1] Butte,A., Tamayo,P. Slonim,D., Golub,T.R. and Kohane,I.S. (2000) Discovering functional relationships between RNA expression and chemotherapeutic susceptibility using relevance networks. Proc Natl Acad Sci USA, 97, 12182-6. [2] Schfer, J. and Strimmer, K. (2005) An empirical Bayes approach to inferring large-scale gene association networks. Bioinformatics, 21(6), 754-764. [3] Zhu, D., Hero, A.O., Qin, Z.S., Swaroop, A. (2005) High throughput screening of co-expressed gene pairs with controlled False Discovery Rate (FDR) and Minimum Acceptable Strength (MAS). J Comput Biol, 12(7), 1029-1045. [4] Gelman, A., Carlin, J.B., Stern, H.S. and Rubin, D.B. (2004) Bayesian Data Analysis. Chapmann & Hall/CRC, Boca Raton, FL, USA. [5] Ideker,T., Thorsson,V. et al. (2000) Testing for differentially-expressed genes by maximum-likelihood analysis of microarray data. J Comput Biol, 7(6): 805-17.