The Journal of Neuroscience, July 8, 2009 • 29(27):8715– 8725 • 8715
Behavioral/Systems/Cognitive
How Ongoing Fluctuations in Human Visual Cortex Predict Perceptual Awareness: Baseline Shift versus Decision Bias Valentin Wyart1,2,3 and Catherine Tallon-Baudry1,2,3,4 1
Universite´ Pierre et Marie Curie–Paris 06, Unite´ Mixte de Recherche (UMR) 7225, S-975, Centre de Recherche de l’Institut Cerveau-Moelle (CRICM), CNRS (Centre National de la Recherche Scientifique), UMR 7225, CRICM, 3Inserm (Institut National de la Sante´ et de la Recherche Me´dicale), UMR-S 975, CRICM, and 4CENIR (Centre de Neuroimagerie de Recherche), Hoˆpital de la Pitie´-Salpeˆtrie`re, Paris F-75013, France
2
Visual perception fluctuates across repeated presentations of the same near-threshold stimulus. These perceptual fluctuations have often been attributed to baseline shifts—i.e., ongoing modulations of neuronal activity in visual areas— driven by top-down attention. Using magnetoencephalography, we directly tested whether ongoing attentional modulations could fully account for the perceptual impact of prestimulus activity on a subsequent seen– unseen decision. We found that prestimulus gamma-band fluctuations in lateral occipital areas (LO) predicted visual awareness, but did not reflect the focus of spatial attention. Moreover, these prestimulus signals influenced the decision outcome independently from the strength of the following visual response, suggesting that baseline shifts alone could not explain their perceptual impact. Using a straightforward decision-making model based on the accumulation of sensory evidence over time, we show that prestimulus gamma-band fluctuations in LO behave as a decision bias at stimulus onset, irrespectively of subsequent stimulus processing. In contrast, spatial attention suppressed prestimulus alpha-band signals in the same region, and produced a sustained baseline shift that also predicted the outcome of the seen– unseen decision. Together, our results indicate that prestimulus fluctuations in visual areas can influence the conscious detection of an upcoming stimulus via two distinct mechanisms: an attentiondriven baseline shift in the alpha range, and a decision bias in the gamma range.
Introduction Visual perception fluctuates across repeated presentations of the same near-threshold stimulus: sometimes the presence of a stimulus is consciously detected, and sometimes it is not. Since the two perceptual outcomes are based on the very same stimulation, these fluctuations of visual awareness are thought to reflect neuronal variability. This neuronal variability is visible in the large fluctuations of evoked sensory responses, but also in the ongoing fluctuations of prestimulus brain signals. Indeed, prestimulus fluctuations of electrophysiological (Williams et al., 2003; Linkenkaer-Hansen et al., 2004; Hanslmayr et al., 2007; Romei et al., 2008; van Dijk et al., 2008) and hemodynamic signals (Ress et al., 2000; Sapir et al., 2005; Sylvester et al., 2007; Hesselmann et al., 2008a,b) predict the conscious perception of subsequently presented stimuli. But what is the nature of these ongoing fluctuations in visual areas? Since spatial attention can modulate visual signals in the absence of visual stimulation (Kastner et al., 1999; Siegel et al., 2008), prestimulus correlates of consciousness in visual areas
Received Feb. 26, 2009; revised May 19, 2009; accepted May 30, 2009. This work was supported by grants from Re´gion Ile-de-France to V.W. and Agence Nationale de la Recherche to C.T.B. We are grateful to A. Ducorps, D. Schwartz, F. Bergame, J. D. Lemarechal, and P. Pradat-Diehl for technical assistance. We thank A. L. Paradis, J. Lorenceau, C. Sergent, S. Dehaene, and two anonymous reviewers for helpful comments on an earlier version of this manuscript. Correspondence should be addressed to Valentin Wyart, Centre de Recherche de l’Institut Cerveau-Moelle, LENA (Laboratoire de Neurosciences Cognitive & Imagerie Ce´re´brale), Baˆtiment Me´decine Physique et Re´adaptation, 47 Boulevard de l’Hoˆpital, Paris F-75013, France. E-mail:
[email protected]. DOI:10.1523/JNEUROSCI.0962-09.2009 Copyright © 2009 Society for Neuroscience 0270-6474/09/298715-11$15.00/0
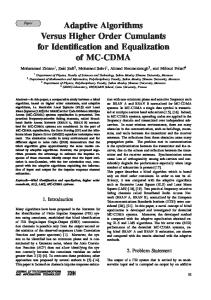
have mostly been attributed to ongoing attentional modulations of sensory processing (Ress et al., 2000)— e.g., increased neuronal excitability at the focus of spatial attention (Sylvester et al., 2007). However, these so-called “baseline shifts” are not the only mechanism that can modulate ongoing brain activity and affect subsequent perceptual judgments. From a decision-making perspective, each seen– unseen report used to probe visual awareness can be considered as a perceptual decision based on the accumulation of sensory evidence about the presence of a stimulus over time (Smith and Ratcliff, 2004; Gold and Shadlen, 2007; Heekeren et al., 2008). According to this view, each perceptual decision depends on two distinct parameters: the quality of sensory evidence available in task-relevant visual areas during stimulus presentation, and the ongoing decision bias toward either percept or response at stimulus onset (Platt and Glimcher, 1999; Yang and Shadlen, 2007). Recent results suggest that some prestimulus correlates of consciousness found in visual areas could index such decision biases (Williams et al., 2003; Hesselmann et al., 2008a,b), but whether they actually reflected attention-driven baseline shifts remains largely unknown. To address this issue, we recorded magnetoencephalographic (MEG) signals while human participants attended toward or away from low-contrast visual gratings, which were consciously detected only half of the time (Wyart and Tallon-Baudry, 2008). At the beginning of each trial (Fig. 1), participants were cued by a predictive central arrow to covertly attend either to their left or right lower visual field (Posner et al., 1980). After 600 ms, a grating at detection threshold was presented for 400 ms either at the cued or uncued location, or occasionally was not presented at all
Wyart and Tallon-Baudry • Baseline Shift versus Decision Bias
8716 • J. Neurosci., July 8, 2009 • 29(27):8715– 8725
Of the 80 stimuli, 52 were presented at the cued location, while 28 were presented at the uncued location. Trials within a recording session were presented in a different pseudorandomized order for each participant. Participants were not given any explicit feedback regarding either the proportion of stimulus-absent trials or the presence of a stimulus at the end of each trial, since such information could have introduced undesirable prior expectations about the presence of a stimulus in subsequent trials.
MEG recordings
Figure 1. Experimental design. Temporal structure of a trial, from left to right. After a variable fixation period of 0.8 –1 s, participants were cued by a predictive central arrow to covertly attend either to their left or right lower visual field. After 600 ms, a low-contrast grating at detection threshold appeared for 400 ms either at the cued or uncued location, or occasionally did not appear at all. Participants first selected the orientation of the grating among two choices and then reported whether they believed a grating was presented during the trial, by pressing one of two buttons with their right hand.
(see Materials and Methods). Participants first selected the orientation of the grating among two choices (forced-choice discrimination task) and then reported whether they had seen a grating during the trial (detection task). We studied the perceptual impact of prestimulus MEG activity in visual areas on the subsequent seen– unseen report of visual awareness, while explicitly controlling the focus of spatial attention.
Materials and Methods Participants Twelve right-handed participants with normal or corrected-to-normal vision took part in the study (six women, age range 18 –28 years). All participants provided informed written consent and were paid €45 for their participation. All procedures were approved by the local ethics committee (Comite´ Consultatif de Protection des Personnes dans la Recherche Biome´dicale, Hoˆpital de la Pitie´-Salpeˆtrie`re).
Stimuli and behavioral task The visual stimuli were circular gratings (spatial frequency: 5.0 cycles per degree of visual angle, diameter: 2.0° of visual angle, orientation: chosen among 20 equally spaced between 0 and , vertical and horizontal orientations being excluded). The stimuli were positioned at 2.0° of visual angle from fixation with a declination of 30° in the left or right lower visual quadrants. The contrast of the stimuli was manipulated to reach threshold levels (⬍5%) using a simple software attenuator (Tyler, 1997). The left and right spatial cues only differed by three corners from the fixation cross and were subtending 0.9 ⫻ 0.6° of visual angle around fixation. The stimuli, fixation cross, and spatial cues were created off-line using MATLAB (The MathWorks), and stimulus presentation was controlled using the Psychtoolbox package for MATLAB (Brainard, 1997; Pelli, 1997). All stimuli were presented via a mirror system on a gray background (luminance: 26.9 cd/m 2) at the center of a back projection screen positioned at 85 cm from the participant’s eyes, using a calibrated Mitsubishi X120 projector (resolution: 1024 ⫻ 768 pixels, refresh rate: 60 Hz) located outside the shielded recording room. The luminosity of the recording room was controlled as well as the luminance of the gray background of the projection screen using a Konica Minolta LS-100 luminance meter. The experimental procedure has been previously described by Wyart and Tallon-Baudry (2008). Each participant underwent a calibration session before the experiment to estimate the threshold contrast for which only half of the presented stimuli were reported as present. The calibration session was followed by eight recording sessions. Each of the eight recording sessions consisted of 92 trials, including 80 trials in which stimuli at threshold contrast were presented either in the left or right lower visual field, and 12 blank trials in which no stimulus was presented.
Continuous magnetoencephalographic signals were collected using a whole-head MEG system with 151 axial gradiometers (CTF Systems) at a sampling rate of 1250 Hz and low-pass filtered online at 300 Hz. Head localization was tracked during the experiment with respect to the MEG sensor array using marker coils that were placed at the cardinal points of the head (nasion and left and right ears). Vertical and horizontal electrooculogram (EOG) signals were simultaneously collected.
Data analysis Data analysis was performed using in-house software (http://cogimage.dsi.cnrs. fr/logiciels/), the Fieldtrip package (http://www.ru.nl/fcdonders/fieldtrip/), and additional programs developed in MATLAB (The MathWorks). All time samples were corrected with respect to the refresh delay of the projector (⫹25 ms, measured online with a photodiode). Artifact rejection. Trials contaminated with eyes movements (rejection threshold: 1.0° of visual angle from fixation), eye blinks or muscular artifacts were rejected off-line upon visual inspection of their unfiltered EOG and MEG traces. Besides, two malfunctioning MEG sensors (MRF21 overlying right frontal cortex, and MRT32 overlying right temporal cortex) were discarded from all analyses. Time–frequency analysis. A time–frequency wavelet transform was applied to each trial at each MEG sensor using a family of complex Morlet wavelets (m ⫽ 10), resulting in an estimate of oscillatory power at each time sample and at each frequency between 5 and 150 Hz. Importantly, the time–frequency resolution of the wavelets was frequency dependent (10 Hz: ⫽ 150 ms, 1 Hz; 50 Hz: ⫽ 30 ms, 5 Hz). The time–frequency data during the last 200 ms of the fixation period preceding each trial (⫺200 to 0 ms relative to cue onset, i.e., ⫺800 to ⫺600 ms relative to stimulus onset) was used as baseline, after ensuring that raw baseline power in the gamma frequency band of interest (48 – 64 Hz) did not differ significantly between subsequent seen and unseen reports of visual awareness (signed-rank test, p ⬎ 0.2). An index of signal power, defined at each time sample and frequency as the increase of signal power relative to fixation baseline in logarithmic units, was considered as the measure of interest for all time–frequency analyses. Indeed, the log-transformed data were distributed normally, which allowed us to use standard parametric tests (e.g., paired t test, repeated-measures ANOVA) to assess the statistical significance of observed effects. Source estimation. To estimate the neural sources of gamma-band activity in the 50 –70 Hz frequency band from a single transform, we used the “beamforming” adaptive spatial linear filtering technique (Gross et al., 2001), along with “multitaper” spectral estimates using a fixed time window of 200 ms (⫹250 to ⫹450 ms relative to stimulus onset) and 10 orthogonal Slepian tapers, as implemented in the Fieldtrip package. For each source location, a linear filter was computed that passes activity from this location with unit gain, while maximally attenuating activity from other source locations. For each participant, a forward model was computed using a single-shell volume conductor model from an anatomical MRI template (Montreal Neurological Institute), and the participant’s head position with respect to the MEG sensor array. Whole-brain source estimation was performed on a regular three-dimensional grid of 1 cm resolution and linearly interpolated for display purposes. Receiver operating characteristic analysis. Receiver operating characteristic (ROC) analysis provides a measure of the degree of separation between the single-trial distributions of neuronal activities associated with seen and unseen decisions (Green and Swets, 1966). Precisely, we computed a normalized predictive power index A⬘ derived from the area under the ROC curve. Each point of an ROC curve represents the proportion of seen decisions for which the neuronal activity was higher than a given threshold, against the proportion of unseen decisions for which
Wyart and Tallon-Baudry • Baseline Shift versus Decision Bias
the neuronal activity exceeded the same threshold. The ROC curve can be traced by varying the threshold between the minimum and maximum values of both distributions. We used a nonparametric estimate of the area under the ROC curve corresponding to the trapezoidal area under the empirical ROC curve (Macmillan and Creelman, 2005). The predictive power A⬘ corresponded to a scaled percentile version of the estimate of the area under the ROC curve (AUC) between ⫺1 and ⫹1:
A⬘ ⫽ 2 䡠 共 AUC ⫺ 0.5兲. This index can be interpreted as the objective performance of an ideal observer at predicting the outcome of the seen– unseen decision based only on neuronal activity for a single trial. A null predictive power indicates that the corresponding neuronal activity does not predict the seen– unseen decision better than chance, whereas a positive or negative value indicates that the corresponding neuronal activity predicts the subsequent seen– unseen decision better than chance, with higher or lower levels of neuronal activity for predicted seen decisions, respectively. Extraction of residual variability. We used partial rank correlations between single-trial distributions of prestimulus and poststimulus frequency-specific activities at the participant level to extract the following: (1) the residual variability in the prestimulus time window (⫺300 to ⫺100 ms relative to stimulus onset) which did not correlate with trialto-trial fluctuations in the poststimulus time window (⫹250 to ⫹450 ms relative to stimulus onset), and (2) the residual variability in the poststimulus time window which did not correlate with trial-to-trial fluctuations in the prestimulus time window. We verified that there was no spurious correlation between the residual prestimulus variability and the fluctuations in the poststimulus time window for the gamma (rank correlation test, mean ⫽ ⫹0.03, p ⬎ 0.2 for all participants) and alpha (rank correlation test, mean ⫽ ⫹0.04, p ⬎ 0.2 for all participants) ranges. Decision-making model. We tested the model predictions regarding the predictive power of gamma- and alpha-band activity on the seen– unseen decision using computational simulations (n ⫽ 10,000 simulations). For each model simulation, we computed for each trial of each participant the model decision based on the observed prestimulus and poststimulus frequency-specific activities. We then sorted the single-trial distributions of prestimulus and poststimulus activities relative to the model-based seen and unseen decisions, and computed the corresponding predictive power of the prestimulus and poststimulus activities on model-based decisions. We used these two values (averaged across computational simulations) to obtain unique estimates for the two free parameters in the model: w0, corresponding to the relative strength of the decision bias in the seen– unseen decision (in [0, 1] range), and wdec, corresponding to the absolute influence of gamma-band activity in the decision (also in [0, 1] range). Once the estimates were obtained, we computed the model prediction regarding the predictive power of the residual prestimulus variability, and compared it to the observed value for participants. We defined the model error as the discrepancy between the mean model prediction and the observed value (in normal deviate Z-score units).
Results Perceptual fluctuations did not only reflect fluctuations of attention Behavioral results have been previously described by Wyart and Tallon-Baudry (2008). We report here the results relevant for the present study. At detection threshold (contrast ⫽ 3.3 ⫾ 0.3%, mean ⫾ SEM), participants reported the presence of a stimulus in half of stimulus presentations (hit rate ⫽ 46.6 ⫾ 2.5%) but much less often in blank trials (false-alarm rate ⫽ 14.9 ⫾ 2.6%), corresponding to a detection d⬘ of 1.04 ⫾ 0.14 (t test against zero, p ⬍ 0.001) along with a conservative decision criterion  of ⫹0.69 ⫾ 0.14 (t test against zero, p ⬍ 0.001) (Green and Swets, 1966). Participants correctly discriminated the orientation of the grating in 67.2 ⫾ 1.9% of stimulus presentations, corresponding to a discrimination d⬘ of 0.90 ⫾ 0.10 (t test against zero, p ⬍ 0.001). Moreover, participants discriminated the orientation of the presented grating much more accurately when they consciously de-
J. Neurosci., July 8, 2009 • 29(27):8715– 8725 • 8717
tected its presence (detected gratings: 84.5 ⫾ 3.2%, undetected gratings: 51.7 ⫾ 0.9%, signed-rank test, p ⬍ 0.001). As expected (Posner et al., 1980; Pashler et al., 2001), spatial attention improved the speed and accuracy of orientation discrimination judgments (signed-rank test, mean reaction time to detected gratings: attentional cueing effect ⫽ ⫺47 ⫾ 13 ms, p ⬍ 0.01, correct discrimination rate: attentional cueing effect ⫽ ⫹4.9 ⫾ 2.6%, p ⬍ 0.05). Precisely, mean reaction times were 1101 ⫾ 62 ms to cued detected gratings, 1148 ⫾ 67 ms to miscued detected gratings, 1110 ⫾ 91 ms to cued undetected gratings, and 1121 ⫾ 98 ms to miscued undetected gratings. However, spatial attention had only a moderate effect on visual awareness, since participants detected 49.9 ⫾ 3.1% of cued gratings, against as much as 40.4 ⫾ 3.0% of miscued gratings (signed-rank test, p ⬍ 0.05). Participants put as much effort into detecting and discriminating the orientation of the gratings: detection d⬘ and discrimination d⬘ did not differ significantly (paired t test, p ⬎ 0.1), and the attentional cueing effects on the detection task (hit rate: cued minus miscued) and the discrimination task (correct discrimination rate: cued minus miscued) were positively correlated across participants (rank correlation test, ⫽ ⫹0.77, n ⫽ 12, p ⬍ 0.005), suggesting similar attentional constraints for the two tasks. The sequence of perceptual reports of visual awareness appeared random. First, there were no more repetitions of seen and unseen decisions than predicted by chance ( 2 goodness-of-fit test against binomial distribution, p ⬎ 0.3). Second, participants were not biased in their decision criterion  by their previous seen– unseen choice (paired t test, p ⬎ 0.5), or by the presence (or absence) of a stimulus in the previous trial (paired t test, p ⬎ 0.5). Finally, detection sensitivity remained constant over the four time quartiles of the experiment (repeated-measures ANOVA, hit rate: p ⬎ 0.1, detection d⬘: p ⬎ 0.1). Altogether, the results suggest that fluctuations of perceptual reports reflected neither prior expectations about the presence of a stimulus based on the previous trial nor slow fluctuations of alertness. Besides, the focus of spatial attention could account only partially for these trial-to-trial fluctuations. Therefore, there remained a large part of unexplained variability in the perceptual reports of visual awareness. From neural correlates to neural predictors of visual awareness The analysis of the oscillatory MEG response to the nearthreshold visual stimuli revealed a neural dissociation between correlates of visual awareness and spatial attention in human visual cortex (Wyart and Tallon-Baudry, 2008). In particular, gamma-band activity increased in response to detected stimuli but was not modulated by spatial attention. Interestingly, this activity correlated with seen– unseen decisions even in blank trials—i.e., in the absence of visual stimulation. We therefore suspected that ongoing fluctuations of gamma-band activity before stimulus onset could also influence the conscious detection of the near-threshold stimuli. To test this hypothesis, we extended the analysis of the oscillatory MEG activity to the prestimulus time period, at the time when participants focused their attention at the cued location, over the same occipital region of interest (ROI) that correlated with visual awareness during stimulus presentation (Fig. 2 A). During the prestimulus time period, occipital MEG signals showed frequency-specific modulations relative to fixation (Fries et al., 2008; Siegel et al., 2008): power suppressions at low frequencies, in particular in the alpha range, and power increases at high frequencies in the gamma range (Fig. 2 B). Prestimulus fluctuations of gamma-band activity (48 – 64 Hz)
8718 • J. Neurosci., July 8, 2009 • 29(27):8715– 8725
Wyart and Tallon-Baudry • Baseline Shift versus Decision Bias
over the occipital ROI correlated with the conscious detection of upcoming stimuli at ⫺300 to ⫺100 ms relative to stimulus onset (repeated-measures ANOVA, p ⬍ 0.01) (Fig. 2C). Although prestimulus gamma-band signals were equally strong over left and right occipital ROI across trials ( p ⬎ 0.5), their perceptual impact was spatially selective, in the sense that only prestimulus fluctuations contralateral to the location of the upcoming stimulus differed depending on the subsequent seen– unseen decision (double interaction: p ⬍ 0.05, contralateral to the upcoming stimulus: p ⬍ 0.005; ipsilateral to the upcoming stimulus: p ⬎ 0.3) (Fig. 3A). This spatial selectivity suggests that the prestimulus gamma-band activity was localized in retinotopic visual areas. But did these prestimulus fluctuations of gamma-band activity reflect the focus of spatial attention? Surprisingly, spatial attention did not modulate prestimulus gamma-band activity contralaterally to the cued location (repeated-measures ANOVA, p ⬎ 0.5) (Fig. 3B). Besides, the direction of the cue did not influence the effect of prestimulus gamma-band activity Figure 2. Time–frequency analysis of prestimulus MEG activity. A, ROI in sensor space. Two-dimensional projection of the MEG on the subsequent seen– unseen decision sensor array superimposed on a schematic view of the head (ANT, anterior; POS, posterior; L, left; R, right). Thick black and white (double interaction: p ⬎ 0.2). To further sensors indicate left and right occipital ROI, respectively. B, Mean oscillatory activity over the occipital ROI contralateral to the exclude the possibility that this spatially stimuli, in the low (⬍30 Hz) and high (⬎30 Hz) frequency ranges. Time is expressed relative to stimulus onset. Oscillatory activity selective prestimulus effect on visual is expressed in logarithmic power units relative to fixation baseline (relative power). C, Visual awareness effect (detected minus awareness is driven by the direction of the undetected stimuli). Effect size is expressed in relative F-score (positive: detected ⬎ undetected, negative: detected ⬍ undeteccue, we assessed that the perceptual impact ted). The black box highlights the prestimulus visual awareness effect in the gamma range, corresponding to a stronger increase of prestimulus gamma-band activity on vi- of prestimulus gamma-band activity for subsequently detected stimuli (**p ⬍ 0.01). D, Spatial attention effect (attended minus sual awareness was more dependent on the unattended ROI). The black box highlights the prestimulus attentional modulation in the alpha range, corresponding to a stronger location of the upcoming stimulus than on suppression of prestimulus alpha-band activity contralaterally to the cued location (***p ⬍ 0.001; ns, nonsignificant). the direction of the cue (repeated-measures occipital gyrus, which we will refer to as lateral occipital areas ANOVA, triple interaction: p ⬍ 0.05). (LO). We defined a bilateral ROI at the peak of gamma-band Nevertheless, spatial attention induced frequency-specific activity (⬎ 50% of the maximum relative power across all voxels, modulations during the prestimulus time period, but at lower Talairach coordinates: x ⫽ ⫺37/⫹33, y ⫽ ⫺84, z ⫽ ⫺16 mm) frequencies. In accordance with previous results (Thut et al., (Fig. 4 A, left). This high-frequency response in LO was stronger 2006; Fries et al., 2008; Siegel et al., 2008), the alpha-band supcontralaterally to detected stimuli (repeated-measures ANOVA, pression (10 –12 Hz) over the occipital ROI was stronger conp ⬍ 0.05) (Fig. 4 A, right), correlated with visual awareness ( p ⬍ tralaterally to the cued location at ⫺300 to ⫺100 ms relative to 0.005), but was not modulated by the focus of spatial attention stimulus onset (repeated-measures ANOVA, p ⬍ 0.001). The ( p ⬎ 0.5), as previously observed in sensor space (Wyart and temporal dynamics of this attentional modulation of alpha-band Tallon-Baudry, 2008). activity differed markedly from the dynamics of the prestimulus Prestimulus gamma-band fluctuations in LO differed deeffect of gamma-band activity on visual awareness (Fig. 2 D). pending on the subsequent seen– unseen decision at ⫺300 to Therefore, prestimulus gamma-band fluctuations in visual ar⫺100 ms relative to stimulus onset (repeated-measures ANOVA, eas predicted subsequent perceptual reports of visual awareness p ⬍ 0.05) (Fig. 4 B). As observed in sensor space, the difference in a spatially selective manner, but they did not reflect the focus of was significant only for the hemisphere contralateral to the upspatial attention, in contrast to prestimulus alpha-band coming stimulus (double interaction: p ⬍ 0.05, contralateral to fluctuations. the upcoming stimulus: p ⬍ 0.005, ipsilateral to the upcoming stimulus: p ⬎ 0.5). During the same prestimulus time period, Source estimates of gamma-band activity in lateral spatial attention induced frequency-specific modulations in LO occipital areas in the alpha range (repeated-measures ANOVA, p ⬍ 0.001), but We confirmed these findings in source space. We first estimated not in the gamma range (repeated-measures ANOVA, p ⬎ 0.1). the sources of gamma-band activity (50 –70 Hz) during the preThese results show that the prestimulus gamma-band fluctusentation of a detected stimulus (⫹250 to ⫹450 ms relative to ations that predicted the subsequent seen– unseen decision were stimulus onset), using spatial filtering techniques (see Materials localized in the same visual region (LO) and in the same freand Methods). The source estimates of gamma-band activity quency range as the following visual response to the nearwere localized in extrastriate visual areas overlapping the lateral
Wyart and Tallon-Baudry • Baseline Shift versus Decision Bias
J. Neurosci., July 8, 2009 • 29(27):8715– 8725 • 8719
decision based only on gamma-band activity at a single time point of a single trial. Positive and negative values correspond to higher and lower levels of gamma-band activity for predicted seen decisions, respectively. In sensor space, the predictive power of gamma-band activity peaked in two distinct time windows over the occipital ROI contralateral to the stimulus (Fig. 5A): a prestimulus time window at ⫺300 to ⫺100 ms relative to stimulus onset (t test against zero, A⬘ ⫽ ⫹6.2 ⫾ 1.5, p ⬍ Figure 3. Spatial selectivity of prestimulus gamma-band activity. A, Spatial selectivity of prestimulus gamma-band effect on 0.001) and a poststimulus time window at visual awareness. Prestimulus gamma-band activity (48 – 64 Hz, ⫺300 to ⫺ 100 ms relative to stimulus onset) for detected and 250 – 450 ms after stimulus onset (t test undetected stimuli, over the occipital ROI contralateral and ipsilateral to the location of the upcoming stimulus. Only contralateral against zero, A⬘ ⫽ ⫹7.5 ⫾ 1.3, p ⬍ 0.001). prestimulus fluctuations differed depending on the subsequent report of visual awareness (**p ⬍ 0.01; ns, nonsignificant). We applied the same approach to blank Gamma-band activity is expressed in relative power. Error bars indicate SEM. B, Absence of attentional modulation of prestimulus trials—i.e., trials for which no stimulus gamma-band activity. Prestimulus gamma-band activity for attended and unattended hemispheres, over the occipital ROI con- was presented. In these trials, participants tralateral and ipsilateral to the location of the upcoming stimulus. The focus of spatial attention did not modulate the pattern of sometimes erroneously detected the presprestimulus gamma-band activity. ence of a physically absent stimulus. Although there were only a few of these falsealarm reports per participant (from n ⫽ 1 to n ⫽ 26, median n ⫽ 7), the predictive power of gamma-band activity over the bilateral occipital ROI for blank trials revealed a qualitatively similar pattern with two successive peaks, one before and one after stimulus onset. The first predictive peak, centered around ⫺100 ms relative to stimulus onset, almost reached statistical significance (t test against zero, p ⫽ 0.06), suggesting that prestimulus gamma-band fluctuations in visual areas influenced subsequent seen– unseen decisions even when no stimulus was presented. In stimulus trials, the predictive power of gamma-band activity was not different before and after stimulus onset (paired t test, p ⬎ 0.2), but showed a significant drop in a peristimulus time window centered at stimulus onset (⫾ 100 ms) (repeated-measures ANOVA, p ⫽ 0.001). Indeed, the predictive power in the perisFigure 4. Source estimates of gamma-band activity. A, ROI in source space. Left, The source estimates of the visual gamma- timulus time window was not different band response to the stimuli (50 –70 Hz, ⫹250 to ⫹450 ms relative to stimulus onset) were found in LO (Talairach coordinates from zero (t test against zero, A⬘ ⫽ ⫹0.8 ⫾ in millimeters; LH, left hemisphere; RH, right hemisphere). White lines correspond to the displayed slices. Right, The visual gamma-band response peaked contralaterally to detected stimuli (left panel, contralateral hemisphere; right panel, ipsilateral 1.8, p ⬎ 0.5) and was significantly weaker hemisphere). Black arrows indicate the contralateral ROI. Gamma-band activity is expressed in relative power. B, Time course of than in the prestimulus ( post hoc compargamma-band activity in LO. Prestimulus gamma-band activity in LO differed depending on the subsequent report of visual ison, p ⬍ 0.005) and poststimulus time awareness. Time is expressed relative to stimulus onset. Gamma-band activity is expressed in relative power. Error bars indicate windows ( post hoc comparison, p ⬍ SEM. Thick lines at the bottom indicate when gamma-band activity differs significantly depending on detected (aware) and 0.005). Besides, this significant drop in undetected (unaware) stimuli (black, p ⬍ 0.01; gray, p ⬍ 0.05). predictive power around stimulus onset did not merely reflect an overall decrease threshold stimulus—which also correlated with the seen– unseen of gamma-band activity between the prestimulus and peristimudecision. But how did the prestimulus and poststimulus gammalus time windows (paired t test, p ⬎ 0.5). band fluctuations contribute to perceptual awareness? To test whether prestimulus and poststimulus gamma-band fluctuations reflected the same variability, we computed the corPerceptual impact of prestimulus gamma-band activity relation between the trial-to-trial fluctuations of gamma-band To measure quantitatively the perceptual impact of gamma-band activity in the prestimulus and poststimulus time windows. The activity, we computed the predictive power A⬘ of gamma-band correlation between these two time windows was significant activity on the seen– unseen decision at the single-trial level using (rank correlation test, mean ⫽ ⫹0.49, p ⬍ 0.001 for all participants). This observation points toward the existence of a baseline ROC analysis (Green and Swets, 1966, see Materials and Methshift—i.e., an ongoing level of gamma-band activity which afods). This bias-free index can be interpreted as the performance fected both prestimulus and poststimulus time windows. This of an ideal observer at predicting the participant’s seen– unseen
8720 • J. Neurosci., July 8, 2009 • 29(27):8715– 8725
Wyart and Tallon-Baudry • Baseline Shift versus Decision Bias
ing gamma-band response. Because these prestimulus fluctuations precede the gamma-band response by several hundreds of milliseconds, they must leave a neuronal “trace” at the decision level. This idea is well accounted for in the perceptual decision-making framework (Smith and Ratcliff, 2004; Gold and Shadlen, 2007; Heekeren et al., 2008). According to this view, each seen– unseen decision is based on the accumulation of sensory evidence about the presence of a stimulus over time. Qualitatively, our results fit well the perceptual decisionmaking framework and suggest that (1) gamma-band activity is integrated at the decision level as sensory evidence during stimulus presentation (Siegel et al., 2007); and (2) this accumulation of sensory evidence is biased at stimulus onset by prestimulus gamma-band fluctuations. To formally test this interpretation of our findings, we designed a straightforward decision-making model of the seen– unseen decision based on gamma-band fluctuations in visual areas (Fig. 6 A). Precisely, we computed a synthetic decision variable corresponding to a noisy observation of the weighted sum of prestimulus and poststimulus gamma-band activities. At the single-trial level, the weighted poststimulus gamma-band activity is considered as sensory evidence about the presence of a stimulus, while the weighted prestimulus gamma-band activity is considered as an ongoing decision bias toward the seen (or unseen) decision at stimulus onset. Formally, the decision variable Xdec is described by the following: Figure 5. Perceptual impact of prestimulus gamma-band activity. A, Time course of the predictive power of gamma-band activity over the occipital ROI contralateral to the stimuli. Time is expressed relative to stimulus onset. Predictive power is expressed as A⬘ (mean ⫾ SEM). Shaded areas indicate the prestimulus (PRE) and poststimulus (POST) time windows. Thick lines at the bottom indicate when gamma-band activity predicts the subsequent seen– unseen decision better than chance (black, p ⬍ 0.01; gray, p ⬍ 0.05). B, Extraction of the residual gamma-band variability. The residual prestimulus variability corresponds to the fluctuations in the prestimulus time window which did not correlate with the fluctuations in the poststimulus time window (and vice versa for the residual poststimulus variability). The residual prestimulus gamma-band variability still predicted the seen– unseen decision better than chance (***p ⬍ 0.001, **p ⬍ 0.01, *p ⬍ 0.05). Error bars indicate SEM.
positive correlation could indicate that the perceptual impact of prestimulus gamma-band activity on the seen– unseen decision relies only on the strength of the following gamma-band response. In other words, prestimulus gamma-band fluctuations could predict visual awareness only because they reflected ongoing fluctuations that also modulated the strength of the subsequent gamma-band response to the near-threshold stimulus— i.e., only because of the presence of a baseline shift. To test for this interpretation, we extracted from prestimulus gamma-band fluctuations the residual variability which did not correlate with the fluctuations of the gamma-band response to the visual stimulus, and computed its predictive power on the outcome of the seen– unseen decision. Surprisingly, the residual prestimulus gamma-band variability still predicted the seen– unseen decision better than chance contralaterally to the upcoming stimulus (t test against zero, A⬘ ⫽ ⫹3.1 ⫾ 1.4, p ⬍ 0.05) (Fig. 5B). Therefore, the observed baseline shift could not explain per se the predictive power of the residual prestimulus gamma-band variability on the seen– unseen decision. Interpretation within the perceptual decision-making framework Altogether, our results suggest that prestimulus fluctuations of gamma-band activity in visual areas biased directly perceptual decisions, independently from the strength of the follow-
Xdec ⫽ wdec 䡠 Z共w0 䡠 Xpre ⫹ 共1 ⫺ w0 兲 䡠 Xpost兲 ⫹ 共1 ⫺ wdec兲 䡠 N共 0,1 兲 , where Xpre is the vector of prestimulus gamma-band activities across trials, Xpost is the vector of poststimulus gamma-band activities across trials, Z( ) is the normal deviate, and N(0,1) is Gaussian noise with zero mean and unit variance. There are two free parameters in the model: w0 corresponds to the relative strength of the decision bias in the seen– unseen decision (in [0, 1] range), while wdec corresponds to the absolute influence of gamma-band activity in the decision (also in [0, 1] range). For each trial of each participant, we used the estimates of xpre and xpost from the experimental data to compute xdec. Following signal detection theory (Green and Swets, 1966), if Z(xdec) exceeded ⌽ ⫺1(h), where ⌽ ⫺1( ) is the inverse cumulative normal distribution function and h is the hit rate of the participant across trials, then the seen decision was taken. Otherwise, the unseen decision was taken. We used the single-trial distributions of prestimulus and poststimulus gamma-band activities to compute model-based perceptual decisions at the single-trial level (see Materials and Methods). Therefore, the observed baseline shift—i.e., the correlation between prestimulus and poststimulus gamma-band activities— was also present in model simulations. If w0 ⫽ 0, then the prestimulus gamma-band activity does not influence directly the decision-making process—i.e., there is no decision bias. In contrast, if w0 ⬎ 0, then the prestimulus gamma-band activity influences directly the decision-making process by producing a decision bias. We first sampled the whole parameter space by computing for each possible (wdir, wdec) couple the predictive power of prestimulus and poststimulus gamma-band activities on model-based perceptual decisions using ROC analysis (Fig. 6 B). The observed mean predictive power of gamma-band activity for participants uniquely defined estimates for w0 and wdec (w0 ⫽ 0.35, wdec ⫽ 0.08). The estimate for w0 was noticeably larger than zero. Having determined the values of the model parameters w0 and
Wyart and Tallon-Baudry • Baseline Shift versus Decision Bias
Figure 6. Interpretation within the perceptual decision-making framework. A, Decision-making model. The prestimulus gamma-band activity (PRE box) is followed by the poststimulus gamma-band activity (POST box). In turn, the poststimulus gamma-band activity is accumulated as sensory evidence about the presence of a stimulus during the decision process (DEC box). The prestimulus gamma-band activity influences subsequent perceptual decisions either indirectly via its correlation with the poststimulus gamma-band activity (black arrows), or directly as a decision bias (blue arrow). The extraction of the residual prestimulus variability (light gray bar) from the total prestimulus variability (dark gray bar) allows to choose between these two possible interpretations. B, Estimation of model parameters. We computed the predictive power A⬘ of gamma-band activity on model-based decisions for each possible (w0, wdec) couple in the prestimulus (left panel) and poststimulus (right panel) time windows. Isolines correspond to the observed predictive power of gamma-band activity on participants’ decisions in the prestimulus (A⬘ ⫽ ⫹6.2) and poststimulus (A⬘ ⫽ ⫹7.5) time windows. Both isolines are shown on each panel. Their intersection uniquely defined estimates for the model parameters w0 and wdec (w0 ⫽ 0.35, wdec ⫽ 0.08). C, Fitted model. Top, Schematic view of the decision-making model. The prestimulus gamma-band activity influences directly the subsequent model-based decision as a decision bias (w0 ⫽ 0.35). Strong gamma-band increases lead to seen decisions. Bottom, Model predictions regarding the predictive power A⬘. Thick horizontal lines correspond to the fitted values from the observed values for participants used to obtain estimates for w0 and wdec. Center error bars indicate SEM. Side error bars indicate the discrepancy between model predictions and the observed values for participants (model error). Model predictions matched the observed values, both quantitatively and qualitatively (***p ⬍ 0.001, **p ⬍ 0.01, *p ⬍ 0.05). D, Control model. Top, Schematic view of the decision-making model. The prestimulus gamma-band activity influences indirectly the subsequent model-based decision via its correlation with the strength of the visual gamma-band response (w0 ⫽ 0). Bottom, Model predictions regarding the predictive power A⬘. Side arrows indicate large discrepancies between model predictions and the observed values for participants (model error ⬎ 1). Model predictions did not match the observed values (ns, nonsignificant).
J. Neurosci., July 8, 2009 • 29(27):8715– 8725 • 8721
wdec based on the predictive power of the prestimulus and poststimulus gammaband activities, we then tested the model prediction regarding the predictive power of the residual prestimulus gamma-band variability on the seen– unseen decision (see Materials and Methods). The model prediction was strikingly close to the observed value, both qualitatively and quantitatively (Fig. 6C). Indeed, the predicted A⬘ was significantly positive (one-tailed t test, median p ⬍ 0.05) and was equal to ⫹3.1, compared with ⫹3.1 ⫾ 1.4 for participants (model error ⬍0.1, one-tailed t test against model prediction, p ⬎ 0.4). More generally, the model predictions revealed the same qualitative effects observed for participants (Table 1). To determine whether the quality of the model fit critically depended on the presence of a decision bias by prestimulus gamma-band fluctuations, we suppressed it in subsequent model simulations by setting w0 to zero (while keeping the previous estimate for wdec ⫽ 0.08). This time, the model predictions did not match observed values for participants, especially regarding the predictive power of the residual prestimulus gamma-band activity on perceptual decisions (Fig. 6D). The predicted A⬘ was no longer different from zero (one-tailed t test, median p ⬎ 0.4) and was equal to ⫹0.4 compared with ⫹3.1 ⫾ 1.4 for participants (model error ⫽ 1.6, one-tailed t test against model prediction, p ⬍ 0.05) (Table 1). In both simulations, the amount of correlation between prestimulus and poststimulus gamma-band activities was the same as in the participants’ data. The only difference between the two models is the presence (or absence) of a decision bias on the subsequent seen– unseen decision. We compared the two models using the Bayes factor (Kass and Raftery, 1995)—i.e., the ratio of the likelihood of observing the participants’ values given each of the two models (w0 ⫽ 0.35 and w0 ⫽ 0, respectively). The model with the decision bias was 18 times more likely (⫹2.9 in natural logarithmic units) than the model without the decision bias. Therefore, a straightforward decisionmaking model of the seen– unseen decision based on the integration of gammaband fluctuations in visual areas could successfully account for participants’ decisions. Importantly, the model predictions were found to be accurate only if prestimulus gamma-band fluctuations produced a decision bias on the subsequent seen– unseen decision, independently from the strength of the following gammaband response.
Wyart and Tallon-Baudry • Baseline Shift versus Decision Bias
8722 • J. Neurosci., July 8, 2009 • 29(27):8715– 8725
Table 1. Model-based predictions and comparison with participants Gamma-band activity
Model parameters w0 wdec Model predictions PRE, total PRE, residual POST, total POST, residual Model errors PRE, total PRE, residual POST, total POST, residual Model comparison Bayes factor
Model 1
Model 2
0.35 0.08
0.00 0.08
⫹6.2 ** ⫹3.1 * ⫹7.5 *** ⫹5.3 **
⫹4.0 * ⫹0.4 ⫹8.0 *** ⫹7.0 ***
⬍0.1 ⬍0.1 ⬍0.1 0.2
Alpha-band activity Participants
⫹6.2 *** ⫹3.1 * ⫹7.5 *** ⫹4.9 **
1.3 (*) 1.6 * 0.3 1.2 (*)
Model 1
Model 2
0.35 0.08
0.00 0.08
⫺6.2 ** ⫺3.1 * ⫺7.5 *** ⫺5.3 **
⫺4.0 * ⫺0.4 ⫺8.0 *** ⫺7.0 ***
1.6 * 2.1 ** 0.3 1.2 (*)
⫹2.9 (18:1)
Participants
⫺3.5 * ⫹0.4 ⫺8.0 *** ⫺7.4 ***
0.4 0.5 ⬍0.1 0.3
⫺4.1 (1:58)
Model predictions regarding the predictive power A⬘ of gamma- and alpha-band activity: one-tailed t test against zero, ***median p ⬍ 0.001, **median p ⬍ 0.01, *median p ⬍ 0.05. Model errors (in normal deviate Z-score units): one-tailed t test between model prediction and participants, **p ⬍ 0.01, *p ⬍ 0.05, (*): p ⬍ 0.1.
Perceptual impact of prestimulus alpha-band activity Prestimulus gamma-band fluctuations in visual areas did not reflect the focus of spatial attention. Indeed, spatial attention did not modulate the observed pattern of prestimulus gamma-band activity and did not interfere with the effect of prestimulus gamma-band activity on the seen– unseen decision. Nevertheless, spatial attention also influenced visual awareness, since participants detected the presence of a stimulus more often when presented at the cued location. To determine whether this attentional cueing effect also corresponded to a decision bias at stimulus onset, we used the same model-based approach as above to study how prestimulus correlates of spatial attention influenced subsequent seen– unseen decisions. Since spatial attention induced a frequency-specific suppression of prestimulus alpha-band signals in visual areas (Thut et al., 2006; Fries et al., 2008; Siegel et al., 2008; Wyart and TallonBaudry, 2008), we computed the predictive power A⬘ of alphaband activity on the seen– unseen decision over time (Fig. 7A). Interestingly, alpha-band activity started to predict the subsequent seen– unseen decision better than chance in the prestimulus time window, when spatial attention started to suppress alpha-band activity contralaterally to the cued location, over the occipital ROI contralateral to the upcoming stimulus (t test against zero, A⬘ ⫽ ⫺3.5 ⫾ 1.5, p ⬍ 0.05). The predictive power gradually increased and peaked in the poststimulus time window (t test against zero, A⬘ ⫽ ⫺8.0 ⫾ 1.6, p ⬍ 0.001). In contrast to the gamma range, the predictive power of alpha-band activity on perceptual decisions was consistently stronger after than before stimulus onset (paired t test, p ⬍ 0.001). Nevertheless, the correlation between prestimulus and poststimulus alpha-band fluctuations (rank correlation test, mean ⫽ ⫹0.49, all p ⬍ 0.001) was as strong as the one previously observed within the gamma range (paired t test, p ⬎ 0.5), indicating the presence of a baseline shift in the alpha range. However, there was no correlation between alpha- and gamma-band fluctuations in either the prestimulus (rank correlation test, mean ⫽ ⫺0.01, all p ⬎ 0.05) or poststimulus (rank correlation test, mean ⫽ ⫺0.01, all p ⬎ 0.05) time window—i.e., mutually independent baseline shifts in the alpha and gamma ranges. As before, we extracted from prestimulus alpha-band fluctuations the residual variability which did not correlate with poststimulus fluctuations in the same frequency range, and computed its predictive power on the seen– unseen decision using ROC
analysis. In contrast to what was observed in the gamma range, the residual prestimulus alpha-band variability no longer predicted the seen– unseen decision better than chance (t test against zero, A⬘ ⫽ ⫹0.4 ⫾ 1.0, p ⬎ 0.5) (Fig. 7B). This result suggests that prestimulus fluctuations of alpha-band activity did not produce a decision bias on the seen– unseen decision. We confirmed this interpretation using the same decisionmaking model as before (Fig. 6 A). This time, we used the singletrial distributions of prestimulus and poststimulus alpha-band suppressions to compute model-based perceptual decisions at the single-trial level, and obtained unique estimates for w0 and wdec (w0 ⫽ 0.00, wdec ⫽ 0.08). Importantly, the estimate for w0 was zero, and the estimate for wdec was the same as in the gamma range. We tested the model prediction regarding the predictive power of the residual prestimulus alpha-band variability on the seen– unseen decision. The model prediction matched the observed value for participants (Fig. 7C). The predicted A⬘ was not different from zero (one-tailed t test, median p ⬎ 0.4) and was equal to ⫺0.4, compared with ⫹0.4 ⫾ 1.0 for participants (model error ⫽ 0.5, one-tailed t test against model prediction, p ⬎ 0.2) (Table 1). To determine whether a model with a decision bias could better fit participants’ decisions, we added such a bias in subsequent model simulations by setting w0 to 0.35 (the estimate for w0 in the gamma range). The corresponding model predictions did not match the observed values for participants, especially regarding the predictive power of the residual prestimulus alpha-band variability (model error ⫽ 2.1, one-tailed t test against model prediction, p ⬍ 0.005) (Table 1). Again, we compared the two models using the Bayes factor and found that the model without a decision bias was 58 times more likely (⫹4.1 in logarithmic units) than the model with a decision bias as strong as the one observed in the gamma range. In conclusion, the observed prestimulus correlates of spatial attention in visual areas did not produce any decision bias on the subsequent seen– unseen decision. In contrast to what was observed in the gamma range, their perceptual impact could be explained solely by the presence of a sensory baseline shift—i.e., ongoing modulations that also affected the strength of the following alpha-band response to the near-threshold stimulus.
Discussion We described here prestimulus alpha- and gamma-band fluctuations in visual areas which both predict the conscious fate of
Wyart and Tallon-Baudry • Baseline Shift versus Decision Bias
J. Neurosci., July 8, 2009 • 29(27):8715– 8725 • 8723
dently from the strength of the following gamma-band response. Using a decisionmaking model, we show that prestimulus gamma-band fluctuations in LO could reflect a decision bias on the accumulation of sensory evidence over time, irrespectively of subsequent stimulus processing. Our results highlight the distinction between two types of prestimulus effects on subsequent perceptual decisions. We show that sensory baseline shifts and decision biases can co-occur independently in the same region, in distinct frequency bands. The predictive power of the alphaband suppression observed in LO built up progressively from cue onset throughout the trial (Romei et al., 2008), suggesting a sustained modulation of neuronal excitability by spatial attention which affected the processing of the near-threshold stimulus. In contrast, the predictive power of gamma-band activity in LO showed two successive peaks, one before and one after stimulus onset, with independent contributions to subsequent perceptual decisions. The two predictive peaks are separated by a ⬃250 ms time period, centered around stimulus onset, during which gamma-band activity in LO does not correlate with the subsequent seen– unseen Figure 7. Perceptual impact of prestimulus alpha-band activity. A, Time course of the predictive power of alpha-band activity decision. This observation underlines that over the occipital ROI contralateral to the stimuli. Time is expressed relative to stimulus onset. Predictive power is expressed as A⬘ gamma-band signals in LO do not reflect (mean ⫾ SEM). Shaded areas indicate the prestimulus (PRE) and poststimulus (POST) time windows used in the gamma range. the decision variable per se, whose predicThick lines at the bottom indicate when alpha-band activity predicts the subsequent seen– unseen decision better than chance tive power on the following perceptual (black, p ⬍ 0.01; gray, p ⬍ 0.05). B, Extraction of the residual alpha-band variability. The residual prestimulus alpha-band choice should increase monotonically over variability did not predict the seen– unseen decision better than chance (***p ⬍ 0.001, **p ⬍ 0.01, *p ⬍ 0.05; ns, nonsignifi- time (Williams et al., 2003). In theory, this cant). Error bars indicate SEM. C, Fitted model. Top, Schematic view of the decision-making model. The prestimulus alpha-band nonpredictive time period could be remiactivity influences indirectly the subsequent model-based decision via its correlation with the poststimulus alpha-band activity niscent of the “nondecision time”—i.e., (w0 ⫽ 0). Strong alpha-band suppressions lead to seen decisions. Bottom, Model predictions regarding the predictive power A⬘. Thick horizontal lines correspond to the fitted values from the observed values for participants used to obtain estimates for w0 and the time before the accumulation process wdec. Center error bars indicate SEM. Side error bars indicate the discrepancy between model predictions and the observed values begins (Ratcliff, 1978). The existence of a nondecision time for stimulus encoding is for participants (model error). Model predictions matched the observed values. postulated in most decision-making models to account for the distribution of resubsequently presented visual stimuli, but yet correspond to two sponse times in simple perceptual tasks (Smith and Ratcliff, distinct mechanisms. Prestimulus correlates of consciousness in 2004). Interestingly, the nonpredictive time period observed here visual areas have mostly been related to attention-driven baseline corresponds approximately to the delay before gamma-band acshifts (Ress et al., 2000; Sylvester et al., 2007). We confirmed this tivity starts to reflect stimulus-specific processing in contralateral interpretation by reporting attentional suppressions of prestimuLO (Wyart and Tallon-Baudry, 2008). lus alpha-band signals in contralateral lateral occipital areas This temporal discontinuity of the predictive power suggests (Thut et al., 2006; Fries et al., 2008; Siegel et al., 2008; Wyart and that prestimulus and poststimulus gamma-band fluctuations in Tallon-Baudry, 2008) which predicted the outcome of the subseLO reflect qualitatively distinct sensory processes. While postquent seen– unseen decision (Linkenkaer-Hansen et al., 2004; stimulus gamma-band fluctuations are thought to reflect fluctuHanslmayr et al., 2007; Romei et al., 2008; van Dijk et al., 2008). ations of stimulus processing per se (Siegel et al., 2007), prestimuWe further show, as expected, that this attention-driven baseline lus gamma-band fluctuations might correspond to spontaneous shift affected visual awareness by modulating the amplitude of sensory predictions about the upcoming stimulus (Hesselmann the following alpha-band response to the near-threshold stimuet al., 2008a,b)— e.g., the preactivation of a sensory “template”— lus (Driver and Frith, 2000). In the same region but at higher independently from spatial attention. frequencies, we observed a distinct mechanism which also preThe perceptual impact of gamma-band activity in LO on the dicted perceptual awareness. Although gamma-band fluctuaseen– unseen decision fits a general perceptual decision-making tions were not significantly modulated by the focus of spatial framework (Smith and Ratcliff, 2004; Gold and Shadlen, 2007; attention, they nevertheless influenced the subsequent seen– unHeekeren et al., 2008) in which prestimulus and poststimulus seen decision in a spatially selective manner, and did so indepengamma-band fluctuations are integrated by the same accumula-
8724 • J. Neurosci., July 8, 2009 • 29(27):8715– 8725
tion process into a single decision variable. However, our results only suggest (rather than demonstrate) the existence of an accumulation of sensory evidence over time. We do not know whether this accumulation process maps onto a single brain area, such as the intraparietal cortex (Williams et al., 2003; Tosoni et al., 2008), or onto a mosaic of processes and regions (Heekeren et al., 2004; Philiastides and Sajda, 2007). Furthermore, the decision bias observed here in LO appears distinct from previously described decision priors based on stimulus or reward expectations (Platt and Glimcher, 1999; Yang and Shadlen, 2007). Indeed, such probabilistic priors have been found at the decision level in frontoparietal regions. Here, in contrast, the observed decision bias arises from ongoing fluctuations at the sensory level in retinotopic visual areas. The two types of prestimulus effects reported here—the attention-driven baseline shift in the alpha range and the decision bias in the gamma range— both predict perceptual awareness, but as distinct contributions to the same decision process. Curiously, the search for the neural correlates of consciousness only occasionally considers explicitly the perceptual decision-making framework as a useful model of how subjective judgments might be implemented in the brain (Ress et al., 2000; Supe`r et al., 2001; Williams et al., 2003; Hesselmann et al., 2008a,b). However, our results highlight the qualitative distinction between attentional and decision mechanisms of consciousness. Adopting this distinction not only accounts for the present results, but also sheds light on previous findings. First, the seen– unseen report used to probe visual awareness in laboratory experiments is known to be intrinsically influenced by other cognitive functions, such as attention and working memory (Lamme, 2006). This complexity could potentially be teased apart by considering subjective reports as the outcome of a single decision process which integrates independent sensory variables, that might be differentially influenced by awareness, attention and working memory. Second, neural correlates of visual consciousness have previously been found both in occipital (Supe`r et al., 2001; Ress and Heeger, 2003; Wilke et al., 2006; Wyart and Tallon-Baudry, 2008) and frontoparietal regions (Dehaene et al., 2001; Shulman et al., 2001; Sergent et al., 2005). The present results suggest that the relevant perceptual information available in visual areas is gradually integrated over time into a decision variable that might map onto frontoparietal regions (de Lafuente and Romo, 2006; Goldberg et al., 2006). From this decision-making perspective, occipital and frontoparietal correlates of visual consciousness thus correspond to distinct parts of the same decision process, with different temporal dynamics and different top-down influences from other cognitive functions (Gilbert and Sigman, 2007). Finally, our results suggest that visual awareness critically depends on the accumulation of sensory information in visual areas over time. In that sense, the corresponding decision variable therefore constitutes a neuronal “trace” of the recent sensory past, interpreted according to ongoing expectations and task goals. Such a mnesic trace could potentially explain the perceived continuity of visual consciousness—i.e., its link with a form of brief sensory memory (Atkinson et al., 2000; Baars and Franklin, 2003). More generally, the accumulation of noisy sensory information in visual areas over time provides a generic mechanism that could account for the perceptual stability of conscious visual experience.
References Atkinson AP, Thomas MS, Cleeremans A (2000) Consciousness: mapping the theoretical landscape. Trends Cogn Sci 4:372–382.
Wyart and Tallon-Baudry • Baseline Shift versus Decision Bias Baars BJ, Franklin S (2003) How conscious experience and working memory interact. Trends Cogn Sci 7:166 –172. Brainard DH (1997) The psychophysics toolbox. Spat Vis 10:433– 436. Dehaene S, Naccache L, Cohen L, Bihan DL, Mangin JF, Poline JB, Rivie`re D (2001) Cerebral mechanisms of word masking and unconscious repetition priming. Nat Neurosci 4:752–758. de Lafuente V, Romo R (2006) Neural correlate of subjective sensory experience gradually builds up across cortical areas. Proc Natl Acad Sci U S A 103:14266 –14271. Driver J, Frith C (2000) Shifting baselines in attention research. Nat Rev Neurosci 1:147–148. Fries P, Womelsdorf T, Oostenveld R, Desimone R (2008) The effects of visual stimulation and selective visual attention on rhythmic neuronal synchronization in macaque area V4. J Neurosci 28:4823– 4835. Gilbert CD, Sigman M (2007) Brain states: top-down influences in sensory processing. Neuron 54:677– 696. Gold JI, Shadlen MN (2007) The neural basis of decision making. Annu Rev Neurosci 30:535–574. Goldberg II, Harel M, Malach R (2006) When the brain loses its self: prefrontal inactivation during sensorimotor processing. Neuron 50:329 –339. Green DM, Swets JA (1966) Signal detection theory and psychophysics. New York: Wiley. Gross J, Kujala J, Hamalainen M, Timmermann L, Schnitzler A, Salmelin R (2001) Dynamic imaging of coherent sources: studying neural interactions in the human brain. Proc Natl Acad Sci U S A 98:694 – 699. Hanslmayr S, Aslan A, Staudigl T, Klimesch W, Herrmann CS, Ba¨uml KH (2007) Prestimulus oscillations predict visual perception performance between and within subjects. Neuroimage 37:1465–1473. Heekeren HR, Marrett S, Bandettini PA, Ungerleider LG (2004) A general mechanism for perceptual decision-making in the human brain. Nature 431:859 – 862. Heekeren HR, Marrett S, Ungerleider LG (2008) The neural systems that mediate human perceptual decision making. Nat Rev Neurosci 9:467– 479. Hesselmann G, Kell CA, Kleinschmidt A (2008a) Ongoing activity fluctuations in hMT⫹ bias the perception of coherent visual motion. J Neurosci 28:14481–14485. Hesselmann G, Kell CA, Eger E, Kleinschmidt A (2008b) Spontaneous local variations in ongoing neural activity bias perceptual decisions. Proc Natl Acad Sci U S A 105:10984 –10989. Kass RE, Raftery A (1995) Bayes factors. J Am Stat Assoc 90:773–795. Kastner S, Pinsk MA, De Weerd P, Desimone R, Ungerleider LG (1999) Increased activity in human visual cortex during directed attention in the absence of visual stimulation. Neuron 22:751–761. Lamme VA (2006) Towards a true neural stance on consciousness. Trends Cogn Sci 10:494 –501. Linkenkaer-Hansen K, Nikulin VV, Palva S, Ilmoniemi RJ, Palva JM (2004) Prestimulus oscillations enhance psychophysical performance in humans. J Neurosci 24:10186 –10190. Macmillan NA, Creelman CD (2005) Detection theory: a user’s guide, Ed 2. London: Erlbaum. Pashler H, Johnston JC, Ruthruff E (2001) Attention and performance. Annu Rev Psychol 52:629 – 651. Pelli DG (1997) The VideoToolbox software for visual psychophysics: transforming numbers into movies. Spat Vis 10:437– 442. Philiastides MG, Sajda P (2007) EEG-informed fMRI reveals spatiotemporal characteristics of perceptual decision making. J Neurosci 27:13082–13091. Platt ML, Glimcher PW (1999) Neural correlates of decision variables in parietal cortex. Nature 400:233–238. Posner MI, Snyder CR, Davidson BJ (1980) Attention and the detection of signals. J Exp Psychol 109:160 –174. Ratcliff R (1978) A theory of memory retrieval. Psychol Rev 85:59 –108. Ress D, Heeger DJ (2003) Neuronal correlates of perception in early visual cortex. Nat Neurosci 6:414 – 420. Ress D, Backus BT, Heeger DJ (2000) Activity in primary visual cortex predicts performance in a visual detection task. Nat Neurosci 3:940 –945. Romei V, Brodbeck V, Michel C, Amedi A, Pascual-Leone A, Thut G (2008) Spontaneous fluctuations in posterior alpha-band EEG activity reflect variability in excitability of human visual areas. Cereb Cortex 18:2010 –2018.
Wyart and Tallon-Baudry • Baseline Shift versus Decision Bias Sapir A, d’Avossa G, McAvoy M, Shulman GL, Corbetta M (2005) Brain signals for spatial attention predict performance in a motion discrimination task. Proc Natl Acad Sci U S A 102:17810 –17815. Sergent C, Baillet S, Dehaene S (2005) Timing of the brain events underlying access to consciousness during the attentional blink. Nat Neurosci 8:1391–1400. Shulman GL, Ollinger JM, Linenweber M, Petersen SE, Corbetta M (2001) Multiple neural correlates of detection in the human brain. Proc Natl Acad Sci U S A 98:313–318. Siegel M, Donner TH, Oostenveld R, Fries P, Engel AK (2007) Highfrequency activity in human visual cortex is modulated by visual motion strength. Cereb Cortex 17:732–741. Siegel M, Donner TH, Oostenveld R, Fries P, Engel AK (2008) Neuronal synchronization along the dorsal pathway reflects the focus of spatial attention. Neuron 60:709 –719. Smith PL, Ratcliff R (2004) Psychology and neurobiology of simple decisions. Trends Neurosci 27:161–168. Supe`r H, Spekreijse H, Lamme VA (2001) Two distinct modes of sensory processing observed in monkey primary visual cortex (V1). Nat Neurosci 4:304 –310. Sylvester CM, Shulman GL, Jack AI, Corbetta M (2007) Asymmetry of anticipatory activity in visual cortex predicts the locus of attention and perception. J Neurosci 27:14424 –14433.
J. Neurosci., July 8, 2009 • 29(27):8715– 8725 • 8725 Thut G, Nietzel A, Brandt SA, Pascual-Leone A (2006) Alpha-band electroencephalographic activity over occipital cortex indexes visuospatial attention bias and predicts visual target detection. J Neurosci 26:9494 –9502. Tosoni A, Galati G, Romani GL, Corbetta M (2008) Sensory-motor mechanisms in human parietal cortex underlie arbitrary visual decisions. Nat Neurosci 11:1446 –1453. Tyler CW (1997) Colour bit-stealing to enhance the luminance resolution of digital displays on a single pixel basis. Spat Vis 10:369 –377. van Dijk H, Schoffelen JM, Oostenveld R, Jensen O (2008) Prestimulus oscillatory activity in the alpha band predicts visual discrimination ability. J Neurosci 28:1816 –1823. Wilke M, Logothetis NK, Leopold DA (2006) Local field potential reflects perceptual suppression in monkey visual cortex. Proc Natl Acad Sci U S A 103:17507–17512. Williams ZM, Elfar JC, Eskandar EN, Toth LJ, Assad JA (2003) Parietal activity and the perceived direction of ambiguous apparent motion. Nat Neurosci 6:616 – 623. Wyart V, Tallon-Baudry C (2008) Neural dissociation between visual awareness and spatial attention. J Neurosci 28:2667–2679. Yang T, Shadlen MN (2007) Probabilistic reasoning by neurons. Nature 447:1075–1080.