Particulars
UACS Code
1st Quarter
2nd Quarter
1
2
3
4
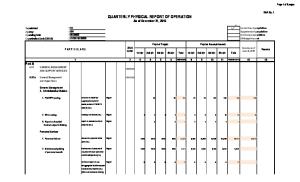
Part A I. Operations MFO 1: HIGHER EDUCATION SERVICES Quantity * Total number of graduates Quality * % of total graduates that are in priority courses * Ave. passing % of licensure exams by the SUC graduates/national ave. % passing across all disciplines covered by the SUC * % of programs accredited at: Level 1; Level 2; Level 3; Level 4
Timeliness * % of graduates who finished academic program according to the prescribed time frame
Physical Targets 3rd 4th Quarter Quarter 5
6
Total
1st Quarter
7=(3+4+5+6)
8
Physical Accomplishments 2nd 3rd 4th Quarter Quarter Quarter 9
10
11
Total
Variance as of 30 Sept 2014
Remarks
12=(8+9+10+11)
13
14
3 00 000000
1,238
310
1,548
1,265
1,265
-18.28%
100%
100%
100%
100%
100%
0.00%
140.65
140.65
10.71; 7.14; 42.86; 7.14
10.71; 7.14; 42.86; 7.14
10.71; 7.14; 42.86; 7.14
10.71; 7.14; 48.28; 0
10.71; 7.14; 48.28; 0
0; 0; 12.64; -1.0
75%
20.79%
95.79%
78.28%
78.28%
-18.28%
32
21
24
-54.72%
100%
100%
100%
0.00%
20; 0; 45.71; 0
0.00%
0.00
Target is for the 4th Quarter
MFO 2: ADVANCED EDUCATION SERVICES Quantity * Total number of graduates
53
24
Quality * % of total graduates that are in priority courses * % of programs accredited at: Level 1; Level 2; Level 3; Level 4
20; 0; 45.71; 0
100%
20; 0; 20; 0; 45.71; 0 45.71; 0
Page 1 of 5 CLSU BAR No. 1 as of 30 Sept 2014
100% 20; 0; 45.71; 0
Particulars
UACS Code
1st Quarter
2nd Quarter
1
2
3
4
Timeliness * % of graduates who finished academic program according to the prescribed timeframe MFO 3: RESEARCH SERVICES Quantity * Number of research studies completed in the last 3 years Quality * % of research projects completed in the last 3 years * % of research outputs published in a recognized journal or submitted for patenting or patented Timeliness * % of projects completed within the original project timeframe MFO 4: TECHNICAL ADVISORY EXTENSION SERVICES Quantity * Number of persons trained weighted by the length of training * Number of persons provided with technical advice Quality * % of trainees who rate the training course as good or better * % of clients who rate the advisory services as good or better Timeliness * % of requests for training responded to within 3 days of request * % of technical advice that are responded to within 3 days * % of persons who receive training or advisory services who rate timeliness of service delivery as good or better
Physical Targets 3rd 4th Quarter Quarter 5
6
50%
50%
120
39
80%
20%
20%
19.84%
50%
Total
1st Quarter
7=(3+4+5+6)
8
100%
159
Physical Accomplishments 2nd 3rd 4th Quarter Quarter Quarter 9
10
45.28%
131
11
Total
Variance as of 30 Sept 2014
Remarks
12=(8+9+10+11)
13
14
45.28%
-54.72%
131
-17.61%
100%
82.39%
82.39%
-17.61%
39.84%
24.22%
24.22%
-39.21%
50%
100%
54.76%
54.76%
-45.24%
12,488.75
-3.02%
6,000
3,438
3,439
12,877
644
516
450
1,610
974
7674
8,648.00
437%
97.12%
97.12%
97.12%
97.12%
90%
98.32%
94.16%
-3.05%
94.16%
94.16%
94.16%
94.16%
90%
91.67%
90.84%
-3.53%
95.58%
95.58%
95.58%
95.58%
90%
95.92%
92.96%
-2.74%
90.37%
90.37%
90.37%
90.37%
90%
90.72%
90.36%
-0.01%
95.23%
95.23%
95.23%
95.23%
90%
97.81%
93.91%
-1.39%
Page 2 of 5 CLSU BAR No. 1 as of 30 Sept 2014
6,274.25 6,214.50
Particulars
UACS Code
1st Quarter
2nd Quarter
1
2
3
4
II. Support to Operations * Number of management and employees oriented on ISO 9001:2008 QMS/GQMS
5
6
Total
1st Quarter
7=(3+4+5+6)
8
Physical Accomplishments 2nd 3rd 4th Quarter Quarter Quarter 9
10
11
100
150
Variance as of 30 Sept 2014
Remarks
12=(8+9+10+11)
13
14
314
-22.28%
154
404
110
204
25%
25%
50%
38.24%
17.20%
55.45%
10.89%
91.50%
91.50%
91.50%
92.33%
91.44%
92.06%
0.61%
360,938,677.00 392,079,200.00
-102,065,799.00
91.21%
-0.32%
329,196,890.00 360,938,677.00
-84,512,820.00 -91,203,083.00
100%
0.00%
1 00 000000
452,141,760.00 494,144,999.00
* Disbursements Budget Utilization Rate
91.50%
91.50%
91.50%
91.50%
90.53%
413,709,710.00 452,141,760.00
* Submission to COA of Financial Statements for FY 2013 (per PD 1445) * Submission to COA of Report on Ageing of Cash Advances (cut-off date November 15, 2014)
Total
2 00 000000
* Percentage of faculty and personnel enabled to pursua studies/training III. General Administration and Support Services (GASS) * Obligations Budget Utilization Rate
Physical Targets 3rd 4th Quarter Quarter
100%
100%
100%
100%
100%
100%
100%
100%
100%
100%
-91,203,083.00
0%
Cut-off date is November 15, 2014
Part B MAJOR PROGRAMS AND PROJECTS KRA No. 2 - POVERTY REDUCTION AND EMPOWERMENT OF THE POOR AND VULNERABLE * Student Grants-In-Aid Program for Poverty Alleviation (SGP-PA) IMPLEMENTATION OF THE PUBLIC HIGHER EDUCATION ROADMAP * Rationalize SUC Program Offerings
460
460
3
3
Page 3 of 5 CLSU BAR No. 1 as of 30 Sept 2014
438
438
0
-4.78%
The variance is due to grantees who dropped or have not enrolled
Target is for the 4th Quarter
Particulars
UACS Code
1st Quarter
2nd Quarter
1
2
3
4
Physical Targets 3rd 4th Quarter Quarter 5
6
PRIORITY GROWTH AREAS: INNOVATION CLUSTER * The use of radon in the monitoring of the Philippine fault and the valley fault system and its implication as an earthquake precursor
* Regional disaster science and management S & T capacity development
DAP-GRANTS-IN-AID FOR RESEARCH DEVELOPMENT AND EXTENSION * Production Technology for Sustained Productivity of Mango-Goat-Crop Mix Farming System: A Strategy for Adaptation and Mitigation of Climate Change
Total
1st Quarter
7=(3+4+5+6)
8
Physical Accomplishments 2nd 3rd 4th Quarter Quarter Quarter 9
10
11
Total
Variance as of 30 Sept 2014
Remarks
12=(8+9+10+11)
13
14
0
100%
100%
0
100%
100%
Progress Report and Financial Statements submitted to CHED and PCIERRD last February 2014; DOST and CHED provided budget for 2014. As per agreement during the renewal of the 2nd year implementatioin, DOST will give budget only for PNRI while CHED will provide the budget to CLSU. All requirements were already submitted to CHED for the release of funds but none has yet been released.
Progress Report and Financial Statements submitted to CHED. Project started in January 2013 and is scheduled to be completed on March 2014. However, due to the mandate by DOST, PhilVolcs Paintbrushing Tool of REDAS Software that would enable to compute the risk in each province for Region 3 specifically complete building damages, colapsed building damages, economic loss, fatalities, among others were added in the deliverables, which leads to three months extension.
40%
25%
25%
90%
40%
56%
96%
6.67%
* Development of Micro-Hydro Peripherals and Technology in the Philippines
40%
25%
25%
90%
40%
40%
80%
-11.11%
* Biotechnology for the Management of Growth and Health of Aquacultured Species
40%
25%
25%
90%
40%
58%
98%
8.89%
Page 4 of 5 CLSU BAR No. 1 as of 30 Sept 2014
Latest status report and financial statements submitted to CHED on June 2014
Particulars
UACS Code
1st Quarter
2nd Quarter
1
2
3
4
Physical Targets 3rd 4th Quarter Quarter 5
6
Total
1st Quarter
7=(3+4+5+6)
8
Physical Accomplishments 2nd 3rd 4th Quarter Quarter Quarter 9
10
11
Total
Variance as of 30 Sept 2014
Remarks 14
12=(8+9+10+11)
13
* Epidemiological Profiling and Risk Assessment of Ruminant diseases in Nueva Ecija for Animal Health Management
40%
25%
25%
90%
40%
28%
68%
-24.44%
* Genetic Conservation of Wild Toxic Plants with Pharmacological Potential
40%
25%
25%
90%
40%
54%
94%
4.44%
Prepared by:
In coordination with:
Approved by:
CHERYL G. RAMOS Planning Officer
EVELYN Y. HILARIO FMS Director
RUBEN C. SEVILLEJA SUC President IV
Date: 15 October 2014
Date: 15 October 2014
Date: 15 October 2014
Page 5 of 5 CLSU BAR No. 1 as of 30 Sept 2014