12 July 2018 Earnings Preview
BEM (BEM TB) Bangkok Expressway and Metro Current
Previous
Close
2018 TP
Exp Return
THAI CAC
CG 2017
BUY
BUY
7.75
10.00
29.0%
N/A
4
Consolidated earnings BT (mn)
2016
2017
2018E
2019E
Normalized earnings
2,575
3,123
3,709
4,093
Net profit
2,606
3,123
3,709
4,093
Normalized EPS (Bt)
0.17
0.20
0.24
0.27
EPS (Bt)
0.17
0.20
0.24
0.27
% growth
-1.7
19.9
18.8
10.3
Dividend (Bt)
0.1
0.1
0.2
0.2
BV/share (Bt)
1.9
2.0
2.1
2.2
EV/EBITDA (x)
20.1
19.5
17.7
16.9
Normalized PER (x)
46.0
37.9
31.9
28.9
PER (x)
45.5
37.9
31.9
28.9
PBV (x)
4.0
3.8
3.7
3.5
Dividend yield (%)
1.4
1.7
2.0
2.2
ROE (%)
8.7
10.0
11.5
12.2
15,285
15,285
15,285
15,285
1.0
1.0
1.0
1.0
YE No. of shares (million) Par (Bt)
Source: Company data, FSS estimates
Our forecast calls for BEM’s 2Q18 net profit to amount to Bt1bn (+40% Q-Q, +43% Y-Y), the first quarter to touch the Bt1bn level. Such sharp gains should be supported by an extra gain of Bt242mn from sales of XPCL shares to CKP. Excluding extra items, we expect the company’s normalized earnings to ease 2% Q-Q due to seasonality but jump 9% Y-Y thanks to a strong revenues gain in all of its three main businesses, and a rise in its associates' profit sharing. Looking ahead, we anticipate BEM’s 3Q18 normalized earnings will continue to increase Q-Q because there are only a small number of holidays. We stand by our forecast which calls for profits to amount to Bt3.7bn (+19% Y-Y) in 2018 and Bt4.1bn (+10% Y-Y) in 2019. What's more, there are upsides from auctions of three expressways and one train line; all of which are anticipated to happen this year. We like BEM. It’s a strong defensive counter against market volatility. In addition, the company’s revenues growth is strong over the long run. Specifically, we expect daily average ridership to significantly increase after the entire Blue Line is in operation in 2020. We retain our BUY rating on BEM at our TP of Bt10. Investment gain helps support 2Q18 profit to hit new high
Share data Sector
Transportation & Logistics
Close (11/07/2018) SET Index
7.75 1,636.63
Foreign limit/actual (%)
49.00/10.38
Paid up shares (million)
15,285.00
Free float (%)
53.75
Market cap (Bt m)
118,458.75
Avg daily T/O (Bt m) (2018 YTD) hi, lo, avg (Bt) (2018 YTD)
283.64 8.20, 7.00, 7.64
Source: Setsmarts SET Index
Price (Bt)
2,050.00
10.50
1,900.00
9.75
1,750.00
9.00
1,600.00
8.25
1,450.00
7.50
1,300.00
6.75
1,150.00
6.00
1,000.00
5.25 SET
850.00
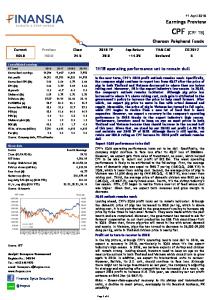
Expect 2Q18 net profit to hit new high
BEM
3.75
Jan-16 Jan-16 Feb-16 Mar-16 Mar-16 Apr-16 May-16 Jun-16 Jun-16 Jul-16 Aug-16 Aug-16 Sep-16 Oct-16 Oct-16 Nov-16 Dec-16 Dec-16 Jan-17 Feb-17 Feb-17 Mar-17 Apr-17 May-17 May-17 Jun-17 Jun-17 Jul-17 Aug-17 Sep-17 Sep-17 Oct-17 Nov-17 Nov-17 Dec-17 Jan-18 Jan-18 Feb-18 Mar-18 Mar-18 Apr-18 May-18 Jun-18 Jun-18 Jul-18
700.00
4.50
Source: SET
Analyst: Jitra Amornthum Register No.: 014530 Assistant Analyst : Thanyatorn Songwutti Tel.: +662 646 9966 www.fnsyrus.com
Finansia Syrus Securities @fnsyrus
Our forecast calls for BEM’s 2Q18 net profit to amount to Bt1bn (+40% Q-Q, +43% Y-Y) thanks to an extra after-tax gain of Bt242mn from sales of XPCL shares to CKP. Excluding extra items, the company’s normalized earnings are equal to Bt788mn (-2% Q-Q, +9% Y-Y). The modest Q-Q decrease is likely to be attributed to long holidays, which beats benefits from the refinance of debts for Sri-Rat Outer Ring Road Expressway in 1Q18. Specifically, we expect such refinance to make interest expense decrease by about Bt25mn a quarter or by 5% Q-Q in 2Q18. The sharp Y-Y gain is likely to be made possible by revenues which are anticipated to increase 2.5% Y-Y to Bt3.8bn. To elaborate, we predict revenues from its mass transit unit to increase 4% Y-Y, assuming that daily ridership was up by 5.5% Y-Y to 296,000 trips after the connection of the Purple and the Blue Lines. Revenues from expressway are expected to organically up 2% Y-Y, while revenues from its commercial development unit are anticipated to increase 5% Y-Y. What’s more, we forecast profit sharing from associates, i.e. CKP and TTW, to increase 7% Y-Y. Delay in fare hike and early launch of Blue Line’s extensions do not affect estimate BEM has postponed a fare hike on the Blue Line by Bt1 at the 5th, 8th and 11th station by three months from July 3 to October 3, 2018 to support the government’s policy to ease consumer burden. We believe that such delay does not have any impact on our estimate, and stand by our forecast which calls for 2018 average fare to increase by 2% Y-Y to Bt25.6 after average fare in 6M18 stood at Bt25.3. We view that such rise will benefit 2019 when it has a full-year effect. Meanwhile, BEM has asked CK to expedite construction of the Blue Line’s extensions so that they can begin service sooner. Such requests include the followings. 1. Hua Lamphong – Luk Song contract to be shortened by one month to August 14, 2019 (from September 2019) 2. Tao Poon – Sirinthorn contract to be shortened by three months to December 25, 2019 (from March 2020) 3. Sirinthorn – Tha Pra contract to be shortened to March 2, 2020 (from within March 2020)
Page 1 of 6
BEM (BEM TB) We have a positive view about such requests because BEM will be able to start service of a number of stations by 1-3 months sooner than planned, while maintaining its original schedule to open service for the entire Blue Line, totaling 38 stations and 47 kilometers in length, in March 2020. Once completed, we expect it to help support daily average ridership to increase from 300,000 trips to 500,000 trips and average fare to increase in line with the number of stations. Maintain BUY rating at TP of Bt10 We like BEM. It’s a strong defensive counter against market volatility. Moreover, the company’s revenues growth is strong over the long run thanks to daily average ridership and traffic which continue to increase. Looking ahead, there are upsides from auctions of expressways and a number of train lines, comprising Bang Pa-in – Nakhon Ratchasima motorway and Bang Yai – Kanchanburi motorway (whose bid envelope is expected in 3Q18), Pharam 3 – Dao Khanong expressway (whose bid envelope is anticipated this year), the South Purple Line (whose auction is expected in 4Q18), and the Orange Line (whose auction is anticipated in 1H19). In its latest move, BEM has purchased a bid envelope for the high-speed train to connect three airports, a project which is valued at Bt200bn. In this regard, we believe that BEM will partner with CK, its holding company, and participate in an auction on November 12, 2018. Given all that, we retain our BUY rating on BEM at our 2018 TP of Bt10. Risks: A delay in service commencement, a lower-than-expected ridership at the Blue Line’s extensions, a delay in auctions for motorway and train lines, a failure to get a renewal for the 2nd stage expressway system 2Q18E Earnings Preview (Bt mn)
2Q18E
1Q18
%Q-Q
Revenue
3,799
3,886
-2.2
3,705
2.5
Costs
2,314
2,363
-2.1
2,277
1.6
Gross profit
1,485
1,523
-2.5
1,428
4.0
SG&A costs
291
296
-1.7
284
2.4
Interest charge
458
482
-5.0
380
20.4
Norm profit
2Q17
%Y-Y
788
806
-2.2
723
9.1
1,030
736
40.0
723
42.6
Gross margin (%)
39.1
39.2
-0.1
38.5
0.5
Norm earnings margin (%)
20.7
20.8
0.0
19.5
1.2
Net profit margin (%)
27.1
18.9
8.2
19.5
7.6
Net profit
Source: FSS Research
Figure 1: Daily Average Traffic (thousand trips)
Source: BEM Monthly report
Page 2 of 6
BEM (BEM TB) Figure 2: Daily Average Ridership (thousand trips)
Source: BEM Monthly report
Figure 3: Blue Line Extension
Source: BEM Presentation
Page 3 of 6
BEM (BEM TB) Income Statement (Consolidated)
Cash Flow Statement (Consolidated)
(Bt mn)
2015
2016
2017
2018E
2019E
(Bt mn)
2015
2016
2017
2018E
2019E
Revenue
11,738
13,104
15,153
16,489
18,237
Net profit
2,650
2,606
3,123
3,709
4,093
Cost of sales
7,094
8,247
9,206
9,376
10,514
Depreciation etc.
3,226
3,911
3,941
3,900
3,957
Gross profit
4,643
4,857
5,947
7,113
7,723
Change in working cap
18,940
-24,813
6,814
1,233
689
SG&A
1,115
1,131
1,144
1,286
1,422
Other adjustments
0
0
0
0
0
Operating profit
3,528
3,727
4,803
5,827
6,301
CFO
24,816
-18,297
13,879
8,843
8,739
Capital expenditure
-8,797
-4,601
-22,108
-3,838
-6,468
Others
-1,679
-625
-906
-779
0
-10,476
-5,226
-23,014
-4,617
-6,468
Other income
69
98
240
130
146
EBIT
4,059
4,591
5,449
6,412
6,939
EBITDA
7,285
8,502
9,390
10,312
10,896
Interest charge
1,934
1,446
1,611
1,766
1,813
Free cash flow
14,340
-23,523
-9,136
4,226
2,271
Tax on income
721
563
696
929
1,025
Net borrowings
-12,505
21,770
12,712
-1,738
268
1,403
2,582
3,142
3,717
4,101
Equity capital raised
-12,915
0
0
0
0
51
7
19
7
8
-1,925
-1,834
-1,834
-2,596
-2,865
Normalized earnings
1,352
2,575
3,123
3,709
4,093
Extraordinary items
1,298
31
0
0
0
Net profit
2,650
2,606
3,123
3,709
4,093
Earnings after tax Minority interest
Balance Sheet (Consolidated)
CFI
Dividends paid Others CFF Net change in cash
-119
108
7
8
19,817
10,986
-4,327
-2,589
2,106
-3,706
1,850
-101
-318
Important Ratios (Consolidated)
(Bt mn)
2015
2016
2017
2018E
2019E
Cash
4,483
777
2,627
2,526
2,208
Growth (%)
Current investment
497
5,941
1,449
1,449
1,449
Revenue
Accounts receivable
649
2,371
2,076
1,538
1,551
EBITDA
Other current asset
240
130
128
128
128
Net profit
Total current assets
15,112 -12,233
2016
2017
2018E
2019E
4.5
11.6
15.6
8.8
10.6
-2.9
16.7
10.4
9.8
5.7
-3.5
-1.7
19.9
18.8
10.3
-38.8
90.4
21.3
18.8
10.3
5,869
9,219
6,280
5,641
5,336
Investment
10,870
11,026
11,367
11,367
11,367
Profitability (%)
PPE
59,085
60,500
66,150
67,497
71,415
Gross profit margin
39.6
37.1
39.2
43.1
42.3
2,296
2,040
15,122
14,492
13,085
EBITDA margin
62.1
64.9
62.0
62.5
59.7
82,786
98,919
98,997
101,202
EBIT margin
34.6
35.0
36.0
38.9
38.0
Other assets Total Assets
78,120
Normalized earnings
2015
Short-term loans
22,410
4,716
3,629
3,500
4,000
Norm profit margin
11.5
19.6
20.6
22.5
22.4
Account payable
2,580
819
2,108
3,409
3,823
Net profit margin
22.6
19.9
20.6
22.5
22.4
Current maturities
1,619
3,567
5,409
4,954
4,698
Normalized ROA
1.8
3.2
3.3
3.7
4.1
Other current liabilities
707
456
437
415
459
Normalize ROE
4.9
8.7
10.1
11.7
12.4
Total current liabilities
27,315
9,558
11,583
12,278
12,980
Normalized ROCE
6.2
7.4
7.9
8.4
8.7
Long-term debt
21,421
42,956
55,436
53,915
54,183
Risk (x)
Other LT liabilities
254
489
721
504
504
D/E
1.68
1.78
2.03
2.17
2.06
Total non-cu
21,675
43,445
56,157
54,419
54,687
Net D/E
1.35
1.57
1.81
1.70
1.67
Total liabilities
48,990
53,003
67,740
66,697
67,667
Net debt/EBITDA
5.40
5.52
6.01
5.32
5.14
Registered capital
15,285
15,285
15,285
15,285
15,285
Per share data (Bt)
Paid-up capital
15,285
15,285
15,285
15,285
15,285
Reported EPS
0.17
0.17
0.20
0.24
0.27
Share Premium
5,817
5,817
5,817
5,817
5,817
Normalized EPS
0.09
0.17
0.20
0.24
0.27
800
929
1,077
1,263
1,468
EBITDA
0.48
0.56
0.61
0.67
0.71
7,254
7,764
8,948
9,876
10,899
Book value
1.91
1.95
2.04
2.11
2.19
-113
-105
-60
-60
-60
Dividend
0.07
0.11
0.13
0.15
0.17
86
93
111
119
127
Par
1.00
1.00
1.00
1.00
1.00
29,130
29,783
31,179
32,299
33,535
P/E
44.7
45.5
37.9
31.9
28.9
Norm P/E
87.6
46.0
37.9
31.9
28.9
4.1
4.0
3.8
3.7
3.5
22.4
20.1
19.5
17.7
16.9
0.9
1.4
1.7
2.0
2.2
Legal reserve Retained earnings Others Minority Interest Shareholders' equity
Source: Company data, FSS research
Valuations (x)
P/BV EV/EBITDA Dividend yield (%)
Page 4 of 6
Finansia Syrus Securities Public Company Limited Head Office
Thaisummit Tower
Alma Link
Amarin Tower
Central Pinklao 1
999/9 The offices at Central World 18th, 25th Fl., Rama 1 Rd., Patumwan, Bangkok
1768 Thaisammit Tower Building, 5th, 31th Fl., New Petchburi Road, Bangkapi, Huaykwang, Bangkok
9th, 14th, 15th Fl., Alma Link Building 25 Soi Chidlom, Ploenchit, Lumpini, Patumwan, Bangkok
496-502 Amarin Tower 20th Floor, Pleonchit, Lumpini, Pathumwan, Bangkok
7/129-221 Central Pinklao Office Building, Room 2160/1, 16th Fl., Baromratchonnanee Road, Arunamarin, Bangkoknoi, Bangkok
Bangkapi
Bangna
Sindhorn 1
Kian Gwan (Sindhorn 2)
Sindhorn 3
3105 N Mark Building, 3rd Floor, Room A3R02, Ladprao Road, Klongjan, Bangkapi, Bangkok
589 Tower 1 Office, 19th Floor, Room 589/105 Moo 12, Bangna-Trad Road, Bangna, Bangkok
130-132 Sindhorn Building 1, 2rd Floor, Wireless Road, Lumpini, Pathumwan, Bangkok
140/1 Kian Gwan House II 18th Floor, Wireless Road, Lumpini, Pathumwan, Bangkok
130-132 Sindhorn Building 3, 19th Floor, Wireless Road, Lumpini, Pathumwan, Bangkok
Ladprao
Prachachuen
Rang sit
Abdulrahim
Rattanatibet
555 Rasa Tower 2, 11st Floor, Unit 1106, Phaholyothin Road, Chatuchak, Bangkok
105/1 B Building, 4th Floor, Thessabansongkhrao Road, Ladyao, Jutujak, Bangkok
1/832 Moo 17 Kukod, Lumlookka Pratumtanee
990, Abdulrahim Place, 12nd Fl., Room 1210, Rama IV Road, Silom, Bangrak, Bangkok
576 Rattanatibet Road, Tumbon Banggrasor, Aumphoe Muang, Nonthaburi
Sriracha
Khonkaen 1
Khonkaen 2
Khonkaen 3
Udonthani
135/99 (G fl.) Sukumvit Road, Tumbon Sriracha Aumphoe Sriracha, Chonburi
311/16 2nd Floor, Klangmeung Road, Tumbon Nai Meung, Aumphoe Meung, Khonkaen
26/9 Moo 7, 2nd Floor Sri Chant Mai Road, Tumbon Nai Meung, Aumphoe Meung Khonkaen, Khonkaen
311/1 Khang Meung Road, Tumbon Nai Meung, Aumphoe Meung Khonkaen, Khonkaen
197/29, 213/3 Udon Dusadee Road, Tumbon Mak Khaeng, Aumphoe Muang Udon Thani, Udon Thani
Chiangmai 1
Chiangmai 2
Chiangmai 3
Chiangrai
Measai
308 Chiang Mai Land,
310 Chiang Mai Land,
Maliplace Building 32/4 moo 2
Chang Klan R., Chang Klan
Chang Klan R., Chang Klan
1 fll., Room B1-1, B1-2
Muang Chiangmai
Muang Chiangmai
Tumbon Maehia Chiangmai
353/15 Moo 4, Tumbon Rimkok Aumphoe Muang, Cheangrai
119 Moo 10, Tumbon Maesai, Aumphoe Muang, Cheangrai
Nakornratchasima
Samutsakorn
Phuket
Hatyai 1
Hatyai 2
1242/2 Room A3, 7 fl., The Mall Ratchasima
813/30 Norrasing Road, Tumbon Maha Chai, Aumphoe Meungsamutsakorn, Samutsakorn
22/18 Luangporwatchalong Road, Tumbon Talad Yai, Amphoe Muang Phuket, Phuket
200/221, 200/223 Juldis Hadyai Plaza, 2rd Floor, Building, Niphat Uthit 3 Road, Aumphoe Hadyai, Songkhla
106 Prachathipat Road, Aumphoe Hadyai, Songkhla
Hatyai 3
Trang
Suratthani
Pattane
200/222, 200/224, 200/226 Juldis Hadyai Plaza, 2rd Floor, Building, Niphat Uthit 3 Road, Aumphoe Hadyai, Songkhla
59/28 Huaiyod Road, Tumbon Thaptieng, Aumphoe Meungtrang, Trang
173/83-84 Moo 1 Watpho-Bangyai Road., Tumbon Makamtia, Aumphoe Mueang, Suratthani
300/69-70 Moo 4, Tumbon Rusamirae, Aumphoe Meung, Pattane
Mittraphap rood Tumbon Nai Muang Aumphoe Muang Nakornratchasima
Nakornratchasima
Recommendation Definitions BUY HOLD SELL TRADING BUY OVERWEIGHT NEUTRAL UNDERWEIGHT
The The The The The The The
latest close is below our target price and the estimated upside is 10% or more. latest close is below our target price and the estimated upside is 0-10%. latest close is above our target price. latest close is above our target price but the price is expected to be driven by short-term positive factors estimated return is higher than the market average. estimated return is the same as the market average. estimated return is lower than the market average
Note: The expected return may change as market risks increase or decline. DISCLAIMER: This report has been prepared by Finansia Syrus Securities Public Company Limited (FSS). The information herein has been obtained from sources believed to be reliable and accurate; however FSS makes no representation as to the accuracy and completeness of such information. Information and opinions expressed herein are subject to change without notice. FSS has no intention to solicit investors to buy or sell any security in this report. In addition, FSS does not guarantee returns nor price of the securities described in the report nor accept any liability for any loss or damage of any kind arising out of the use of such information or opinions in this report. Investors should study this report carefully in making investment decisions. All rights are reserved. This report may not be reproduced, distributed or published by any person in any manner for any purpose without permission of FSS. Investment in securities has risks. Investors are advised to consider carefully before making investment decisions. Finansia Syrus Securities Public Company Limited may act as market maker and issuer of DWs. The company may prepare the research reports on those underlying securities. Investors should carefully read the details of the derivative warrants in the prospectus before making investment decisions.
Page 5 of 6
Thai Institute of Directors Association (IOD) – Corporate Governance Report Rating 2017
Sc ore Range
Rating
Desc ription
100-90
Excellent
80-89
Very Good
70-79
Good
60-69
Satisfactory
50-59
Pass
<50
no logo given
n/a
IOD (IOD Disclaimer) The Corporate Governance Report (CGR) of Thai listed Companies is based on a survey and assessment of information which companies listed on the Stock Exchange of Thailand and the Market for Alternative Investment (“listed companies”) disclose to the public. The CGR is a presentation of information from the perspective of outsiders on the standards of corporate governance of listed companies. It is not any assessment of the actual practices of the listed companies, and the CGR does not use any non-public information. The CGR is not therefore an endorsement of the practices of the listed companies. It is not a recommendation for investment in any securities of any listed companies or any recommendation whatsoever. Investors should exercise their own judgment to analyze and consider any information relating to the listed companies presented in this CGR report. No representation or warranty is made by the Institute of Directors or any of its personnel as to the completeness or accuracy of the CGR report or the information used.
---------------------------------------------------------------------------------------------------------------------------------------------------------------------------------------------
Thailand's Private Sector Collective Action Coalition Against Corruption programme (Thai CAC) 1 CG Score 2017 from Thai Institute of Directors Association (IOD) 2 Companies participating in Thailand's Private Sector Collective Action Coalition Against Corruption programme (Thai CAC) under Thai Institute of Directors (as of July 31, 2017) are categorised into: - companies that have declared their intention to join CAC, and - companies certified by CAC.
Page 6 of 6