BUY SUHANI ADILABADKAR RESEARCH REPORT Q1 FY18 BALKRISHNA INDUSTRIES LTD- STANDALONE
CMP
Rs. 1704.20
TARGET
QUARTERLY OUTLOOK & RECOMMENDATION
BALKRISHNA Industries Ltd, India’s largest ‘Off Highway Tire Manufacturer’ reported mixed June quarter with Revenue & PAT rising 8% & 3% respectively YOY. PAT stood at Rs. 1531 Mn against Rs.1491 Mn corresponding period previous year. Revenue was seen at Rs. 10128 Mn rising 8% YOY and stood at Rs. 9420 Mn in Q1 FY17. Volume growth for the quarter stood at 7%. EBDITA declined 5% and was reported at Rs. 3085 Mn in Q1 FY18 against Rs. 3255 Mn corresponding quarter previous year. Profit Before tax was stagnant at Rs. 2278 Mn in the current June quarter. Other Income galloped three times YOY at Rs. 923 Mn against Rs. 344 Mn corresponding period previous year buttressing company’s bottom-line in the current quarter. EBDITA Margin declined 409 bp as operating expenditure jumped 22% YOY. Operating expenditure stood at Rs. 7966 Mn compared to Rs. 6510 Mn same quarter previous year. One basis point is 1/100th of a percentage. EBDITA & Net Profit Margin stood at 30.46% & 15.12% in the current June quarter. The company continued its deleveraging exercise and interest costs have been further pruned by 22% on yearly basis. Balkrishna Industries Ltd (BKT) is India’s leading global, ‘Off Highway Tire’ player catering to 130 countries through distribution network in Americas, Europe, India and Rest Of the World. BKT with market cap of Rs. 164711 Mn has more than 85% of its earnings dependent on exports. The company has performed in the backdrop of slow global growth and high currency fluctuations. In addition to that BKT is also focused on rationalizing its debt burden by utilizing its high cash holdings. The company has repaid long term debt of around Rs. 3760 Mn in Q1 FY18. Current cash holdings stand at Rs. 11350 Mn. We recommend BUY for the stock for medium & long term investment with PE multiple of 20.57 x FY18E & 18.18 x FY19E with a target price of Rs. 1920.
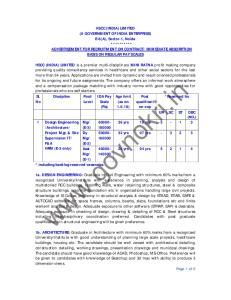
INDUSTRY
Rs.1920.00 Auto Tyres & Rubber Products
SCRIP CODE
502355
FACE VALUE
Rs. 2.00
MARKET Rs. 164711Mn CAP 52 WEEK Rs. 1760.00/Rs.815.05 HIGH/LOW SHAREHOLDING PATTERN (%) PROMOTER
54.37
PUBLIC
45.63
OTHERS TOTAL
In Mn
Q1 FY18
100.00 Q1 FY17 CHN%
REVENUE
10127.70
9420.10
8%
PAT
1531.40
1490.60
3%
EBDITA
3084.80
3254.50
-5%
15.84
15.42
3%
FY17A
FY18E
FY19E
REVENUE
37883.00
43565.45
48357.65
PAT
7151.40
8007.62
9058.96
EBDITA
13012.40
15314.59
16978.87
EPS
73.99
82.85
93.73
PE
23.03
20.57
18.18
EPS
In Mn
BALKRISHNA INDUSTRIES LTD V/S S&P BSE SENSEX
PERFORMANCE METRICS (June Quarter FY18) Profitability Analysis NET PROFIT GROWTH (Rs. In Mn)
EBDITA (Rs. In Mn)
3000 Q1 FY18 2500
Q4 FY17
1857
2000 1500
3085
2429
1491
1375
3171
1531 Q3 FY17
1000
3064
Q2 FY17
3523
500 Q1 FY17
0
Q1 FY17
Q2 FY17
Q3 FY17
Q4 FY17
Q1 FY18
Balkrishna Industries reported mixed June quarter with Profit After Tax or Net Profit rising 3% and EBDITA exhibiting de-growth of 5% YOY in the current June quarter. Net Profit or PAT stood at Rs. 1531 Mn against Rs. 1491 Mn corresponding quarter previous year. Sequential growth was also strong at 11% in Q1 FY18. Operating expenditure grew 22% YOY leading to negative EBDITA growth both yearly and sequentially. EBDITA stood at Rs. 3085 Mn in the current quarter declining 3% QOQ. Operating expenditure was reported at Rs. 7966 Mn against Rs. 6510 Mn same period previous year. Revenue stood at Rs. 10128 Mn growing 8% YOY and almost constant sequentially. Sales volume growth has been stagnant QOQ whereas on yearly basis, growth has been 7% at 46327 MT compared to 43306 MT corresponding period previous year. Other Income buffeted yearly bottom-line with almost 3 times growth and was reported at Rs. 923 Mn in Q1 FY18. Yearly numbers have been impacted by high operational cost due to higher cost of material which has grown 1.5 times on yearly basis. Profit Before Tax stood at Rs. 2278 Mn in Q1 FY18 which is almost constant compared to same period previous year.
3255
2800
3000
3200
3400
3600
REVENUE GROWTH (Rs. In Mn)
10200
10029
10128
10000 9800 9600
9420
9465
9400 9200
8968
9000 8800 8600 8400 8200 Q1 FY17
Q2 FY17
Q3 FY17
Q4 FY17
Q1 FY18
OTHER INCOME (Rs. In Mn)
NET PROFIT MARGIN 30.00%
Q1 FY18
923
Q4 FY17
20.71%
617
Q3 FY17
25.66% 25.00% 20.00%
15.00%
285
15.12%
15.82%
13.71% Q2 FY17
10.00%
448
5.00%
Q1 FY17
344
0.00% 0
500
Q1 FY17
1000
Q2 FY17
Q3 FY17
Q4 FY17
Q1 FY18
Expenditure Analysis
Rs. In Mn Cost of Materials
Q1 FY18
Q1 FY17
CHG%
5512.50
3714.80
48.39%
COST OF MATERIAL (Rs. In Mn) 5513
6000 4457
5000 Stock In trade
20.30
11.70
73.50%
4000
3715
3805
3753
3000
Employee Benefit Expenses
587.40
545.50
7.68%
Depreciation & Amortization
755.00
774.70
-2.54%
Other Expenses
2146.70
2000 1000 0
2118.60
1.33%
Q1 FY17
Q2 FY17
Q3 FY17
Q4 FY17
Q1 FY18
Cost of Material is the major constituent of total operating expenditure for BKT accounting for about 61%. YOY cost of material increased 48% whereas on quarterly basis, jump was 24%. Other expenses constitute the next biggest chunk 24% of operating expenditure, rising by just 1.33% YOY whereas QOQ decline was 1%. Stock in trade jumped 73% YOY in the current June quarter though it contributes negligibly to total operating expenditure. Employee Benefit expenditure rose 8% YOY in the current June quarter and declined 1% sequentially. Balkrishna Industries imports most of its raw material i.e natural rubber and thus international rubber prices and crude volatility impacts operational cost of the company.
DEPRECIATION (Rs. In Mn) 70
788
790 780
INTEREST EXPENSE (Rs. In Mn)
775
66
60
770 760
751
755
750
50
47
49
53
51
40
740 30
725
730 720
20
710 10
700 690
Q1 FY17
Q2 FY17
Q3 FY17
Q4 FY17
Q1 FY18
TAXATION EXPENSE (Rs. In Mn) 1200 993
1000 800
909 786
718
747
600 400 200 0 Q1 FY17 Q2 FY17 Q3 FY17 Q4 FY17 Q1 FY18
0 Q1 FY17 Q2 FY17 Q3 FY17 Q4 FY17 Q1 FY18
EBDITA margin in the current quarter stood at 30.46% against 34.55% corresponding quarter previous year declining considerable by 409 basis points. Sequential loss has been lower by 116 basis points and EBDITA margin stood at 31.62% in previous March quarter. Operational expenses rising by 22% YOY has dented EBDITA margins. Revenue increased at 8% YOY whereas Operating expenditure galloped 22% leading to lower yearly margins. On quarterly basis operational expenditure declined 3% but Revenue halted at just 1% growth QOQ. Depreciation was almost constant sequentially whereas YOY decline was at 3%. Interest expenses accounted for about 4% of PAT in the current June quarter declining 2% sequentially. On absolute basis, fall in interest
expenses YOY was about Rs.15 Mn or 22% YOY improving bottom-line of the company in Q1 FY18. Current Long Term Debt stands at Rs. 4340 Mn and cash holding in the current quarter are reported at Rs. 11350 Mn. The company is expected to repay USD 33 Mn in August 2017. Taxation expenditure accounted 10% of total revenue in current quarter and on yearly terms fell 5% from Rs. 786 Mn to Rs. 747 Mn in the current June quarter. On quarterly basis, Taxation expenditure declined 25%. Net Profit Margin jumped expanded 141 basis points QOQ in the current June quarter whereas on yearly basis decline was 70 basis points. Total expenditure including finance costs and taxation grew 17% YOY and was 95% of total revenue against 81% corresponding quarter previous year.
Revenue Analysis Balakrishna Industries Ltd manufactures ‘Off-Highway’ tyres and are broadly classified into agriculture, industrial and OTR. Agricultural segment caters to agriculture machinery & vehicles such as Tractors, ATV, Forwarder, Harvester, Baler, Implement Machinery, Spreader, Tedder to name a few. Industrial segment provides tyres for Machinery such as Container Holder, Compactor, Excavator, Forklift, Grader etc. OTR segment provides tyres for machinery such as Haul Truck, Loader, Haul Train, Dozer etc. More than 85% of the revenues are earned through exports. The company enjoys the status of “Four Star Export House’. Bhuj plant has been completed and increased production from all plants has led to BKT giving a volume guidance of 185000 MT -190000 MT for the year end 2018.
SALES (In MT) 46149
48000 46000
43306
44000
46327
42550 40415
42000 40000 38000 36000
Q1 FY17
Q2 FY17
Q3 FY17
Q4 FY17
Q1 FY18
Corporate Profile Headquartered in Mumbai, Balkrishna Industries Limited (BKT) is a leading manufacturer in the OffHighway tyre market. Since its founding in 1987, BKT has successfully focused on specialist segments such as agricultural, construction and industrial vehicles as well as earthmoving, port and mining, ATV, and gardening applications. As a result, BKT has developed into a global player in the Off-Highway tyre industry with a 6% market share and a sales volume of 850 million US dollars corresponding to a 30% increase over the last five years. Presently, the company has four subsidiaries in Europe and North America assisting its head office in sales and marketing activities: BKT Europe S.r.l. in Seregno, Italy, BKT Tires USA Inc. in Akron, Ohio, BKT Tires Canada Inc. in Toronto, and BKT Tires, Inc. in Brentwood, Tennessee. BKT sells its products in 130 countries worldwide through a network of national distributors. As a global specialty tyre supplier, its strength is the extensive Off-Highway tyre lineup of over 2,300 products. It is the key to its success, enabling the company to meet the application needs of both end users and vehicle manufacturers. The company’s five state-of-the-art production sites in Aurangabad, Bhiwadi, Chopanki, Dombivali and Bhuj employs more than 7,000 people.
Financial Analysis QUARTERLY PROFIT & LOSS STATEMENT OF BALKRISHNA INDUSTRIES LTD FROM 31st Dec 2016 TO 30th Sep 2017E VALUE
31-Dec-16
31-March-17
30-June-17
30-Sep-17E
Rs. In Million
3 months
3 months
3 months
3 months
INCOME FROM OPERATIONS
8968.20
10029.40
10127.70
10380.89
OTHER INCOME
284.70
617.20
922.70
1061.11
TOTAL INCOME
9252.90
10646.60
11050.40
11442.00
EXPENDITURE
-6188.50
-7475.70
-7965.60
-8124.91
EBDITA
3064.40
3170.90
3084.80
3317.09
DEPRECIATION
-787.90
-750.80
-755.00
-770.10
PROFIT BEFORE INTEREST & TAX
2276.50
2420.10
2329.80
2546.99
INTEREST
-49.00
-52.70
-51.40
-48.83
NET FOREIGN EX LOSS/GAIN
346.90
0.00
0.00
0.00
PROFIT BEFORE TAX
2574.40
2367.40
2278.40
2498.16
TAX
-717.50
-992.70
-747.00
-784.35
PROFIT AFTER TAX
1856.90
1374.70
1531.40
1713.81
EQUITY CAPITAL
193.30
193.30
193.30
193.30
FACE VALUE
2.00
2.00
2.00
2.00
EPS
19.21
14.22
15.84
17.73
ANNUAL PROFIT & LOSS STATEMENT OF BALKRISHNA INDUSTRIES LTD FROM 2016 TO 2019E VALUE
31- Mar-16
31- Mar-17
31- Mar-18E
31-Mar-19E
Rs. In Million
12 months
12 months
12 months
12 months
INCOME FROM OPERATIONS
32725.20
37883.00
43565.45
48357.65
OTHER INCOME
1489.60
1693.80
2032.56
2235.82
TOTAL INCOME
34214.80
39576.80
45598.01
50593.47
EXPENDITURE
-24343.80
-26564.40
-30283.42
-33614.59
EBDITA
9871.00
13012.40
15314.59
16978.87
DEPRECIATION
-2821.70
-3038.30
-3342.13
-3576.08
PROFIT BEFORE INTEREST & TAX
7049.30
9974.10
11972.46
13402.79
INTEREST
-394.70
-214.40
-218.69
-223.06
0.00
797.30
0.00
0.00
PROFIT BEFORE TAX
6654.60
10557.00
11753.78
13179.73
TAX
-2268.90
-3405.60
-3746.16
-4120.78
PROFIT AFTER TAX
4385.70
7151.40
8007.62
9058.96
EQUITY CAPITAL
193.30
193.30
193.30
193.30
27623.60
35292.30
40586.15
45456.48
FACE VALUE
2.00
2.00
2.00
2.00
EPS
45.38
73.99
82.85
93.73
NET FOREIGN EX LOSS/GAIN
RESERVES
Ratio Analysis YEAR
FY 16A
FY 17A
FY 18E
FY19E
45.38
73.99
82.85
93.73
NPM
13.40%
18.88%
18.38%
18.73%
EBDITA MAGIN
30.16%
34.35%
35.15%
35.11%
ROE
15.69%
20.15%
19.64%
19.84%
DEBT EQUITY
0.46
0.22
0.22
0.22
EV/EBDITA
17.28
12.88
10.99
9.90
BOOK VALUE
289.22
367.16
421.93
472.32
P/BV
5.89
4.64
4.04
3.61
PE
37.56
23.03
20.57
18.18
EPS
BALANCE SHEET OF BALKRISHNA INDUSTRIES LTD FROM 2016-2019E CAPITAL & LIABILITIES (Rs. In Mn) CAPITAL RESERVES & SURPLUS NETWORTH NON CURRENT LIABILITIES Borrowings Other Financial Liabilities Provisions Deferred Tax Liabilities Other Non Current Liabilities TOTAL NON CURRENT LIABILITIES CURRENT LIABILTIES Borrowings Trade Payables Other Financial Liabilities Other Current Liabilities Short Term Provisions TOTAL CURRENT LIABILITIES TOTAL EQUITY & LIABILITIES ASSETS (Rs. In Mn) NON CURRENT ASSETS Property, Plant & Equipment Capital Work In Progress Investment Property Other Intangible Assets Investments Other Financial Assets Income Tax Assets Other Non Current Assets TOTAL NON CURRENT ASSETS CURRENT ASSETS Inventories Investments Trade Receivables Cash & Cash Equivalents Bank Balances Loans Other Financial Assets Other Current Assets TOTAL CURRENT ASSETS TOTAL ASSETS
2016 193.30 27623.30 27816.60
2017 193.30 35292.30 35485.60
2018E 193.30 40586.15 40779.45
2019E 193.30 45456.48 45649.78
8307.60 0.10 59.00 2464.30 173.60 11004.60
2188.40 0.10 126.00 3528.80 150.70 5994.00
2243.11 0.10 153.72 4234.56 158.24 6789.73
2287.97 0.10 181.39 4869.74 161.40 7500.61
4413.40 3367.20
5484.60 3633.40
6581.52 3996.74
7766.19 4476.35
6531.80 617.50 63.90 14993.80 53815.00
6410.70 465.30 56.20 16050.20 57529.80
6731.24 474.61 59.01 17843.11 65412.28
7135.11 484.10 60.78 19922.53 73072.92
28540.60 2310.70 85.80 41.60 5778.30 278.80 563.30 735.30 38334.40
28369.40 1096.70 76.70 39.90 8881.90 402.10 721.70 848.20 40436.60
29220.48 1184.44 80.54 40.70 12878.76 522.73 866.04 949.98 45743.66
30097.10 1267.35 82.15 41.51 16098.44 653.41 1021.93 1025.98 50287.87
3877.10 2796.60 3803.40 3011.80 16.60 265.00 163.10 1547.00 15480.60 53815.00
4596.90 4589.80 4121.90 114.10 22.10 239.10 1754.30 1655.00 17093.30 57529.80
5130.10 5966.74 4328.00 125.51 24.31 251.06 2105.16 1737.75 19668.62 65412.28
6507.02 7160.09 4501.11 140.57 26.74 256.08 2420.93 1772.51 22785.05 73072.92
Industry- Current Scenario The Indian Tyre industry is dominated by commercial vehicle segment, passenger vehicles constituted by cars, SUV’s, motorcycles and scooters and Farm & Off The Road (OTR) segments consisting of the Tractor Front and Rear tyres. Tyres are classified mainly into cross-ply and radial based technology. In recent years, there has been growth in radialisation dominated mainly by passenger cars followed by commercial vehicles and light commercial vehicles. The tyre industry is directly dependent on the growth of vehicles or automobile industry which in turn depends on economic growth of any economy. Right now in India, government focus on infrastructure will give the required push to the Indian tyre industry. Indian Tyre market is divided into three main segments, Replacement, Original Equipment Manufacturer [OEM] and Exports. Major challenges faced by Indian tyre manufacturers are constant increase of Chinese imports, volatility in natural rubber prices and foreign currency fluctuation as most of the domestic players import raw material and export major chunk of their production. Major players in the Indian Tyre Industry are MRF, Balkrishna Industries, Ceat, Apollo Tyres, JK Tyres to name a few.
Comparative Analysis (Standalone) Q1 FY18
EPS (Rs)
REVENUE (Rs. In Mn)
PAT (Rs. In Mn)
EBDITA (Rs. In Mn)
MKT CAP (Rs. In Mn)
BALKRISHNA INDUSTRIES LTD
15.84
10127.70
1531.40
3084.80
164710.93
MRF LTD
251.19
39717.60
1065.30
3641.80
269382.80
CEAT LTD
4.73
16199.70
191.40
853.90
70603.60
APOLLO TYRE LTD
1.32
25633.48
671.25
2090.77
131073.90
SUHANI ADILABADKAR
[email protected] 9701063320
Disclaimer The information and opinions contained in the research reports have been compiled or arrived at from sources believed reliable but no representation or warranty, express or implied, is made as to their accuracy or completeness. The research report does not constitute a personal recommendation or take into account the particular investment objectives, financial situations, or needs of individual clients. Clients should consider whether any advice or recommendation in this research is suitable for their particular circumstances and, if appropriate, seek professional advice, including but not limited to tax advice. The reports do not take into account the particular investment objectives, financial situations, risk profile or needs of individual clients. The user assumes the entire risk of any use made of this information. This report is not to be relied upon in substitution for the exercise of independent judgment. The price and value of investments referred to in this research and the income from them may fluctuate. Past performance is not a guide to future performance, future returns are not guaranteed, and a loss of original capital may occur. Research data and reports published/ emailed/ text messaged via Short Messaging Services, Online Messengers, WhatsApp etc/transmitted through mobile application/s, including but not limited to FLIP™, Video Widget, telephony networks, print or electronic media and or those made available/uploaded on social networking sites (e.g. Facebook, Twitter, LinkedIn etc) is for informational purposes only. The reports are provided for assistance and are not intended to be and must not alone be taken as the basis for an investment decision. The user assumes the entire risk of any use made of this information. Though disseminated to clients simultaneously, not all clients may receive the reports at the same time. We will not treat recipients as clients by virtue of their receiving this report. The reports include projections, forecasts and other predictive statements which represent our assumptions and expectations in the light of currently available information. These projections and forecasts are based on industry trends, circumstances and factors which involve risks, variables and uncertainties. The actual performance of the companies represented in the report may vary from those projected. The opinions expressed in the reports are subject to change but we have no obligation to tell our clients when our opinions or recommendations change. The reports are non-inclusive and do not consider all the information that the recipients may consider material to investments. We shall not be in any way responsible for any indirect, special or consequential damages that may arise to any person from any inadvertent error in the information
contained in the reports nor do they take guarantee or assume liability for any omissions of the information contained therein. Information contained therein cannot be the basis for any claim, demand or cause of action. These data, reports and information do not constitute scientific publication and do not carry any evidentiary value whatsoever. The user should consult their own advisors to determine the merits and risks of investment and also read the Risk Disclosure Documents for Capital Markets and Derivative Segments as prescribed by Securities and Exchange Board of India before investing in the Indian Markets. The securities discussed in this report may not be suitable for all investors. Investors must make their own investment decision based on their own investment objectives, goals and financial position and based on their own analysis. Prospective investors and others are cautioned that any forward-looking statements, if any, are not predictions and may be subject to change without notice. This report may provide the addresses of, or contain hyperlinks to websites. Except to the extent to which the report refers to material we take no responsibility whatsoever for the contents therein. Such addresses or hyperlinks are provided solely for your convenience and information and the content of the linked site does not in any way form part of this report. Accessing such website or following such link through this report shall be at your own risk. The author of this Research Report accepts no liability and will not in any way be responsible for the contents of this report or for any losses, costs, expenses, charges, including notional losses/lost opportunities incurred by a recipient as a result of acting or non-acting on any information/material contained in the report. This is not an offer to sell or a solicitation to buy any securities or an attempt to influence the opinion or behavior of investors or recipients or provide any investment/tax advice. The securities described herein may or may not be eligible for sale in all jurisdictions or to certain category of investors. Persons in whose possession this document may come are required to inform themselves of and to observe such restriction.