Auxiliary Parameter MCMC for Exponential Random Graph Models* Maksym Byshkin1, Alex Stivala2, Antonietta Mira1, Rolf Krause1, Garry Robins2, Alessandro Lomi1,2 1
Università della Svizzera italiana, Lugano, Switzerland
2
University of Melbourne, Australia
Maksym Byshkin
[email protected] Alessandro Lomi
[email protected]
Abstract Exponential random graph models (ERGMs) are a well-established family of statistical models for analyzing social networks. Computational complexity has so far limited the appeal of ERGMs for the analysis of large social networks. Efficient computational methods are highly desirable in order to extend the empirical scope of ERGMs. In this paper we report results of a research project on the development of snowball sampling methods for ERGMs. We propose an auxiliary parameter Markov chain Monte Carlo (MCMC) algorithm for sampling from the relevant probability distributions. The method is designed to decrease the number of allowed network states without worsening the mixing of the Markov chains, and suggests a new approach for the developments of MCMC samplers for ERGMs. We demonstrate the method on both simulated and actual (empirical) network data and show that it reduces CPU time for parameter estimation by an order of magnitude compared to current MCMC methods.
Keywords ERGMs; Parameter inference; MCMC; Social Networks; Supercomputing; Snowball Sampling.
*
Generous support from the Swiss National Platform of Advanced Scientific Computing (PASC)
is gratefully acknowledged
9
Introduction One way to think about a social network is in terms of a set of nodes representing social agents (e.g. individuals, groups, or organizations), and a set of social ties recording the presence of a relation among these agents (e.g. kinship, friendship, or economic exchange) [1-2]. The list of disciplines where the analysis of social networks has opened new research possibilities includes economics [3], sociology [4], political sciences [5], international relations [6], medicine [7], and public health [8-9]. Models for social networks have also attracted considerable attention among physicists [10-12], and are inspiring the development of new interdisciplinary perspectives [13]. The diffusion of social network analysis across disciplinary boundaries has stimulated considerable innovation in the area of statistical modeling [14]. Information about networks is often obtained by recording the presence or absence of a network tie (edges) for every pair of actors (nodes). The resulting network data are presented in form of graph. Exponential random graph models (ERGMs) are well-established models for social networks [15-17]. ERGMs may be defined as follows. Let xij be a tie variable, xij =1 if a tie exists between nodes i and j and xij=0 if there is no tie between these nodes. The model assigns a probability to the graph of the form:
1 Pr( X x ) exp A z A ( x ) , k A
(1)
where X = [Xij] is a 0-1 matrix of tie variables and x is a realization of X, A is a configuration of ties that specifies a type of model interaction (detailed examples are given in Section 2), zA(x) is the number of such configurations in the network (network statistics), A is the corresponding model parameter,
k
is a normalizing
constant included to ensure that (1) is a probability distribution,
k exp A z A ( x ) , X A
(2)
with the summation over all the possible network states. The model defined in (1) involves a general distribution form. In order to define a specific ERGM one should define the set of all configurations A included in model (1). 10
After the ERGM is defined, the objective of inference is to find values of ERGM parameters such that
E ( X ) xobs , (3) where E ( X ) is the expected network given the set of ERGM parameters .and
xobs is the observed network we want to study. In order to obtain reliable estimates of ERGM parameters the following computational methods have been used: Markov Chain Monte Carlo Maximum Likelihood estimation using GeyerThompson [18] and Robbins-Monro stochastic approximation [19] approaches and Bayesian analysis [20-22]. The Geyer-Thompson approach is used in the Statnet package [23] while the Robbins-Monro method is used in the PNet package for ERGM estimation [24]. In all these methods MCMC is used for generation of E ( X ) . ERGM estimation is a computationally expensive procedure. Given the fact that computationally the most expensive part for ERGM estimation is the procedure for regenerating the expected network E ( X ) , an efficient MCMC method for sampling from distribution (1) would be clearly useful. Efficient MCMC samplers require less CPU time in order to reach the invariant probability density. The efficiency of an MCMC sampler is given by two factors: mixing of Markov chain [25] and computational cost. While some advanced MCMC samplers improve mixing properties considerably, they require intensive computations and as a result may be less efficient than simpler MCMC samplers. A brief review of popular MCMC samplers and comparison of their efficiency is given in [26]. Two general MCMC approaches are typically used to sample from binary distributions: Metropolis-Hastings [27] algorithms and replica exchange [28]. Many popular and efficient MCMC samplers may be considered as special cases of these general approaches. Many MCMC samplers were developed for modeling distribution of spins on crystalline lattices [29-30]. The Wang-Landau algorithm was recently applied for some particular forms of ERGMs [31] and was found very useful in the case of phase transitions. The MCMC samplers for generic binary distribution are limited. Recently Hamiltonian MCMC was proposed for binary distributions [32]. In order to apply the Hamiltonian 11
approach, binary variables are mapped onto continuous variables and it is shown that sampling from the resulting continuous distribution may be more efficient than sampling from the original binary distribution. In this manuscript we suggest a new auxiliary parameter MCMC algorithm for ERGMs. The manuscript is organized as follows: Model details are given in Section 2, in Section 3 the relevant existing MCMC samplers for ERGMs are reviewed, in Section 4 a new MCMC sampler is suggested, and in Section 5 the results of ERGM estimation with different MCMC samplers are compared in terms of their efficiency.
2. Model interaction Different types of statistics zA(x) may be required for different networks. Here, for simplicity, we restrict the discussion to undirected networks (xij=xji.) and the corresponding statistics. One of the statistics used for ERGMs is simply a count of all the ties (edges) contained in the network x. Denote it by L(x), z L ( x ) L( x ) xij . (4) i, j
Thus L(x) is a number of nonzero tie variables. Other basic statistics are the 2-star count, 3-star count,.., k-star count and triangle count [33,17]. A k-star is a configuration in which one node is connected to k other nodes (Figure 1) while a triangle is a complete subgraph of 3 nodes i, j, k so that xij=xik=xki=1. The model with these statistics only rarely provides a good fit to empirically observed social networks.
Figure 1. Sub-network configurations: k-stars, k-triangle and k-two-path.
Snijders et al. [17] suggested a more general specification. The following configurations were introduced: a k-2-path is a sub-network comprising 2 nodes, i and j, and a set of exactly k different nodes, sharing ties with both node i and node j; a k triangle may be defined as such a k-2-path in which nodes i and j are connected by a tie (xij=1) (Figure1). Snijders et al. [17] also introduced “geometrically weighted degree” in order to model all k-stars with a single 12
parameter. This was done by placing decreasing weights on higher degrees. The same approach was also applied for k-2-paths and k-triangles. Denote the number of k-stars in network by Sk(x), number of k-2-paths by Uk(x) and number of ktriangles by Tk(x). The following “alternating statistics” (so called as the weights have alternating signs, thereby balancing the positive weights when k is even with negative weights when k is odd) were proposed: N 1
z AS ( x ) ( 1) k Sk ( x ) / k 2 ,
(5)
k 2
z A 2 P ( x ) U1 ( x )
2U 2 ( x )
N 2
( 1) k 1U k ( x ) / k 1 , (6) k 3
N 3
z AT ( x ) 3T1 ( x ) ( 1) k Tk 1 ( x ) / k ,
(7)
k 1
where N is the number of nodes and λ is a constant damping parameter; we use λ=2 throughout. These alternating statistics were later rewritten in a different but equivalent form by Hunter [34] and have proved to be very useful for many empirical networks. The statistics (5-7) are not the numbers of sub-networks but rather they are functions of these numbers. In principle if any function f(x) may be used for the statistics z A =f(x) then ERGMs and the corresponding distribution (1) may be considered as a general form of binary distributions. Different actors may have different attributes. For example, nodes may represent individuals of different age or gender, and organizations with different ownership structures and of different size. Social networks researchers are often interested in how these attributes influence the tendency of actors to form ties. In this paper “activity” and “interaction” statistics will be used for networks with binary attributes ai 0,1. Activity measures the increased propensity for a node with attribute ai 1 to form a tie, regardless of the attribute of the other node. It is defined as z ai xij . (8) i, j
Interaction measures the increased propensity for a node i with ai 1 to form a tie to another node j also with a j 1 . It is defined as:
13
z B xij ai a j .
(9)
i, j
Nodes may also have a categorical attribute ci. The “matching” statistic measures the increased propensity for two actors to form a tie between them if they have the same value of the categorical attribute. It is defined as: z Match xij ci ,c j , (10) i, j
where x, y is the Kronecker delta function. The statistics (9) and (10) are the count of ties in the network, but in contrast to statistic (4) that counts the number of all network ties, statistics (9) and (10) count the number of specific network ties. The statistic (10) counts the number of ties between those nodes that have the same categorical attributes and the statistic (9) counts the number of ties between nodes with attributes ai 1 . Statistics zA specify not only model interaction but also network properties. When ERGM estimation is performed, equation (3) is often written as the following system of equations
z A ( E ( X )) z A ( xobs ) .
(11)
3. MCMC sampler for ERGMs MCMC simulation is necessary for estimating expectation of graphs E ( X ) at a given set of model parameters. Currently only Metropolis-Hastings algorithms [27] are used for ERGMs with more than one statistic. The Metropolis-Hastings algorithm proposes transitions from the current network x to a proposed network x’, where the probability of accepting a move from x to x’ is given by
q( x ' x ) Pr ( X x ') P( x x ') min 1, , q( x x ') Pr ( X x)
(12)
where q is a proposal distribution. It describes proposed changes to the current state of the Markov chain. This algorithm proposes different MCMC states x’ with different probability q( x x ') . Thus the transition probabilities that define the transition matrix of the Markov chains [35] are given by 14
( x x ') q( x x ') P( x x ') when x x ' . The Metropolis-Hastings algorithm satisfies the detailed balance requirements by construction thanks to the form of the acceptance probability [27,35]. Several MCMC samplers were suggested for ERGMS, that differ in the proposal distribution q. Typically, the Basic MCMC sampler is used. In the Basic sampler, two nodes i and j (dyad) are selected uniformly at random and the corresponding tie variable xij is toggled: delete the tie between these actors if it exists and add the tie if it is absent. Another sampler is the Fixed Density (FD) sampler [18,36] that modifies the Basic sampler by fixing the number of ties equal to that in the observed network, L(x)=Lobs. The FD sampler may be described as follows: select randomly one null dyad (xij=0) and one non-null dyad, (xkl=1). The proposal is to toggle the values of both these dyads simultaneously. This proposal does not modify the number of network ties. If at the starting point the network had Lobs ties then all the graphs generated by this sampler have constant number of ties L(x)=Lobs. The proposal of FD sampler may be written in the analytical form as:
q( x x ')
1 1 , Lobs Lmax Lobs
where Lmax is the full number of dyads, Lmax
(13a)
N ( N 1) if we consider 2
nondirected networks (xij=xji). This proposal is symmetric q( x x ') q( x ' x ) and hence it cancels in (12). The resulting acceptance probability is that of Metropolis Monte Carlo [37]. Thus FD algorithm samples not from the probability distribution
Pr( X x ) given by (1) but from the probability distribution given by
Pr'( X x ) L ( x ),Lobs Pr( X x ) . With the normalizing constant this probability distribution may be written as Pr'( X x ) L ( x ),Lobs exp L L( x ) A z A ( x ) A L
exp L L( x ) A z A ( x) . x:L ( x ) Lobs A L
(13b)
As soon as L(x) is constant the term L L( x ) cancels in the numerator and the denominator (13b). Hence the parameter L is not a parameter of the model (1) 15
when FD sampler is used and the dimension of the system of equations (11) is reduced by one compared to the one of the Basic sampler. This already reduces the CPU time needed for parameter estimation. Furthermore, decreasing the number of possible network states X simplifies the distribution (1), and MCMC sampling from the simplified distribution may be faster. In reality, however, it may prove to be slower. The reason is that constraining L(x)=Lobs creates “forbidden” states with zero probability Pr( L( x) Lobs ) 0 which worsen the mixing of Markov chains. The FD sampler can be useful for the estimation of some networks [38-39,17] but often it is less efficient than other MCMC samplers. Another popular MCMC sampler for ERGMs is the so-called “TNT” (TieNo-Tie) sampler [40]. Large social networks are typically sparse and this sampler is designed to alleviate problems that may arise due to sparseness. As in the Basic sampler, only one dyad is toggled at each simulation step of the TNT sampler, but rather than selecting a dyad to toggle uniformly at random, the algorithm first tosses a fair coin to decide whether to toggle a null (filling move) or a non-null dyad (deleting move). Once the move type has been determined, the dyad to be toggled is chosen uniformly at random among the available null (for a filling move) or non-null dyads (for a deleting move). With the TNT sampler, null dyads are chosen with probability ½ (instead of the proportion of non-null dyads as in Basic sampler, which is close to 1 for sparse networks). The corresponding proposal distributions for filling (14a) and deleting (14b) moves are:
q( x x ') 0.5( Lmax L( x )) 1 ,
(14a)
q( x ' x) 0.5( L( x) 1) 1 . (14b) The TNT sampler is often more efficient for social networks than the Basic sampler. However, when the TNT sampler is used for parameter inference, the estimation of L is required. Furthermore, the TNT sampler produces values of L(x) that are significantly different from the observed value. TNT proposal can even produce empty (L(x)=0) or full (L(x)=Lmax) networks during MCMC simulation. In this case, proposal (14a, b) should be modified. One possible modification is detailed in Section 4. 16
4. Improved Fixed Density MCMC sampler We propose the Improved Fixed Density (IFD) MCMC sampler for ERGMs. Like the FD sampler, it decreases the number of allowed network states, however it does so without worsening the mixing of Markov chains. This is accomplished by introducing an auxiliary parameter and a computationally simple method for finding its value. At the same time the proposal distribution of IFD sampler is very similar to that of the TNT sampler (14a, b) making it useful also for sparse networks. If the MCMC simulation converges to its equilibrium stationary distribution, then further MCMC transitions do not modify this distribution. In this case, the average properties of the system under study are constant. In the case of ERGMs such properties are values of statistics zA(x). Consider transitions that modify the number of ties L(x) by ±1 (as e.g. in the Basic or TNT samplers). The stationary distribution is reached only if the average probability that MCMC transitions increase L(x) equals the average probability that MCMC transitions decrease L(x). Thus the expected number of ties
=Lobs if the following condition is satisfied:
L( x) Lobs L( x ') Lobs 1 L( x) Lobs 1 L( x ') Lobs .
(15)
Indeed (15) <=> L Lobs when Basic or TNT MCMC samplers are used. The IFD sampler is described below. Taking the term L zL out from the sum, the probability distribution (1) may be written as:
1 Pr( X x ) exp A z A ( x ) L zL ( x ) (16) k A L With larger values of L networks with more ties L(x) are more likely. Thus the expected number of network ties can be modified by modifying L . Furthermore, with any given parameters A L it is possible to find a L value that satisfies (15). If such a L is found then constraining the Markov chain realizations by graphs with L(x)=Lobs ties does not worsen the mixing. 17
The usual MCMC approach (e.g. Basic or TNT sampler) allows one to find L such that (15) is satisfied when L is constant. In contrast the method we suggest allows one to find L such that (15) is satisfied when L is constant. More precisely L is not constant but two L values are possible L {Lobs , Lobs 1} . Thus we constrain the number of network ties in the vicinity of the observed value Lobs. We allow networks to have only Lobs or Lobs +1 ties and apply the TNT sampler. The TNT filling move (14a) is applied if network has Lobs ties and TNT deleting move (14b) is applied if the network has Lobs+1 ties,
Fill randomly selected null dyad if L( x) Lobs q( x x ') . Delete randomly selected tie if L( x) Lobs 1 In analytical form, this proposal may be written as follows:
q( x x ') L ( x ),Lobs L ( x '),Lobs 1
1 1 L ( x ),Lobs 1 L ( x '),Lobs , Lmax Lobs Lobs 1
q( x ' x ) Lmax Lobs q( x x ') Lobs 1
(17)
z L
,
(18)
1 for the filling move where zL . 1 for the deleting move Inserting (18) and (16) and into (12) and making simple rearrangements the following expression for the Metropolis-Hasting acceptance probability is obtained:
P( x x ') min 1,exp Az A ( x) zLV , (19) A L where
L Lobs V L log max . Lobs 1
(20)
Here V is an auxiliary parameter and detailed balance is satisfied at any V value. However, the efficient MCMC sampler is obtained if condition (15) is satisfied. The left side of (15) is nothing but the acceptance rate of filling moves of the suggested IFD sampler, and the right side of (15) is nothing but the acceptance 18
rate of deleting moves of this sampler. If (15) is satisfied then, similar to the TNT sampler, filling and deleting moves are proposed with the same probability ½. Hence the IFD sampler possesses those properties of TNT sampler that make it useful for sparse networks. As soon as network states with both Lobs or Lobs +1 ties are allowed, the acceptance rate of filling and deleting moves may be estimated directly during MCMC simulation. By modifying the V value, the acceptance rates of filling and deleting moves may be adapted to guarantee that (15) is satisfied. The algorithm of the suggested IFD sampler is detailed in the Appendix.
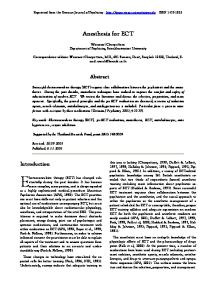
5. Estimation results. Verification of MCMC convergence is not a simple matter and different methods have been suggested [41]. Efficiency of different MCMC samplers is problem specific. We performed MCMC sampling from probability distribution given by (1,2), (4-9) with ERGM parameters given in Table 1. We use the effective sample size (ESS) as a measure of efficiency of the MCMC samplers that does not depend on machine or implementation. Networks of different sizes N were sampled with N ranging from 500 to 5000. The ESS was calculated in the post burn-in period using the “coda” package [42] for MCMC convergence diagnostics. An efficient sampler would produce large ESS at a smaller number of MC steps. We define the efficiency as ESS per 1 million MC steps. The efficiency of IFD, FD and Basic samplers is compared in Figure 2, where ESS is presented as a function of network size N. From this plot one can see that the efficiency of all the samplers decreases with the network size and that the IFD sampler is much more efficient than the FD and Basic samplers. The values on the left and on the right side of (15) were extracted from the simulation results of the IFD sampler and are compared in the inset of Figure 2. One can see that the suggested algorithm produces values of V such that the acceptance rate of IFD filling moves approximately equals the acceptance rate of IFD deleting moves. The presented results correspond to last 7∙105 MC steps only. In any case if (15) is not satisfied then it is identified on step 5 of the suggested algorithm (see Appendix).
19
Basic IFD FD
1
0,1
0,01
0,8
Acc. Rate
ESS per 10
6
MC steps
10
0,7 IFD fillling move
0,6
0
200000
IFD deleting move 400000
600000
MC step
1000
2000
3000
4000 5000
N
Figure. 2. The network size dependence of the efficiency of IFD, FD and Basic samplers. IFD results are well fitted by 80000N-1.2 function (dashed line). Left and right side of eq. (15) are compared in the inset.
We use IFD sampler to study social networks. We perform estimation of ERGM parameters for several different networks using different MCMC samplers and compare the result of estimation and the elapsed CPU time. Stochastic approximation was used for the solution of moment equation (3). The popular stochastic approximation method for ERGMs estimation was suggested and detailed by Snijders [18]. The following MCMC samplers were used for regenerating the expected network E ( X ) : the Basic sampler, FD sampler and the proposed IFD sampler. The simulation was performed on Cray XC30 “Piz Daint” at the Swiss National Supercomputing Centre (CSCS). 5.1 Simulated networks In order to test the methods and their implementation we first estimate simulated networks with known properties. 100 networks were generated using the model given by (1,2), (4-9) and the same value of parameters, given in Table 1. The networks were generated using Basic MCMC sampler as implemented in PNet package [24]. Eight independent estimations were performed for each of these networks. The effects (4-9) were estimated and the obtained values are reported in Table 2. By comparing the estimation results (Table 2) with exact
20
value (Table 1) we conclude that stochastic approximation and IFD sampler produce correct estimation of ERGM parameters. Table 1. Parameters of the simulated networks. “50/50” under Attributes indicates that each node has a binary attribute, and 50% of the nodes have the “1” value of the attribute.
N
Attributes
5000 50/50
L -4.0
AS
AT
A2P
ρ
ρB
0.2
1.0
-0.2
0.2
0.5
Table 2. Estimates of full simulated networks obtained using IFD sampler.
Median Std. Dev
AS 0.42 0.7
AT 0.995 0.01
A2P -0.199 0.007
ρ 0.195 0.018
ρB 0.501 0.023
We compared the estimation time of the same networks on the same machine, but with different MCMC samplers. The average estimation time of simulated networks using the IFD sampler is 33 minutes. Estimation of these networks using the Basic or FD samplers was not possible in the 24 hours time limit. However, prior research reported that with the PNet package with the Basic sampler on a different system it took 84 hours [43]. This CPU time and the percent of converged solutions [43,18] of (3) are given in Table 3. Table 3. Average CPU time for the estimation of full networks and snowball samples. Results obtained by using different MCMC samplers.
MCMC sampler IFD Basic FD IFD Basic FD
Network Full Full Full Snowball Snowball Snowball
Avg. sample size 5000 5000 5000 1400 1400 1400
Converged, % 97.7 % 98.7 % 92.9 % 74.4 %
Avg. estim. time (minutes) 33.2 >1440 >1440 0.56 8.6 17.7
In order to estimate ERGM parameters of large networks, conditional estimation of snowball samples was suggested [44] and was used for the estimation of ERGM parameter of several empirical networks [43]. The parameters for snowball samples are estimated in parallel and are used to estimate the parameters of the whole network. The accuracy of such estimates increases with the size of snowball samples. The IFD sampler may be applied also for the estimation of snowball samples. Snowball sampling [43] was performed with 20 seeds, 2 waves and 20 snowball samples for each simulated network. The median 21
of estimations of these 20 samples was taken as the estimation of the network. Estimation result for all the 100 networks are presented in Figure 3.
Figure 3. Estimated parameters of 100 simulated networks, obtained using snowball sampling and conditional estimation. Error bars show the 95% confidence interval calculated using nonparametric bootstrap adjusted percentile method, suggested by Efron [45]. Horizontal lines indicate the value of corresponding parameter from Table 1.
The conditional estimation described above was performed using IFD, Basic and FD samplers. Results obtained with Basic sampler and IFD sampler are compared in Table 4. Again, the estimations obtained with Basic and IFD samplers are very close. However, the CPU time of these estimations is very different. Different CPU time was required for the estimation of different snowball samples and the distribution of this CPU time is shown in Figure 4. In this Figure the results obtained using the Basic, FD and IFD samplers are compared. The average CPU time of these estimations is given in Table 3. Figure 4 shows that in some cases the FD sampler may be more efficient than the Basic sampler, but on average the FD sampler is less efficient than the Basic sampler. One can see that the IFD sampler is more efficient, and compared with the Basic sampler the speedup is about 20 times. Furthermore, the number of converged estimations increases when IFD sampler is applied (see Table 3). We did not use the TNT sampler, because the proposal (14) cannot be used for the conditional
22
estimations, however the IFD sampler is based on the TNT sampler and in Section 4 we explained why the IFD sampler is more efficient.
Table 4. Estimations of simulated networks using snowball sampling and conditional estimation. Results obtained using Basic and IFD sampler are compared.
IFD, Median IFD, Std. Dev. Basic, Median Basic, Std. Dev.
AS -0.64 1.5 -0.468 1.78
AT 1.00 0.02 1.00 0.028
A2P -0.177 0.015 -0.177 0.017
ρ
ρB
0.172 0.066 0.171 0.074
0.476 0.068 0.514 0.066
Figure 4. Distribution of CPU time of the estimation of snowball samples (log plot). The average estimation time is given in Table 3.
5.2. Empirical networks We used the IFD sampler for the estimations of actual (empirical) social networks. We estimated the network co-authorship of scientists working on network theory and experiment (Netscience) [46] available from the Nexus repository (http://nexus.igraph.org). The network has 1589 nodes and 2742 ties. It was possible to estimate the model without snowball sampling. The network actors have no attributes and the only effects estimated were AT, AS and A2P. The result of corresponding parameter estimations and the average estimation time, obtained using Basic and IFD samplers, are compared in Table 5. Again, the values of the ERGM parameters obtained using Basic and IFD sampler are close, but the IFD sampler requires less CPU time. The MCMC acceptance rate was also calculated and the values obtained are also presented in Table 5. The acceptance rate is the fraction of proposed MCMC transitions that were accepted. It is easy to
23
calculate the acceptance rate and it is considered that MCMC converges faster when acceptance rate is about 23 % [47]. Table 5. Results of estimation of ERGM parameter of Netscience network (over 8 estimations) MCM sampler
N
AT
AS
A2P
IFD Mean IFD Std.Dev. Basic Mean Basic Std.Dev.
1589
3.858
-0.774
-0.01
1589
0.0025
0.0039
9.2∙10-4
1589
3.848
-0.774
-0.01
1589
0.0022
0.0029
7.2∙10-4
MCMC acc. rate, % 4.3
Converged, %
Estim. time (minutes)
100%
61 31
0.4
88%
300 72
The IFD sampler was successfully applied also in the estimation of a larger social network. We analyzed the network of US hospitals comprising 3306 hospitals and 14413 ties [48]. The tie represents the exchange of patients between hospitals [49]. The hospital had one binary attribute (whether or not the hospital has a teaching program), one continuous attribute (discharges from the hospital) and three categorical attributes describing the region the hospital belongs to: distinct hospital referral region (hrr), federal regions and the state. Some attributes were missing in the original data. The hospitals with missing attributes and the hospitals of Puerto Rico and Virgin Islands were excluded from the network that we studied. The resulting network had N=3061 hospitals and 12401 ties. The network was considered undirected (xij=xji) and the effects (5-10) described in Section 2 were estimated. The effect (10) was estimated for the three categorical attributes. It was not possible to estimate this network using the Basic sampler in a reasonable time. But using the IFD sampler it was possible to estimate the network parameters in 24 hours. The acceptance rate of IFD sampler was 15 %, much larger than the acceptance rate of the Basic sampler 0.4 %. The results of hospital network estimation are given in Table 6. These results could be described as follows. The effect of two-paths is small, while effect of the stars is negative (the number of stars in the network is smaller than would be expected by chance). This is an anti-preferential attachment effect, indicating that, conditional on other effects in the model, there is no strong tendency for the creation of network hubs. The effect of triangulation (network closure) is positive. Hospitals with a teaching program are more active in sharing patients, but they share patients more often with hospitals without teaching 24
programs. Not surprisingly, the hospitals within the same region share patients more often among themselves. More detailed analysis of the hospital network requires analysis of the directed network (xij≠xji) and the corresponding statistics.
Table 6. Results of estimation of ERGM parameter of network of N=3061 US hospitals using IFD sampler (over 8 estimations). ρ ρB Match Match Match AT AS A2P Conteaching
hrr
region
state
verged 62 %
Mean
1.383
-1.951
0.0057
0.898
-0.773
1.87
2.126
1.186
Std.Dev.
4.6∙10-4
0.0029
5.3∙10-5
8∙10-4
0.0016
0.0013
0.0011
0.0013
6. Conclusion and extensions ERGMs are a general form of probability distribution for a very large number of binary variables. MCMC methods are required for reliable estimation of ERGM parameters. Estimation of ERGM parameters is a computationally expensive procedure. Developing efficient computational methods extends the circumstances in which ERGMs may be employed for the analysis of social and other kinds of networks. The commonly used MCMC samplers for ERGMs were reviewed. Based on these samplers a new MCMC sampler was proposed. The proposed IFD sampler decreases the number of allowed network states and thus decreases the complexity of the problem. The number of allowed network states may be decreased without worsening the mixing of Markov chains by introducing a continuous auxiliary parameter. In the IFD sampler the number of network ties L(x), defined by Eq. (4), is suggested to be constrained and the auxiliary parameter is related with the corresponding model parameter. The value of the auxiliary parameter is modified during MCMC simulation and a computationally simple method is suggested for finding its value. The efficiency of the samplers was compared in terms of their effective sample size (ESS) on a given probability distribution and ESS produced by IFD sampler is at least one order of magnitude larger than that of other samplers. Several networks were estimated using different MCMC samplers and the estimation results were compared. It is shown that estimates obtained with IFD 25
and commonly used samplers are identical, but less CPU time is required when the proposed IFD sampler is applied. Using the IFD sampler an ERGM for the network of N=3061 hospitals and 12401 ties could be estimated in less than 24 hours. The simulated networks having N=5000 nodes were estimated in less than one hour. The auxiliary parameter approach we have suggested may be extended in order to further decrease the number of allowed network configuration. While constraining only the statistics (4) reduces the CPU time of ERGMs estimation by an order of magnitude, the suggested approach can also be used to constrain the value of other networks statistics to the value observed in the data. In particular the described MCMC method can be applied to constrain not only the full number of network ties (4) but also the number of those ties that are counted by statistics (9) and (10). Thus the suggested approach opens new possibilities for the further developments of MCMC samplers for ERGMs. We have shown that the proposed MCMC sampler can be used together with recently developed conditional estimation from snowball sampling, a method that enables to study social networks of very large sizes. In this case larger snowball samples may be modeled and thus more accurate ERGM estimations may be obtained. Auxiliary parameter MCMC is an adaptive MCMC method and theoretical difficulties may arise with such methods [50]. Both the efficiency and the accuracy of adaptive methods may depend on the details of the adaptation algorithm. The IFD sampler has only been implemented for undirected networks, and tested on a small set of simulated and empirical networks. In these cases, it gives significant reduction in the processing time with no visible reduction in the accuracy. We therefore believe that it is a good candidate to become the standard sampler to use for estimating ERGM parameters. Acknowledgements: This work was funded by PASC project “Snowball sampling and conditional estimation for exponential random graph models for large networks in high performance computing” and was supported by a grant from the Swiss National Supercomputing Centre (CSCS) under project ID c09. This research was also supported by a Victorian Life Sciences Computation Initiative (VLSCI) grant number VR0261 on its Peak Computing Facility at the University of Melbourne, an initiative of the Victorian Government, Australia.
26
APPENDIX: IFD SAMPLER ALGORITHM Let RN be a random uniform number between 0 and 1. m, M and K are constants. The algorithm of the suggested IFD sampler is described below. 1. Initialization t=0; 2. Initialization NA =0; ND =0; Increment t; 3. While (ND+NA
N D N A /( N D N A ) 0.8 than larger K value may be required. 6. If (t
References 1. Borgatti, S.P., Mehra, A., Brass, D.J., Labianca, G.: Network analysis in the social sciences. Science 323, 892-895 (2009) 27
2. Wasserman, S., Faust, K.: Social network analysis: Methods and applications, vol 8, Cambridge University Press (1994) 3. Jackson, M.O.: Social and economic networks, vol. 3, Princeton University Press (2008) 4. Friedkin Noah, E.: A structural theory of social influence, vol. 13, Cambridge University Press (2006) 5. Ward, M.D., Stovel, K., Sacks, A.: Network analysis and political science. Annual Review of Political Science 14, 245-264 (2011) 6. Hollway, J., Koskinen, J.: Multilevel embeddedness: The case of the global fisheries governance complex. Social Networks 44, 281-294 (2016) 7. Christakis, N.A., Fowler, J.H.: The spread of obesity in a large social network over 32 years. New England Journal of Medicine 357(4), 370-379 (2007) 8. Kretzschmar, M., Morris, M.: Measures of concurrency in networks and the spread of infectious disease. Mathematical Biosciences 133(2), 165-195 (1996) 9. Rolls, D.A., Wang, P., Jenkinson, R., Pattison, P.E., Robins, G.L., Sacks-Davis, R., Daraganova, G., Hellard, M., McBryde, E.: Modelling a diseaserelevant contact network of people who inject drugs. Social Networks 35(4), 699-710 (2013) 10. Girvan, M., Newman, M.E.: Community structure in social and biological networks. Proceedings of the National Academy of Sciences 99(12), 78217826 (2002) 11. Newman, M.E., Park, J.: Why social networks are different from other types of networks. Physical Review E 68(3), 036122 (2003) 12. Newman, M.E., Watts, D.J., Strogatz, S.H.: Random graph models of social networks. Proceedings of the National Academy of Sciences 99(suppl 1), 2566-2572 (2002) 13. Schweitzer, F., Fagiolo, G., Sornette, D., Vega-Redondo, F., Vespignani, A., White, D.R.: Economic networks: The new challenges. Science 325(5939), 422 (2009) 14. Snijders, T.A.: Statistical models for social networks. Annual Review of Sociology 37, 131-153 (2011) 15. Frank, O., Strauss, D.: Markov graphs. Journal of the American Statistical Association 81(395), 832-842 (1986) 16. Lusher, D., Koskinen, J., Robins, G.: Exponential random graph models for social networks: Theory, methods, and applications. Cambridge University Press (2012) 17. Snijders, T.A., Pattison, P.E., Robins, G.L., Handcock, M.S.: New specifications for exponential random graph models. Sociological Methodology 36(1), 99-153 (2006) 18. Snijders, T.A.: Markov chain Monte Carlo estimation of exponential random graph models. Journal of Social Structure 3(2), 1-40 (2002) 19. Hummel, R.M., Hunter, D.R., Handcock, M.S.: Improving simulation-based algorithms for fitting ERGMs. Journal of Computational and Graphical Statistics 21(4), 920-939 (2012) 20. Caimo, A., Friel, N.: Bayesian inference for exponential random graph models. Social Networks 33(1), 41-55 (2011) 21. Jin, I.H., Yuan, Y., Liang, F.: Bayesian analysis for exponential random graph models using the adaptive exchange sampler. Statistics and Its Interface 6(4), 559 (2013) 28
22. Wang, J., Atchadé, Y.F.: Approximate Bayesian computation for exponential random graph models for large social networks. Communications in Statistics-Simulation and Computation 43(2), 359-377 (2014) 23. Handcock, M.S., Hunter, D.R., Butts, C.T., Goodreau, S.M., Morris, M.: statnet: Software tools for the representation, visualization, analysis and simulation of network data. Journal of statistical software 24(1), 1548 (2008) 24. Wang, P., Robins, G., Pattison, P.: PNet: Program for the estimation and simulation of p* exponential random graph models, User Manual. Department of Psychology, University of Melbourne (2006) 25. Mira, A. Ordering and improving the performance of Monte Carlo Markov chains. Statistical Science, 340-350 (2001) 26. Sengupta, B., Friston, K.J., Penny, W.D.: Gradient-free MCMC methods for dynamic causal modelling. NeuroImage 112, 375-381 (2015) 27. Hastings, W.K.: Monte Carlo sampling methods using Markov chains and their applications. Biometrika 57(1), 97-109 (1970) 28. Swendsen, R.H., Wang, J.-S.: Replica Monte Carlo simulation of spin-glasses. Physical review letters 57(21), 2607 (1986) 29. Barkema, G., Newman, M.: New Monte Carlo algorithms for classical spin systems. arXiv preprint cond-mat/9703179 (1997) 30. Swendsen, R.H., Wang, J.-S.: Nonuniversal critical dynamics in Monte Carlo simulations. Physical review letters 58(2), 86 (1987) 31. Fischer, R., Leitão, J.C., Peixoto, T.P., Altmann, E.G.: Sampling motifconstrained ensembles of networks. Physical Review Letters 115(18), 188701 (2015) 32. Pakman, A., Paninski, L.: Auxiliary-variable exact Hamiltonian Monte Carlo samplers for binary distributions. In: Advances in Neural Information Processing Systems 2013, pp. 2490-2498 33. Hunter, D.R., Handcock, M.S.: Inference in curved exponential family models for networks. Journal of Computational and Graphical Statistics 15(3) (2006) 34. Hunter, D.R.: Curved exponential family models for social networks. Social Networks 29(2), 216-230 (2007) 35. Tierney, L.: Markov chains for exploring posterior distributions. the Annals of Statistics, 1701-1728 (1994) 36. Hunter, D.R., Handcock, M.S., Butts, C.T., Goodreau, S.M., Morris, M.: ergm: A package to fit, simulate and diagnose exponential-family models for networks. Journal of Statistical Software 24(3), nihpa54860 (2008) 37. Metropolis, N., Rosenbluth, A.W., Rosenbluth, M.N., Teller, A.H., Teller, E.: Equation of state calculations by fast computing machines. The Journal of Chemical Physics 21(6), 1087-1092 (1953) 38. McAllister, R.R., McCrea, R., Lubell, M.N.: Policy networks, stakeholder interactions and climate adaptation in the region of South East Queensland, Australia. Regional Environmental Change 14(2), 527-539 (2014) 39. Niekamp, A.-M., Mercken, L.A., Hoebe, C.J., Dukers-Muijrers, N.H.: A sexual affiliation network of swingers, heterosexuals practicing risk behaviours that potentiate the spread of sexually transmitted infections: A two-mode approach. Social Networks 35(2), 223-236 (2013)
29
40. Morris, M., Handcock, M.S., Hunter, D.R.: Specification of exponentialfamily random graph models: terms and computational aspects. Journal of Statistical Software 24(4), 1548 (2008) 41. Cowles, M.K., Carlin, B.P.: Markov chain Monte Carlo convergence diagnostics: a comparative review. Journal of the American Statistical Association 91(434), 883-904 (1996) 42. Plummer, M., Best, N., Cowles K, and Vines K. CODA: Convergence Diagnosis and Output Analysis for MCMC, R News, 6(1), 7-11 (2006) 43. Stivala, A.D., Koskinen, J.H., Rolls, D.A., Wang, P., Robins, G.L.: Snowball sampling for estimating exponential random graph models for large networks. Social Networks 47,167-188 (2016). doi:10.1016/j.socnet.2015.11.003 44. Pattison, P.E., Robins, G.L., Snijders, T.A., Wang, P.: Conditional estimation of exponential random graph models from snowball sampling designs. Journal of Mathematical Psychology 57(6), 284-296 (2013) 45. Efron, B.: Better bootstrap confidence intervals. Journal of the American Statistical Association 82(397), 171-185 (1987) 46. Newman, M.E.: The structure of scientific collaboration networks. Proceedings of the National Academy of Sciences 98(2), 404-409 (2001) 47. Roberts, G.O., Gelman, A., Gilks, W.R.: Weak convergence and optimal scaling of random walk Metropolis algorithms. The Annals of Applied Probability 7(1), 110-120 (1997) 48. Iwashyna, T.J., Christie, J.D., Moody, J., Kahn, J.M., Asch, D.A.: The structure of critical care transfer networks. Medical Care 47(7), 787 (2009) 49. Lomi, A., Pallotti, F.: Relational collaboration among spatial multipoint competitors. Social Networks 34(1), 101-111 (2012) 50. Haario, H., Laine, M., Mira, A., & Saksman, E. (DRAM: efficient adaptive MCMC. Statistics and Computing, 16(4), 339-354 (2006)
30