Area Throughput of an IEEE 802.15.4 Based Wireless Sensor Network Chiara Buratti, Flavio Fabbri and Roberto Verdone WiLab - DEIS at University of Bologna, V.le Risorgimento, 2 I-40136 Bologna, Italy {c.buratti,flavio.fabbri,roberto.verdone}@unibo.it
Abstract. In this paper we present a mathematical model to evaluate the performance of an IEEE 802.15.4 based multi-sink Wireless Sensor Network (WSN). Both sensors and sinks are assumed to be Poisson distributed in a given finite domain. Sinks send periodic and synchronous queries, and each sensor transmits its sample to a sink, selected among those that are audible. The IEEE 802.15.4 Multiple Access Control (MAC) protocol is used by sensors to access the channel: both Beacon-Enabled and Non Beacon-Enabled modes are considered. Our aim is to describe how the Area Throughput, defined as the amount of samples per unit of time successfully transmitted to the sinks from the given area, depends on the density of sensors and the query interval. We jointly account for MAC issues (i.e. packet collisions) and connectivity aspects (i.e. network topology, power losses and radio channel behaviour). Performance is evaluated by varying the traffic offered to the network (i.e. the number of sensors deployed), the packet size, the number of Guaranteed Time Slots allocated, and the Superframe Order. A comparison between results obtained in the Beacon-Enabled and the Non BeaconEnabled cases is also provided, showing how the Area Throughput can be optimised.
1
Introduction
Many applications of Wireless Sensor Networks (WSNs) deal with the estimation of spatial/temporal random processes [1], [2]. Sensors are deployed in the target area, which is observed through query/respond mechanisms: queries are periodically generated by the application, and sensor nodes react by sampling and sending data to a centralised unit. By collecting samples taken from different locations and observing their temporal variations, estimates of the target random process realisation can be produced [3]. Good estimates require sufficient data taken from the area. Often, the data must be sampled from a specific portion of space, even if the sensor nodes are distributed over a larger area. Therefore, only a location-driven subset of sensor nodes must respond to queries. The aim of the query/response mechanism is then to acquire the largest possible number of samples from the area.
2
Chiara Buratti, Flavio Fabbri and Roberto Verdone
The data taken from the area are transmitted to the unit by means of wireless links connecting sensors to sinks, which collect the samples and forward them to the unit through a proper network. If few sensor nodes are deployed and the target area is small, a single sink can be used. When the number of sensors or the target area are large, they are often organised in clusters; one sink per cluster forwards the queries to sensors, and collects the responses. Sinks are sometimes specifically deployed in optimised and planned locations with respect to sensors. However, opportunistic exploitation of the presence of sinks, connected to the centralised unit through some mobile radio interface, is an option in some cases [4]. Under these circumstances, many sinks can be present in the monitored space, but their positions are unknown and unplanned; therefore, achievement of a sufficient level of samples is not guaranteed, because the sensor nodes might not reach any sinks (and thus be isolated) due to the limited transmission range. In such an uncoordinated environment, network connectivity is a relevant issue, and it is basically dominated by the randomness of radio channel and the density of sinks. Being the acquisition of samples from the target area the main issue for the application scenario considered, we define a new metric for studying the behavior of the WSN, namely the Area Throughput, denoting the amount of samples per unit of time successfully transmitted to the centralised unit, originating from the target area. We evaluate the Area Throughput in this paper, assuming that sinks forward the data collected to the centralized unit with no losses: therefore, only the WSN (sensors and sinks) is modelled. As expected, the Area Throughput is larger if the density of sensor nodes is larger, but, on the other hand, if a contention-based MAC protocol is used, the density of nodes significantly affects the ability of the protocol to avoid packet collisions (i.e. simultaneous transmissions from separate sensors towards the same sink). If, in fact, the number of sensor nodes per cluster is very large, collisions and backoff procedures can make data transmission impossible under time-constrained conditions, and the samples taken from sensors do not reach the sinks and, consequently, the centralised unit. Therefore, the optimisation of the Area Throughput requires proper dimensioning of the density of sensors, in a framework model where both MAC and connectivity issues are considered. We assume sensors transmit their samples to sinks through an IEEE 802.15.4 air interface. IEEE 802.15.4 [5] is a short-range wireless technology intended to provide applications with relaxed throughput and latency requirements in wireless Personal Area Networks (PANs). In our scenario, sinks will act as PAN coordinators, periodically transmitting queries to sensors and waiting for replies. The 802.15.4 standard offers two types of channel access mechanisms: Beacon and Non Beacon-Enabled. The latter case uses unslotted CSMA/CA (Carrier Sensing Multiple Access with Collision Avoidance), whereas in the former operation mode a slotted CSMA/CA algorithm and a superframe structure managed by the PAN coordinator, is used. According to the standard, the different PAN coordinators, and therefore the PANs, use different frequency channels (see the scan functionality performed by the PAN coordinator for establishing a PAN).
Area Throughput of an IEEE 802.15.4 Based Wireless Sensor Network
3
A
sensor sink
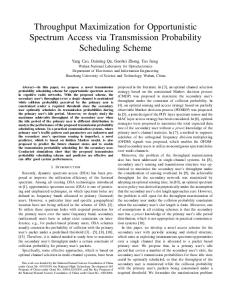
Fig. 1. The Reference Scenario considered.
Therefore no collisions may occur between nodes belonging to different PANs; however, nodes belonging to the same cluster, will compete to try to transmit their packets to the sink. We consider here an infinite area where sensors and sinks are uniformly distributed at random. Then, we define a specific portion of space, of finite size and given shape (without loss of generality, we consider a square), as the target area; both the number of sensors and sinks are then Poisson distributed in such area (see Figure 1). We define as Offered Load the amount of samples available from the sensors deployed in the area, per unit time. The basic objective of this paper is thus to determine how the Area Throughput depends on the Offered Load and the parameters of the IEEE 802.15.4 MAC protocol used. Both MAC and connectivity issues are taken into account under a joint approach. In general terms, we might say that we aim at defining a picture showing how throughput varies with load, as done for many years in the literature for different types of MAC protocols: here, we also include connectivity and the plurality of sinks into account. The aim of this paper is to compare the Area Throughput obtained in the Beacon-Enabled and Non Beacon-Enabled modes, as a function of all MAC parameters, the density of nodes and the query interval. The study is completely performed through mathematical analysis. The rest of the paper is organised as follows. The following Section deals with related works, Section 3 introduces the scenario and the link model. In Section 4 the Area Throughput is evaluated, by computing the success probability for the transmission of a packet accounting for connectivity and MAC issues. In Section 5 the IEEE 802.15.4 MAC protocol model for the Beacon- and Non Beacon-Enabled cases is introduced, for the evaluation of the success probability related to MAC. Finally, in Section 6 and 7 numerical results and conclusions are presented.
4
2
Chiara Buratti, Flavio Fabbri and Roberto Verdone
Related Works
Many works in the literature are related to the modelling of different MAC protocols, and also to connectivity models, but very few papers jointly consider the two issues under a mathematical approach. Some analysis of the two issues are performed through simulations: as examples, [6] related to ad hoc networks, and [7], to WSNs. Many papers devoted their attention to connectivity issues of wireless ad-hoc and sensor networks in the past (e.g., [8]). Single-sink scenarios have attracted more attention so far. However, an example of multi-sink scenario can be found in [9]. All the previously cited works do not account for MAC issues. Concerning the analytical modelling of the IEEE 802.15.4 MAC protocol few works devoted their attention to Non Beacon-Enabled mode [10]; most of the analytical models are related to Beacon-Enabled networks [11–14]. In [10], the authors try to model the unslotted CSMA/CA protocol for non beacon-enabled networks, but they do not capture correctly the protocol, because they include in the Markov chain two subsequent sensing phases, and not one, as fixed in the Standard (see Section 5). [11] fails to match simulation results [12], as the authors use the same Markov formulation and assumptions made by Bianchi in [15], where the 802.11 MAC protocol is considered. A better, even if similar, model is proposed in [13], where, however, the sensing states are not correctly captured by the Markov chain. In [12] the main gaps of the previous models are overcome. However, in all the previous works, the probability to find the channel busy is evaluated regardless of the backoff stage in which the node is. Our model, instead, captures the different probabilities at the different backoff stages. This leads to a better match between simulation and analytical model results (see [17–19]). Moreover, the aforementioned models assume that nodes always (or at least with a certain probability) have a packet to be transmitted. In this case, when a node succeeds in transmitting its packet, it will restart the backoff algorithm, possibly with a certain probability. In our model, instead, nodes transmit only one packet per received query, according to the applications considered. Finally, all the above cited works study the asymptotic behavior of the network, that is the behavior of the system at the equilibrium conditions, evaluating the stationary probabilities, obtained when time, t, approaches infinite (t → ∞). Our analysis, instead, evaluates the statistical distribution of some metrics over time, starting from the reception of the query sent by the sink. The model proposed here is based on the following previous works. In [16] the authors presented a mathematical model for the evaluation of the degree of connectivity of a multi-sink WSN in unbounded and bounded domains. [17, 18] provide a mathematical model to derive the success probability for the transmission of a packet in an IEEE 802.15.4 single-sink scenario when the Non BeaconEnabled mode is used; in [19] the mathematical model for the IEEE 802.15.4 Beacon-Enabled mode, is provided. Finally, in [20] the concept of Area Throughput has been introduced, and the Non Beacon-Enabled mode has been considered as an example case. All these contributions are combined here to achieve the goal of this paper.
Area Throughput of an IEEE 802.15.4 Based Wireless Sensor Network
3
5
Assumptions and Reference Scenario
The reference scenario considered consists of an area of finite size and given shape, where sensors and sinks are both distributed according to a homogeneous Poisson Point Process (PPP). We denote as ρs [m−2 ] and ρ0 [m−2 ] the sensors and sinks densities, respectively, and with A the area of the target domain. Denoting by k the number of sensor nodes in A, k is Poisson distributed with mean k¯ = ρs · A and p.d.f. gk =
¯ k¯k e−k . k!
(1)
We also denote as I = ρ0 · A the average number of sinks in A. We assume that sinks periodically send queries to sensors and wait for replies. In case a sensor node receives a query from more than one sink, it selects the one providing the largest received power and responds to it. Upon reception of the query, each node will take one sample from the environment and will start the CSMA/CA-based algorithm (slotted and unslotted, depending on the modality selected), to try to transmit the data to the sink, through a direct link. We assume that each node transmits a packet having size D·10 Bytes, with D being a positive integer. Since an IEEE 802.15.4 air interface is considered, the time needed to transmit a packet is equal to D · T , where T = 320 µsec, as a bit rate of 250 kbit/sec is used. Moreover, we set the size of the query equal to 60 Bytes. We denote as fq = 1/Tq the frequency of the queries transmitted by the sinks, being Tq is the time interval between two consecutive queries. 3.1
The Link Model
The link model that we exploit accounts for the power loss due to propagation effects including both a distance-dependent path loss and the random channel fluctuations caused by possible obstructions. Specifically, a direct radio link between two nodes is said to exist if L < Lth , where L is the power loss and Lth represents the maximum loss tolerable by the communication system. In that case, the two nodes are said to be ”audible”. The threshold Lth depends on transmit power and receiver sensitivity. The power loss in decibel scale at distance d is expressed in the following form L = k0 + k1 ln d + s,
(2)
where k0 and k1 are constants, s is a Gaussian r.v. with zero mean, variance σ 2 , which represents channel fluctuations. This channel model was also adopted in [21]. By considering an average transmission range as in [21], an average connectivity area of the sensor can be defined as Aσ = πe
2(Lth −k0 ) k1
e
2σ2 k2 1
.
(3)
6
4
Chiara Buratti, Flavio Fabbri and Roberto Verdone
Evaluation of The Area Throughput
The Area Throughput is mathematically derived through an intermediate step: we first consider the probability of successful data transmission by an arbitrary sensor node, when k nodes are present in the queried area. Then, the overall Area Throughput is evaluated based on this result. 4.1
Joint MAC/Connectivity Probability of Success
Let us consider an arbitrary sensor node that is located in the queried area A at a certain time instant. We aim at computing the probability that it can connect to one of the sinks deployed in A and successfully transmit its data sample to the infrastructure. Such an event is clearly related to connectivity issues (i.e., the sensor must employ an adequate transmitting power in order to reach the sink and not be isolated) and to MAC problems (i.e., the number of sensors which attempt at connecting to the same sink strongly affects the probability of successful transmission). For this reason, we define Ps|k (x, y) as the probability of successful transmission conditioned on the overall number, k, of sensors present in the queried area, which also depends on the position (x, y) of the sensor relative to a reference system with origin centered in A. This dependence is due to the well-known border effects in connectivity [8]. In particular, we assume Ps|k (x, y) = En [PMAC (n) · PCON (x, y)] = En [PMAC (n)] · PCON (x, y),
(4)
with Ex being the expectation operator with respect to variable x and where we separated the impact of connectivity and MAC on the transmission of samples. A packet will be successfully received by a sink if the sensor node is connected to at least one sink and if no MAC failures occur. We now analyze the two terms that appear in (4). PCON (x, y) represents the probability that the sensor is not isolated (i.e., it receives a sufficiently strong signal from at least one sink), which is computed in [16] for a scenario analogous to the one considered here (e.g., squared and rectangular areas). This probability decreases as the sensor approaches the borders (border effects). Specifically, since the position of the sensor is in general unknown, Ps|k (x, y) of (4) can be deconditioned as follows: Ps|k = Ex,y [Ps|k (x, y)] = Ex,y [PCON (x, y)] · En [PMAC (n)].
(5)
It is also shown in [16] that border effects are negligible when Aσ < 0.1A. In this case the following holds: PCON (x, y) ≃ PCON = 1 − e−µsink ,
(6)
Area Throughput of an IEEE 802.15.4 Based Wireless Sensor Network
7
where µsink = ρ0 Aσ = IAσ /A is the mean number of audible sinks on an infinite plane from any position [21]. Throughout this paper we assume that connectivity is not affected by border effects. However, in case it is, the approach remains completely valid: only the computation of Ex,y [PCON (x, y)] requires greater efforts (see [16]). PMAC (n), n ≥ 1, is the probability of successful transmission when n − 1 interfering sensors are present. It accounts for MAC issues and is treated in Section 5 for the particular case of the IEEE 802.15.4 standard, even though the model is applicable to any MAC protocol. For now we only emphasize that it is a monotonic decreasing function of the number, n, of sensors which attempt to connect to the same serving sink. This number is in general a random variable in the range [0, k]. In fact, note that in (4) there is no explicit dependence on k, except for the fact that n ≤ k must hold. Moreover in our case we assume 1 ≤ n ≤ k, as there is at least one sensor competing for access with probability PCON (6). In [22], Orriss et al. showed that the number of sensors uniformly distributed on an infinite plane that hear one particular sink as the one with the strongest signal power (i.e., the number of sensors competing for access to such sink) is Poisson distributed with mean n ¯ = µs
1 − e−µsink , µsink
(7)
with µs = ρs Aσ being the mean number of sensors that are audible by a given sink. Such a result is relevant toward our goal even though it was derived on the infinite plane. In fact, when border effects are negligible (i.e., Aσ < 0.1A) and k is large, n can still be considered Poisson distributed. The only two things that change are: – n is upper bounded by k (i.e., the pdf is truncated) – the density ρs is to be computed as the ratio k/A [m−2 ], thus yielding µs = k AAσ . Therefore, we assume n ∼ Poisson(¯ n), with n ¯=n ¯ (k) = k
Aσ 1 − e−µsink 1 − e−IAσ /A =k . A µsink I
(8)
Finally, by making the average in (5) explicit and by means of (6), we get Ps|k = (1 − e−IAσ /A ) · where M= is a normalizing factor.
k 1 X n ¯ n e−¯n PMAC (n) , M n=1 n!
k X n ¯ n e−¯n n! n=1
(9)
(10)
8
4.2
Chiara Buratti, Flavio Fabbri and Roberto Verdone
Area Throughput
The amount of data samples generated by the network as response to a given query is equal to the number of sensors, k, that are present and active when the query is received. As a consequence, the average number of data samples-per¯ in the queried query generated by the network is the mean number of sensors, k, area. Now denote by G the Offered Load, that is the average number of data samples generated per unit of time, given by 1 G = k¯ · fq = ρs · A · [samples/sec]. Tq
(11)
From (11) we have k¯ = GTq . The average amount of data received by the infrastructure per unit of time (Area Throughput ), S, is given by: S=
+∞ X
S(k) · gk [samples/sec],
(12)
k=0
where S(k) = Tkq Ps|k , gk as in (1) and Ps|k as in (9). Finally, by means of (9), (10) and (11), equation (12) may be rewritten as S=
1 − e−IAσ /A Tq Pk n +∞ n ¯ n e−¯ X (GTq )k e−GTq n=1 PMAC (n) n! · · . Pk n¯ n e−¯n (k − 1)! n=1 k=1
5
(13)
n!
The IEEE 802.15.4 MAC protocol
In this Section we introduce the two mathematical models used to derive the success probability, PMAC (n), when an IEEE 802.15.4 single-sink scenario, is considered. Both Beacon-Enabled and Non Beacon-Enabled modes are studied here (see the standard [5]). In [17, 18] an analytical model of the IEEE 802.15.4 Non Beacon-Enabled mode, was presented. For details on the protocol we refer to the standard as well. Here, we just want to underline that a maximum number of times a node can try to access the channel and perform the backoff algorithm, N Bmax = 4, is imposed. According to this, there will be a maximum delay affecting a packet transmission. In [17, 18] it is shown that, in case nodes transmit packets of size D · 10 Bytes, the maximum interval of time between the instant at which a node receives the query and the instant at which the sink receives the end of the packet is equal to (120 + D) · T . Moreover, since the time needed to transmit the query is equal to 6 · T (being the query size 60 Bytes), the maximum delay with which the sink may receive a packet will be equal to (126 + D) · T . Therefore,
Area Throughput of an IEEE 802.15.4 Based Wireless Sensor Network
9
to ensure that all nodes have finished the CSMA/CA algorithm, the sink should set Tq ≥ (126 + D) · T . However, no constraints are imposed on the values of Tq in this modality, therefore lower values of Tq should be used (see Figure 2, above part). If a node receives a new query, when it is still trying to access the channel, the old packet will be lost, and the node will take a new sample and will start again the CSMA/CA algorithm. For what concerns the Beacon-Enabled mode, the model described in [19] is used here to derive PMAC (n). According to this mode, the access to the channel is managed through a superframe, starting with a packet, called beacon, transmitted by the sink. In our scenario, the beacon includes the query. The superframe is composed of 16 slots and is divided into two parts: a Contention Access Period (CAP), during which nodes use a slotted CSMA/CA, and a Contention Free Period (CFP), containing a number of Guaranteed Time Slots (GTSs), that can be allocated by the sink to specific nodes (see Figure 2, below part). We denote as NGT S the number of GTSs allocated by the sink to specific nodes in the PAN. The superframe duration, SD, depends on the value of an integer parameter ranging from 0 to 14, called Superframe Order, SO, and given by: SD = 16 · 60 · 2SO Ts ;
(14)
where 60 · 2SO Ts is the slot size, and Ts =16µsec is the symbol time. Since the queries coincide with beacons in this case, Tq must be equal to SD. Therefore, Tq may assume only a finite set of values, depending on SO. Note that by increasing SO, the time nodes are given to try to access the channel also increases, but the query frequency is smaller. The sink may allocate up to seven GTSs, and a GTS may occupy more than one slot. However, a sufficient portion of the superframe must remain for contention-based access. The minimum CAP duration is equal to 440 Ts . In case a node accessing the channel through the CSMA/CA algorithm does not succeed in accessing the channel by the end of the CAP portion, its packet will be lost. By changing the packet size (i.e., D) and the slot size (i.e., SO), the number of slots occupied by each GTS and the maximum number of GTSs that can be allocated, vary. As an example, when D = 2 the packet occupies one slot, whatever SO and, therefore, the sink may allocate up to seven GTSs. In the case D = 10, instead, a packet occupies four slots when SO = 0, two slots when SO = 1, and one slot when SO ≥ 2. Therefore, a maximum number of two, six and seven GTSs may be allocated in the three cases, respectively. In this Section we show some results obtained through our mathematical model, considering a single-sink scenario, where n sensors transmit data to the sink through a direct link, with no connectivity problems. A finite state transition diagram is used to model sensor nodes states, in both cases Beacon- and Non Beacon-Enabled mode. Through the analysis of this diagram the probability that a given sensor successfully transmits its packet, PMAC (n), is evaluated. We do not report here the expression of this probability, owing to its complexity, but we refer to [17, 18] for the Non Beacon-Enabled case and to [19] for the Beacon-Enabled case, where details on formulae are given and where a validation
10
Chiara Buratti, Flavio Fabbri and Roberto Verdone
of the model, through comparison with simulations, is provided for n ≤ 50. The probability PMAC (n) obtained in these works, can be used in (13) for the evaluation of S. In Figures 3 and 4 PMAC as functions of n, for different values of SO, having fixed D = 2 and D = 10, are shown, respectively. The cases of no GTSs allocated and NGT S equal to the maximum number of GTSs allocable, are considered. As explained above, this maximum number depends on the values of D and SO. In these Figures the Beacon-Enabled mode is analysed. As we can see, PMAC decreases monotonically (for n > 1 when NGT S = 0 and for n > NGT S when NGT S > 0), by increasing n, since the number of sensors competing for the channel increases. In both Figures, once we fix SO, by increasing NGT S , PMAC increases, since less nodes have to compete for the channel. Moreover, once we fix NGT S , by increasing SO, PMAC gets larger, since increases the CAP size and nodes have more time to try to access the channel. In Figure 5 PMAC (n) as functions of n, for different values of D and Tq , is shown, considering a Non Beacon-Enabled network. As we can see, a decrease of Tq , results in a decreasing of PMAC , since nodes have less time to access the channel. However, the decreasing of Tq brings to an increasing of the queries frequency, and this impacts on the Area Throughput (see Section 6). Non BE mode Query
Query
Query
CSMA/CA
CSMA/CA
Tq
Tq BE mode
Beacon/ Query
CSMA/CA
Beacon/ Query
CFP
CAP
G T S
G T S
G T S
G T S
G T S
G T S
G T S
NGTS GTSs allocated
SD = Tq
Fig. 2. Above part: The IEEE 802.15.4 Non Beacon-Enabled mode. Below part: The IEEE 802.15.4 Beacon-Enabled mode.
6
Numerical Results
In this Section the behavior of the Area Throughput as a function of the Offered Load, G, for the Beacon- and the Non Beacon-Enabled modes, considering different values of D, SO, NGT S , Tq and different connectivity levels, is shown.
Area Throughput of an IEEE 802.15.4 Based Wireless Sensor Network
11
1 SO=0, N
=0
SO=0, N
=7
SO=1, N
=0
SO=1, N
=7
SO=2, N
=0
SO=2, N
=7
GTS GTS
0.9
GTS GTS
0.8
GTS GTS
0.7
P
MAC
0.6
0.5 SO=2 0.4
SO=0
0.3
SO=1
0.2
0.1
0
0
5
10
15
20
25 n
30
35
40
45
50
Fig. 3. PM AC (n) as a function of n, in the Beacon-Enabled case, for different values of SO and NGT S , having fixed D = 2.
Validation of the framework via simulation is not reported here for a matter of space. However, the validation of connectivity and MAC models separately may be found in [23] and [18, 19], respectively. Let us consider a square domain, having area A = 106 m2 , where an average number of 10 sinks are distributed according to a PPP (I = 10). We also set k0 = 40 dB, k1 = 13.03, σ = 4 dB (the values are taken from experimental measurements made on the field with Freescale devices [24]) and Lth = 107 dB. In Figures 6 and 7, S as a function of G, when varying SO, NGT S and Tq , for D = 2 and D = 10, is shown, respectively. The input parameters that we entered give a connection probability PCON = 0.89. Both Beacon- and Non Beacon-Enabled modes are considered. In both Figures we note that, once SO is fixed (Beacon-Enabled case), an increase of NGT S results in an increment of S, since PMAC increases. Moreover, once NGT S is fixed, there exists a value of SO maximising S. When D = 2, an increase of SO results in a decrement of S since, even though PMAC gets greater, the query interval is longer and, therefore, the number of samples per second received by the sink decreases. On the other hand, when D = 10 and all possible GTSs are allocated, the optimum value of SO is 1. This is due to the fact that, having large packets, when SO = 0 too many packets are lost, owing to the short duration of the superframe. However, when NGT S = 0 the best case is, once again, SO = 0, since in this case MAC losses are approximately the same obtained in the case of SO = 1 (see Figure 4), which, however, brings to a higher query interval. In conclusion, we can deduce that the
12
Chiara Buratti, Flavio Fabbri and Roberto Verdone
1 SO=0, N
=0
SO=0, N
=2
SO=1, N
=0
SO=1, N
=6
SO=2, N
=0
SO=2, N
=7
GTS GTS
0.9
GTS GTS
0.8
GTS GTS
0.7
P
MAC
0.6
0.5
0.4
SO=1
SO=0
0.3
SO=2
0.2
0.1
0
0
5
10
15
20
25 n
30
35
40
45
50
Fig. 4. PM AC (n) as a function of n, in the Beacon-Enabled case, for different values of SO and NGT S , having fixed D = 10.
use of GTSs is always advantageous, and that there exists an optimum value of SO maximising S, which depends on D and NGT S . Concerning the Non Beacon-Enabled case, in both Figures we note that, by decreasing Tq , S gets larger even though PMAC decreases, since, once again, the MAC losses are balanced by larger values of fq . By comparison of Figures 6 and 7, we note that, once the Offered Load, G, is fixed, S gets notably smaller when D increases. S, in fact, is expressed in terms of samples/sec received by the sink, and not in Bytes/sec. Therefore, once Tq is fixed, by increasing D, PMAC gets smaller. On the other hand, by increasing D, the maximum value of S is reached for lower values of G. This means that, when D is small, the maximum value of S is reached at the cost of deploying more sensors. Finally, we show the effects of connectivity on the Area Throughput. When PCON is less than 1, only a fraction of the deployed nodes has a sink in its vicinity. In particular, an average number, k¯ = PCON GTq /I, of sensors compete for access at each sink. In Figure 8 we consider the Non Beacon-enabled case with D = 2, Tq = 128T and D = 10, Tq = 136T . When D = 10, Tq = 136T , for high Offered Loads the area throughput tends to decay, since packet collisions dominate. Hence, by moving from PCON = 1 to PCON = 0.89, we observe a slight improvement due to the fact that a smaller average number of sensors tries to connect to the same sink. Conversely, when D = 2, Tq = 128T , S is still increasing with G, then by moving from PCON = 1 to PCON = 0.89, we just reduce the useful traffic. Furthermore, when PCON = 0.15, the Offered Load
Area Throughput of an IEEE 802.15.4 Based Wireless Sensor Network
13
1 D=10, Tq=136T D=10, Tq=76T D=10, Tq=56T D=2, Tq=128T D=2, Tq=38T D=2, Tq=58T
0.9
0.8
0.7
P
MAC
0.6
0.5
0.4
0.3
0.2
0.1
0
0
5
10
15
20
25 n
30
35
40
45
50
Fig. 5. PM AC (n) as a function of n, in the Non Beacon-Enabled case, for different values of Tq and D.
is very light, so that we are working in the region where PMAC (D = 2, Tq = 128T ) < PMAC (D = 10, Tq = 136T ) (see Fig. 5), resulting in a slightly better performance of the case with D = 2. Thus we conclude that the effect of lowering PCON results in a stretch of the curves reported in the previous plots.
7
Conclusions
An IEEE 802.15.4 standard compliant multi-sink WSN where sensor nodes transmit their packets to a sink selected among many, is studied. A mathematical framework is developed to evaluate the Area Throughput, that is the amount of samples per second successfully transmitted to the sinks. The behavior of the Area Throughput for Beacon-Enabled and Non Beacon-Enabled networks, by considering different packet sizes, number of GTSs allocated, and queries frequency, is shown. Results show that the use of GTSs improves performance of the Beacon-Enabled mode and that thanks to these GTSs this mode outperforms the Non Beacon-Enabled mode. Moreover, results show that there exists a value of SO maximising the Area Throughput and this value depends on D and NGT S . Finally, the effects of the connectivity on the Area Throughput are evaluated. Results show that when connectivity decreases, the number of sensors that must be deployed to obtain large Area Throughput, increases.
14
Chiara Buratti, Flavio Fabbri and Roberto Verdone
BE S0=0, N
=0
BE S0=0, N
=7
BE S0=1, N
=0
BE S0=1, N
=7
BE S0=2, N
=0
BE S0=2, N
=7
GTS
12000
GTS GTS GTS GTS
10000
SO=0
GTS
Non BE Tq=128T Non BE Tq=38T Non BE Tq=58T
S(G) [samples/sec]
8000
6000
4000
2000
0
SO=1
0
2000
4000
6000
8000
10000 12000 G [samples/sec]
SO=2
14000
16000
18000
Fig. 6. S as a function of G, for the Beacon- and Non Beacon-Enabled cases, by varying SO, NGT S and Tq , having fixed D = 2.
8
Acknowledgment
This work has been supported by the EC-funded Network of Excellence NEWCOM++.
References 1. I. F. Akyildiz, W. Su, Y. Sankarasubramaniam, E. Cayirci, “A Survey on Sensor Networks,” IEEE Communications Magazine, Aug. 2002, 102-114. 2. R. Verdone, D. Dardari, G. Mazzini, A. Conti, Wireless sensor and actuator networks, Elsevier, first ed., 2008. 3. D. Dardari, A.Conti, C. Buratti and R. Verdone, “Mathematical evaluation of environmental monitoring estimation error through energy-efficient Wireless Sensor Networks,” IEEE Transaction on Mobile Computing, vol. 6, n. 7, July 2007, pag. 790-803. 4. C. Buratti, R. Verdone, “A Hybrid Hierarchical Architecture: From a Wireless Sensor Network to the Fixed Infrastructure,” IEEE EW2008, 22-25 June 2008, Prague, Czech Republic. 5. IEEE 802.15.4: Wireless Medium Access Control (MAC) and Physical Layer (PHY) Specifications for Low-Rate Wireless Personal Area Networks (LR-WPANs), IEEE, 2003. Wei Ye. 6. P. Stuedi, O. Chinellato, G. Alonso, “Connectivity in the presence of Shadowing in 802.11 Ad Hoc Networks,” IEEE WCNC 2005. 7. C. Buratti, R. Verdone, “On the of Cluster Heads minimising the Error Rate for a Wireless Sensor Network using a Hierarchical Topology over IEEE802.15.4,” IEEE PIMRC 06, Helsinki, FI, 11-14 Sept, 2006.
Area Throughput of an IEEE 802.15.4 Based Wireless Sensor Network
15
6000 BE S0=0, N
=0
BE S0=0, N
=2
BE S0=1, N
=0
BE S0=1, N
=6
BE S0=2, N
=0
BE S0=2, N
=7
GTS
SO=1
GTS
SO=0
GTS
5000
GTS GTS GTS
Non BE Tq=136T Non BE Tq=76T Non BE Tq=56T
S(G) [samples/sec]
4000
3000
2000
SO=2
1000
0
0
2000
4000
6000
8000 10000 G [samples/sec]
12000
14000
16000
18000
Fig. 7. S as a function of G, for the Beacon- and Non Beacon-Enabled cases, by varying SO, NGT S and Tq , having fixed D = 10.
5000 Pcon=0.89 Pcon=1 Pcon=0.15
4500
4000
D=2, Tq=128T
S(G) [samples/sec]
3500
3000
2500
D=10, Tq=136T
2000
1500
1000
500
0
0
0.2
0.4
0.6
0.8
1 1.2 G [samples/sec]
1.4
1.6
1.8
2 4
x 10
Fig. 8. S as a function of G, in the Non Beacon-Enabled case, for different values of D and PCON , having fixed Tq to the maximum delay.
8. C. Bettstetter, “On the minimum node degree and connectivity of a wireless multihop network,” Proc. ACM Symp. on Mobile Ad Hoc Networks and Comp (Mobihoc),
16
Chiara Buratti, Flavio Fabbri and Roberto Verdone
Jun. 2002. 9. Z. Vincze, R. Vida, and A. Vidacs, “Deploying multiple sinks in multi-hop wireless sensor networks,” IEEE International Conference on Pervasive Secrices, 15-20 July 2007, pp. 55-63. 10. T. O. Kim, J. S. Park, K. J. Kim, and B. D. Choi, “Analytical Model of IEEE 802.15.4 Non-beacon Mode with Download Traffic by the Piggyback Methods,” International Federation for Information Processing 2007, pp. 435-444, 2007. 11. J. Misic, S. Shafi, V. B. Misic, “Maintaining Reliability Through Activity Management in an 802.15.4 Sensor Cluster,” IEEE Transactions on Vehicular Technology, Vol. 55, No. 3, May 2006, pages: 779-788. 12. S. Pollin, M. Ergen, S.C. Ergen, B. Bougard, L. Van der Pierre, F. Catthoor, I. Moerman, A. Bahai, P. Varaiya, “Performance Analysis of Slotted Carrier Sense IEEE 802.15.4 Medium Access Layer,” Proceeding of GLOBECOM, 2006, San Francisco, California, November 27 - December 1. 13. T.R. Park, T.H. Kim, J.Y. Choi, S. Choi and W.H. Kwon, “Throughput and energy consumption analysis of IEEE 802.15.4 slotted CSMA/CA,” IEEE Electronics Letters, vol. 41, issue 18, pp. 1017-1019, Sept. 2005. 14. Z. Chen, C. Lin, H. Wen, H. Yin, “An analytical model for evaluating IEEE 802.15.4 CSMA/CA protocol in Low rate wireless application,” Proceedings of IEEE AINAW 2007. 15. G. Bianchi, “Performance Analysis of the IEEE 802.11 Distributed Coordination Function,” IEEE Journal on Selected Areas in Communications, Vol. 18, n. 3, March 2000. 16. Flavio Fabbri, Roberto Verdone, “A statistical model for the connectivity of nodes in a multi-sink wireless sensor network over a bounded region,” IEEE EW2008, 22-25 June 2008, Prague, Czech Republic. 17. Chiara Buratti, Roberto Verdone, “Performance Analysis of IEEE 802.15.4 NonBeacon Enabled Mode,” to appear in IEEE Transactions on Vehicular Technologies (TVT). 18. Chiara Buratti, Roberto Verdone, “ A Mathematical Model for Performance Analysis of IEEE 802.15.4 Non-Beacon Enabled Mode,” IEEE EW2008, 22-25 June 2008, Prague, Czech Republic. 19. Chiara Buratti, “A Mathematical Model for Performance of IEEE 802.15.4 BeaconEnabled Mode,” submitted to IEEE ICC 09. 20. Roberto Verdone, Flavio Fabbri, Chiara Buratti, “Area Throughput for CSMA Based Wireless Sensor Network,” IEEE PIMRC 08, September 15-18, Cannes, France. 21. J. Orriss and S. K. Barton, “Probability distributions for the number of radio transceivers which can communicate with one another,”IEEE Trans. Commun., vol. 51, no. 4, pp. 676-681, Apr. 2003. 22. R. Verdone, J. Orriss, A. Zanella, S. Barton, “Evaluation of the blocking probability in a cellular environment with hard capacity: a statistical approach,” Personal, Indoor and Mobile Radio Communications (PIMRC 02), 2002. vol. 2, 15-18 Sept. 2002. 23. F. Fabbri, C. Buratti, R. Verdone, “A Multi-Sink Multi-Hop Wireless Sensor Network Over a Square Region: Connectivity and Energy Consumption Issues,” Wireless Mesh and Sensor Networks Workshop at GLOBECOM’08, 2008, 30 Nov-4 Dec, New Orleans, LA, USA. 24. Freescale, “Freescale semiconductors mc13192 developers kit,” [Online], Available: http://www.freescale.com/webapp/sps/site/prodsummary.jspcode=13193EVB