Approximation-based Feature Selection and Application for Algae Population Estimation Qiang Shen and Richard Jensen {qqs,rkj}@aber.ac.uk Department of Computer Science, The University of Wales, Aberystwyth, UK
Abstract This paper presents a data-driven approach for feature selection to address the common problem of dealing with high-dimensional data. This approach is able to handle the real-valued nature of the domain features, unlike many existing approaches. This is accomplished through the use of fuzzy-rough approximations. The paper demonstrates the effectiveness of this research by proposing an estimator of algae populations, a system that approximates, given certain water characteristics, the size of algae populations. This estimator significantly reduces computer time and space requirements, decreases the cost of obtaining measurements and increases runtime efficiency, making itself more viable economically. By retaining only information required for the estimation task, the system offers higher accuracy than conventional estimators. Finally, the system does not alter the domain semantics, making any distilled knowledge human-readable. The paper describes the problem domain, architecture and operation of the system, and provides and discusses detailed experimentation. The results show that algae estimators using a fuzzy-rough feature selection step produce more accurate predictions of algae populations in general.
Keywords Feature evaluation and selection; Data-driven knowledge acquisition; Classification; Fuzzy-rough sets; Algae population estimation.
1
Introduction
Environmental issues have garnered a lot of attention in the last decade. Toxic and non-toxic waste production from a large variety of industrial plants and manufacturing processes is one of the most important areas. The future of humanity’s food and water supply are influenced by this directly. Hence, extreme care has to be taken in order to maintain the balance. It has also become clear that changes in farming and sewage water treatment can affect the ecology and chemistry of rivers and lakes. Of particular interest are the communities of algae that flourish in such conditions. These communities are detrimental to water clarity and can endanger complex water life due to the resulting change in oxygen content. Human activities can also be affected due to the toxic effects present in relation to algae growth. For example, cyanobacterial toxins are the naturally produced poisons stored in the cells of 1
certain species of blue-green algae (cyanobacteria). These toxins fall into various categories. Some are known to attack the liver (hepatotoxins) or the nervous system (neurotoxins); others simply irritate the skin. These toxins cannot be treated by boiling water or typical forms of home water treatment. Each of the many different species of alga have their own characteristics, responding very rapidly to changes in their environment. Ecologies where algae are present are thus heavily dependent on adequate chemical and physical balance in the environment. This has led to much active research interest concerning the impact that manufacturing, farming, and waste disposal have on nutrient content in rivers and how this can be combatted. An intelligent, automated tool for this task would be highly desirable, locating the parameters that control fluctuations in algae population and using this information to estimate changes. Such a system could aid in a number of areas, including simulating hypothetical scenarios and predicting trends in algae communities, in addition to its intended estimation task. The collection of chemical concentration measurements in the water would be greatly simplified as a result of this tool. Only those tests that are absolutely necessary need to be conducted, simplifying the testing process itself. An additional advantage of such a system is that the entire process would be decentralized, enabling individual testers to take samples and obtain results in situ. This would in turn reduce the cost associated with these measurements, and minimize response times. Both the complexity of the estimation task and the inter-related nature of the chemicals diluted in the water suggest that knowledge acquisition could be an obstacle for the system. Eliciting knowledge from any source of data is notorious for its difficulty. Whether the source of information is a human expert, or a dataset of experimental measurements, extracting general knowledge from it is a serious bottleneck in the development of a knowledge-based system in general. Domain complexity typically adds a lot of difficulty to the knowledge acquisition process. Real-life application domains often yield complex data possessing a large number of attributes - many of which will be superfluous for the task at hand. In fact, their presence has detrimental effects on data-driven knowledge acquisition and machine learning software. Such effects range from a drastic reduction in training speed to rendering knowledge acquisition intractable for the domain. This also affects the runtime of the system. Having additional quantities to measure tends to be a slow, error-prone and cost-ineffective situation. In addition, unknown, unavailable or inaccurate values cannot be ruled out,
2
while instruments inevitably develop faults of their own, and the humans reading them are not infallible. The absence of experts to interpret and check the data often proves to be another problem. These factors motivate the inclusion of a feature selection step [6, 20]. Feature selection has been shown to be highly useful in reducing dimensionality whilst preserving the underlying meaning of the features involved [7, 19]. This paper proposes a feature selector that utilizes fuzzy-rough approximations. The resulting feature selection technique is able to handle continuous-valued domain features, unlike most techniques in this area, and so no discretization needs to be performed. Further, it presents an algae population estimator that incorporates such a feature reducer to determine the population of several species of river algae, based on physical and chemical water measurements. The aim of the system is to induce classifiers from historical data pertaining to the distribution of algae as a function of the above measurements. There exists a number of approaches relevant to the task at hand, both from the point of view of applications and that of computational methods. For example, the FAPACS (Fuzzy Automatic Pattern Analysis and Classification System) algorithm documented in [1, 3] is able to discover fuzzy association rules in relational databases. It works by locating pairs of features that satisfy an ‘interestingness’ measure that is defined in terms of an adjusted difference between the observed and expected values of relations. This algorithm is capable of expressing linguistically both the regularities and the exceptions discovered within the data. Modifications to the Fuzzy ID3 (itself an augmentation of Quinlan’s original ID3 [25]) rule induction algorithm have been documented [13] to better support learning. In a similar attempt, [15] has proposed modifications to decision trees to combine traditional symbolic techniques with approximate reasoning, offered by fuzzy representation. This approach redefines the methodology for knowledge inference, resulting in a method best suited to relatively stationary problems. A common disadvantage of these techniques is their sensitivity to high dimensionality. This may be remedied using conventional work such as Principal Components Analysis (PCA) [8, 12]. Unfortunately, although efficient, PCA irreversibly destroys the underlying semantics of the feature set. Further reasoning about the derivation from transformed principal features is almost always humanly impossible. Fuzzy-rough feature selection (FRFS) described in this paper is an approach to dimensionality reduction that preserves the underlying semantics of the data while offering reasonable generality. The modularity of the framework is such that FRFS may be used with numerous data-driven categorization or prediction
3
algorithms, in addition to the application problem addressed here. The rest of this paper is structured as follows. Section 2 introduces the application domain (which serves as a vehicle to demonstrate the potential of the underlying approach for feature selection), discussing issues pertaining to the estimation of algae population fluctuation. The theoretical background and the major components of the system are then detailed in sections 3 and 4, respectively. Experiments are then discussed, and results are shown and analyzed in section 5. Following this, the paper is concluded and details of further work are given.
2
Application Domain
As stated previously, the aim of developing the system is to estimate the concentration of various different types of river alga, based on a set of chemical concentrations and other parameters [11]. To build the knowledge base, training samples were taken from different European rivers over the period of one year. These samples were analyzed to quantify the presence of several chemicals, including nitrates, nitrites and ammonia, phosphate, oxygen and chloride. The pH of the water was also measured. In addition, the algae population distributions for each of the species involved were determined in the samples. A number of additional factors were taken into account, such as the season, river size and flow rate. It is relatively easy to locate relations between one or two of these quantities and a species of algae. However, the process involves expertise in chemistry and biology and requires well-trained personnel and microscopic examination that cannot be automated given the state of the art. Thus, the process can become expensive and slow if too many microscopic examinations are required. There are complex relations at work between the attributes of this application domain, be they conditional or decision: algae may influence one another, as well as be influenced by the concentration of chemicals. As such, there is expected to be some redundancy in the data; an important reason for the present utilization of approximation-based feature selection. Note that the work proposed here is not to eliminate the need for trained personnel but to minimise the need for potentially costly measurements and the subsequent visual examinations. The algae estimation task had previously been attempted in [26]. The system, FuREAP, was reported to be a fuzzy-rough technique. However, this was not a true hybridization of fuzzy and rough sets, but merely a combination of separate processes that performed fuzzy rule induction and crisp rough set reduction. Additionally, the real-valued decision features were discretized, transforming the problem 4
into a classification task rather than the more challenging problem of prediction, tackled in this paper. The application domain requires the system to be able to estimate the populations of seven different species of alga based on eleven attributes of the river sample: • The time of year the sample was taken, given as a season, • The size of the river, • The flow rate of the water, and • Eight chemical concentrations, including nitrogen in the form of nitrates, nitrites, ammonia, phosphate, the pH of the water, oxygen and chloride. The dataset available for training includes 200 instances. The first three attributes of each instance (season, river size and flow rate) are represented as fuzzy linguistic variables. Chemical concentrations and algae population estimates are given as continuous quantities. The dataset includes a few samples with missing values, where a measurement have not been obtainable for the sample. Of the 200 instances, two exhibiting mostly unknown values were removed from the data because of their low quality. It is assumed that the river’s water is perfectly homogeneous and that any sample of the water, no matter how small, is statistically representative. A few drops of each sample are examined visually via microscope and the number of algae are counted. This can lead to errors in the collected data, which must somehow be handled sufficiently by future processing techniques. The use of fuzzy methods allows for such errors in determining the population, as well as the fact that a number of drops of water from a sample of a river are not necessarily statistically representative of the entire river.
3
Feature Selection
Due to the potential redundancy present in the data and its real-valued nature, fuzzy-rough feature selection was chosen to perform dimensionality reduction. This section briefly introduces rough set theory before detailing the fuzzy-rough approach.
3.1
Rough Set Feature Selection
Rough set theory [23] is an extension of conventional set theory that supports approximations in decision making. A rough set is itself the approximation of a vague concept (set) by a pair of precise concepts, called lower and upper approximations, which are a classification of the domain of interest into disjoint 5
categories. The lower approximation is a description of the domain objects which are known with certainty to belong to the subset of interest, whereas the upper approximation is a description of the objects which possibly belong to the subset. An information system can be viewed as a table of data, consisting of objects (rows in the table) and attributes (columns). In medical datasets, for example, patients might be represented as objects and measurements such as blood pressure, form attributes. The attribute values for a particular patient is their specific reading for that measurement. An information system may be extended by the inclusion of decision attributes. Such a system is termed a decision system. For example, the medical information system mentioned previously could be extended to include patient classification information, such as whether a patient is ill or healthy. More formally, I = (U, A) is an information system, where U is a non-empty set of finite objects (the universe of discourse) and A is a non-empty finite set of attributes such that a : U → Va for every a ∈ A. Va is the set of values that attribute a may take. For decision systems, A = {C ∪ D} where C is the set of input features and D is the set of class indices. Here, a class index d ∈ D is itself a variable d : U → {0, 1} such that for a ∈ U, d(a) = 1 if a has class d and d(a) = 0 otherwise.
3.2
Indiscernibility
With any P ⊆ A there is an associated equivalence relation IN D(P ): IN D(P ) = {(x, y) ∈ U2 | ∀ a ∈ P, a(x) = a(y)}
(1)
Note that this corresponds to the equivalence relation for which two objects are equivalent if and only if they have the same vectors of attribute values for the attributes in P . The partition of U, determined by IND(P) is denoted U/IN D(P ) or U/P , which is simply the set of equivalence classes generated by IN D(P ):
U/IN D(P ) = ⊗{U/IN D({a}) | a ∈ P },
(2)
A ⊗ B = {X ∩ Y | ∀X ∈ A, ∀Y ∈ B, X ∩ Y 6= ∅}
(3)
where
6
If (x, y) ∈ IN D(P ), then x and y are indiscernible by attributes from P . The equivalence classes of the indiscernibility relation with respect to P are denoted [x]P , x ∈ U.
3.3
Lower and Upper Approximations
Let X ⊆ U. X can be approximated using only the information contained within P by constructing the P-lower and P-upper approximations of the classical crisp set X:
P X = {x | [x]P ⊆ X}
(4)
P X = {x | [x]P ∩ X 6= ∅}
(5)
It is such a tuple hP X, P Xi that is called a rough set.
3.4
Positive, Negative and Boundary Regions
Let P and Q be equivalence relations over U, then the positive, negative and boundary regions are defined as:
P OSP (Q)
=
[
PX
(6)
X∈U/Q
[
N EGP (Q)
= U−
BN DP (Q)
[
PX
X∈U/Q
=
PX −
X∈U/Q
(7) [
PX
(8)
X∈U/Q
The positive region comprises all objects of U that can be classified to classes of U/Q using the information contained within attributes P. The boundary region, BNDP (Q), is the set of objects that can possibly, but not certainly, be classified in this way. The negative region, NEGP (Q), is the set of objects that cannot be classified to classes of U/Q.
3.5
Attribute Dependency and Significance
An important issue in data analysis is discovering dependencies between attributes. Intuitively, a set of attributes Q depends totally on a set of attributes P, denoted P ⇒ Q, if all attribute values from Q are uniquely determined by values of attributes from P. In rough set theory, dependency is defined in the following way:
7
For P, Q ⊂ A, it is said that Q depends on P in a degree k (0 ≤ k ≤ 1), denoted P ⇒k Q, if k = γP (Q) =
|P OSP (Q)| |U|
(9)
where |S| stands for the cardinality of set S. If k = 1, Q depends totally on P, if 0 < k < 1, Q depends partially (in a degree k) on P, and if k = 0 then Q does not depend on P . By calculating the change in dependency when an attribute is removed from the set of considered possible attributes, an estimate of the significance of that attribute can be obtained. The higher the change in dependency, the more significant the attribute is. If the significance is 0, then the attribute is dispensible without losing information. More formally, given P, Q and an attribute x ∈ P , the significance of attribute x upon Q is defined by
σP (Q, a) = γP (Q) − γP −{a} (Q)
3.6
(10)
Reducts
For many application problems, it is often necessary to maintain a concise form of the information system. One way to implement this is to search for a minimal representation of the original dataset. For this, the concept of a reduct is introduced and defined as a minimal subset R of the initial attribute set C such that for a given set of attributes D, γR (D) = γC (D). From the literature, R is a minimal subset if γR−{a} (D) 6= γR (D) for all a ∈ R. This means that no attributes can be removed from the subset without affecting the dependency degree. Hence, a minimal subset by this definition may not be the global minimum (a reduct of smallest cardinality). A given dataset may have many reduct sets, and the collection of all reducts is denoted by
Rall = {X | X ⊆ C, γX (D) = γC (D); γX−{a} (D) 6= γX (D), ∀a ∈ X}
(11)
The intersection of all the sets in Rall is called the core, the elements of which are those attributes that cannot be eliminated without introducing more contradictions to the representation of the dataset. For feature selection, a reduct of minimal cardinality is ideally searched for. That is, an attempt is to be made to locate a single element of the reduct set Rmin ⊆ Rall :
Rmin = {X | X ∈ Rall , ∀Y ∈ Rall , |X| ≤ |Y |}
8
(12)
The QuickReduct algorithm [5] attempts to calculate reducts for a decision problem (though the underlying approach can be applied to other tasks), without exhaustively generating all possible subsets. It starts off with an empty set and adds in turn, one at a time, those attributes that result in the greatest increase in the rough set dependency metric, until this produces its maximum possible value for the dataset.
3.7
Fuzzy-Rough Feature Selection
The crisp rough set-based feature selection (RSFS) process described previously can only operate effectively with datasets containing discrete values [34]. As most data contain real-valued features, it is necessary to perform a discretization step beforehand to use RSFS. This is typically implemented by standard fuzzification techniques [21]. However, membership degrees of feature values to fuzzy sets are not exploited in the process of dimensionality reduction when using RSFS. By employing fuzzy-rough sets, it is possible to use this information to better guide feature selection. 3.7.1
Fuzzy Equivalence Classes
In the same way that crisp equivalence classes are central to rough sets, fuzzy equivalence classes are central to the fuzzy-rough set approach [9, 14, 16, 22]. For typical applications, this means that the decision values and the conditional values may all be fuzzy. The concept of crisp equivalence classes can be extended by the inclusion of a fuzzy similarity relation S on the universe, which determines the extent to which two elements are similar in S. The usual properties of reflexivity (µS (x, x) = 1), symmetry (µS (x, y) = µS (y, x)) and transitivity (µS (x, z) ≥ µS (x, y) ∧ µS (y, z)) hold. Using the fuzzy similarity relation, the fuzzy equivalence class [x]S for objects close to x can be defined [14]: µ[x]S (y) = µS (x, y)
(13)
The following axioms should hold for a fuzzy equivalence class F : • ∃x, µF (x) = 1 • µF (x) ∧ µS (x, y) ≤ µF (y) • µF (x) ∧ µF (y) ≤ µS (x, y) The first axiom corresponds to the requirement that an equivalence class is non-empty. The second axiom states that elements in y’s neighbourhood are in the equivalence class of y. The final axiom states 9
that any two elements in F are related via the fuzzy similarity relation S. Obviously, this definition degenerates to the normal definition of equivalence classes when S is non-fuzzy. The family of normal fuzzy sets produced by a fuzzy partitioning of the universe of discourse can play the role of fuzzy equivalence classes [9]. Consider the crisp partitioning of a universe of discourse, U, by the attributes in Q: U/Q = {{1,3,5},{2,4,6}}. This contains two equivalence classes ({1,3,5} and {2,4,6}) that can be thought of as degenerated fuzzy sets, with those elements belonging to the class possessing a membership of one, zero otherwise. For the first class, for instance, the objects 2, 4 and 6 have a membership of zero. Extending this to the case of fuzzy equivalence classes is straightforward: objects can be allowed to assume membership values, with respect to any given class, in the interval [0,1]. U/Q is not restricted to crisp partitions only; fuzzy partitions are equally acceptable. 3.7.2
Fuzzy Lower and Upper Approximations
The fuzzy lower and upper approximations are fuzzy extensions of their crisp counterparts. Informally, in crisp rough set theory, the lower approximation of a set contains those objects that belong to it with certainty. The upper approximation of a set contains the objects that possibly belong to that set. From the literature, the fuzzy P -lower and P -upper approximations are defined as [9]:
µP X (Fi ) = infx max{1 − µFi (x), µX (x)} ∀i
(14)
µP X (Fi ) = supx min{µFi (x), µX (x)} ∀i
(15)
where Fi denotes a fuzzy equivalence class belonging to U/P which in turn stands for the partition of the universe of discourse, U, with respect to a given subset P of features. For an individual feature, a, the partition of the universe by a (denoted U/a) is considered to be the set of those fuzzy equivalence classes for that feature. For example, if the two fuzzy sets Na and Za are generated for feature a during fuzzification, the partition U/a = {Na , Za }. If the fuzzy-rough feature selection process is to be useful, it must be able to deal with multiple features, finding the dependency between various subsets of the original feature set. For instance, it may be necessary to be able to determine the degree of dependency of the decision feature(s) with respect to feature set P = {a, b}. In the crisp case, U/P contains sets of objects grouped together that are indiscernible according to both
10
features a and b. In the fuzzy case, objects may belong to many equivalence classes, so the cartesian product of U/a and U/b must be considered in determining U/P . In general,
U/P = ⊗{a ∈ P : U/a}
(16)
where ⊗ represents the operator for recursive set cross product. For example, if P = {a, b}, U/a = {Na , Za } and U/b = {Nb , Zb }, then U/P = {Na ∩ Nb , Na ∩ Zb , Za ∩ Nb , Za ∩ Zb } Clearly, each set in U/P denotes an equivalence class. The extent to which an object belongs to such an equivalence class is therefore calculated by using the conjunction of constituent fuzzy equivalence classes, say Fi , i = 1, 2, ..., n:
µF1 ∩...∩Fn (x) = min(µF1 (x), µF2 (x), ..., µFn (x))
(17)
The definitions given in equations (14) and (15) diverge a little from the crisp upper and lower approximations, as the memberships of individual objects to the approximations are not explicitly available. As a result of this, the fuzzy lower and upper approximations are redefined as [27]:
µP X (x) = sup min(µF (x), inf max{1 − µF (y), µX (y)}) F ∈U/P
y∈U
µP X (x) = sup min(µF (x), sup min{µF (y), µX (y)})
(18)
(19)
y∈U
F ∈U/P
In implementation, not all y ∈ U are needed to be considered - only those where µF (y) is non-zero, i.e. where object y is a fuzzy member of (fuzzy) equivalence class F . Note that although the universe of discourse in feature reduction is finite, this is not the case in general, hence the use of sup and inf above. The tuple < P X, P X > is called a fuzzy-rough set. 3.7.3
Fuzzy-Rough Reduction Process
Fuzzy-Rough Feature Selection builds on the notion of the fuzzy lower approximation to enable reduction of datasets containing real-valued features. As will be shown, the process becomes identical to the crisp approach when dealing with nominal well-defined features.
11
The crisp positive region in the standard rough set theory is defined as the union of the lower approximations. By the extension principle [35], the membership of an object x ∈ U, belonging to the fuzzy positive region can be defined by
µP OSP (Q) (x) = sup µP X (x)
(20)
X∈U/Q
Object x will not belong to the positive region only if the equivalence class it belongs to is not a constituent of the positive region. This is equivalent to the crisp version where objects belong to the positive region only if their underlying equivalence class does so. Using the definition of the fuzzy positive region, a new dependency function between a set of features Q and another set P can be defined as follows:
γP′ (Q) =
|µP OSP (Q) (x)| = |U|
P
x∈U
µP OSP (Q) (x) |U|
(21)
As with crisp rough sets, the dependency of Q on P is the proportion of objects that are discernible out of the entire dataset. In the present approach, this corresponds to determining the fuzzy cardinality of µP OSP (Q) (x) divided by the total number of objects in the universe. FRQuickReduct(C,D). C, the set of all conditional features; D, the set of decision features. ′ ′ (1) R ← {}, γbest ← 0, γprev ←0 (2) do (3) T ←R ′ ′ (4) γprev ← γbest (5) ∀x ∈ (C − R) ′ (6) if γR∪{x} (D) > γT′ (D) (7) T ← R ∪ {x} ′ (8) γbest ← γT′ (D) (9) R←T ′ ′ (10) until γbest = γprev (11) return R
Figure 1: The fuzzy-rough QuickReduct algorithm.
A new QuickReduct algorithm, based on the crisp version [26], has been developed as given in figure 1. It employs the new dependency function γ ′ to choose which features to add to the current reduct candidate. The algorithm terminates when the addition of any remaining feature does not increase the dependency. As with the original algorithm, for a dimensionality of n, the worst case dataset will
12
result in (n2 + n)/2 evaluations of the dependency function. However, as fuzzy-rough set-based feature selection is used for dimensionality reduction prior to any involvement of the system which will employ those features belonging to the resultant reduct, this operation has no negative impact upon the run-time efficiency of the system. Conventional hill-climbing approaches to feature selection such as the algorithm presented above often fail to find maximal data reductions or minimal reducts. Some guiding heuristics are better than others for this, but as no perfect heuristic exists there can be no guarantee of optimality. When maximal data reductions are required, other search mechanisms must be employed. Although these methods also cannot ensure optimality, they provide a means by which the best feature subsets might be found [16].
4
System Overview
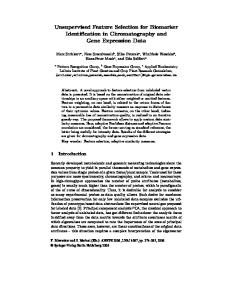
A block diagram of the system is presented in figure 2, showing both the training and runtime stages of the system.
Figure 2: Modular decomposition of the implemented system.
During the training stage, seven unreduced datasets (one per alga species) of eleven conditional attributes each are obtained from water samples. The datasets are reduced with FRFS to obtain seven datasets with (on average) seven conditional attributes each. These are then provided to the classifier, which induces seven models (one for each species of alga). 13
During runtime, the water samples are analyzed to obtain only seven (on average) of the original eleven conditional attributes, as per the reduct set chosen by FRFS. This simplifies, speeds up and reduces the costs associated with the data gathering stage. In running experimental simulations, these new seven-attribute datasets are used by classifiers to provide the system’s user with estimations of the seven algae populations.
4.1
Predictors
To facilitate a careful experiment-based analysis of the present work, five predictors were used to estimate the algae populations [33]: standard linear regression, a backpropagation neural network (BPNN), M5Prime, Pace regression and a support vector-based system called SMOreg. The following briefly introduces these methods with details omitted (readers can refer to the respective references given). The linear regression model [10] is applicable for numeric classification and prediction provided that the relationship between the input attributes and the output attribute is almost linear. The relation is then assumed to be a linear function of some parameters - the task being to estimate these parameters given training data. This is often accomplished by the method of least squares, which consists of finding the values that minimize the sum of squares of the residuals. Once the parameters are established, the function can be used to estimate the output values for unseen data. BPNNs [2] consist of a network of nodes arranged in several layers - the input, hidden and output layers. Input and output layers buffer the input/output for the model respectively. The hidden layer(s) provide a means for representing input relations. The network is trained by repeatedly presenting it with (labeled) training data and backpropagating any resulting errors in classification through it, adjusting weights between nodes in the process. This weight modification is achieved via the gradient of error curve. M5Prime is a rational reconstruction of Quinlan’s M5 model tree inducer [32]. While decision trees were designed for assigning nominal categories, this representation can be extended to numeric prediction by modifying the leaf nodes of the tree to contain a numeric value which is the average of all the dataset’s values that the leaf applies to. Projection adjustment by contribution estimation (Pace) regression [31] is a recent approach to fitting linear models, based on considering competing models. Pace regression improves on classical ordinary least squares regression by evaluating the effect of each variable and using a clustering analysis to improve
14
the statistical basis for estimating their contribution to the overall regression. SMOreg is a sequential minimal optimization algorithm for training a support vector regression using polynomial or Radial Basis Function kernels [24, 29]. It reduces support vector machine training down to a series of smaller quadratic programming subproblems that have an analytical solution. This has been shown to be very efficient for prediction problems using linear support vector machines and/or sparse data sets.
5
Experimentation
For each of the seven algae datasets, ten-fold cross-validation [30] was used to estimate the predictor’s performance. The experimental results are given as two types of graph: root mean squared error (RMSE) and mean absolute error (MAE). The mean absolute error is computed by summing the absolute difference between the actual and predicted target value for each instance and then taking the average. The root mean squared error is determined by summing the squared differences between actual and predicted values, and taking the square root of the average. Both quantities are given for each predictor over the seven datasets.
5.1
Impact of feature selection
To investigate the impact of feature selection on predictor performance, the experimentation was carried out both with and without FRFS. The unreduced data for each species of alga was supplied to each predictor and used in evaluation via cross-validation. Then, the same data was processed by FRFS to reduce dimensionality and evaluated in an identical fashion. This resulted in, on average, a sevenattribute dataset selected from the original, eleven-attribute one. Table 1: Features selected: Species Subset 1 {season, size, flow, 1, {season, size, flow, 1, 2 3 {season, size, flow, 1, {season, size, flow, 1, 4 {season, size, flow, 1, 5 6 {season, size, flow, 1, {season, size, flow, 1, 7
FRFS 2, 2, 3, 2, 2, 2, 7,
3, 7} 3, 7, 8} 4, 5, 7} 5} 4, 7, 8} 4, 5, 8} 8}
The exact selected attributes were different for each alga species (as can be seen in table 1), although certain attributes were present in all seven reduct sets, namely the season, size of the river, flow rate of
15
the water, and concentration 1. The obtained reducts could not be verified based on empirical evidence because the dataset documentation mentions the names of the concentration attributes, but not their ordering in the data, hence it is needed to refer to the chemical concentrations by number rather than name. However, based on previous experience with FRFS [16], it is expected that the selected feature subsets would overall make sense to an expert. It must also be noted, however, that it is difficult to verify directly the quality of selected attributes, in default of a suitable quality metric. The most accessible way is therefore to use the reduced and unreduced data to train a learning system, and compare the results. This gives an indirect measure of subset quality.
Figure 3: Unreduced and reduced data RMSEs and MAEs with linear regression
Figure 4: Unreduced and reduced data RMSEs and MAEs with M5Prime
The results of experimentation using linear regression can be found in figure 3. It can be seen that both approaches perform similarly in terms of RMSE and MAE, with FRFS-based predictions somewhat more accurate in general. This trend is reflected in the results for M5Prime (presented in figure 4) and 16
Pace (figure 6). For SMOreg (figure 7) the results for both methods are very similar, which is to be expected as SVM methods are not sensitive to feature selection. It is worth reiterating that the task of the system is to reduce the number of measurements that must be obtained whilst maintaining prediction performance. This is clearly the case in these experiments.
Figure 5: Unreduced and reduced data RMSEs and MAEs with BPNN
Figure 5 shows the results for the BPNN-based predictor. Here, a small difference in performance can be seen between the two approaches. The method that incorporates FRFS produces some improvement in accuracy for each algae estimation problem.
Figure 6: Unreduced and reduced data RMSEs and MAEs with Pace
Again, note that the improvement in accuracies are obtained with fewer measured variables, which is important for dynamic systems where observables are often restricted, or where the cost of obtaining more measurements is high. In the river algae domain, for instance, providing different measurements
17
Figure 7: Unreduced and reduced data RMSEs and MAEs with SMOreg
has different costs attached. It is trivial to give the time of year and size of river, but flow rate may need extra equipment. Additionally, each of the measurements of concentration of chemicals may need its own process, requiring time, well-trained personnel and money. Reducing the number of measurements to be made significantly enhances the potential of the estimator system.
5.2
Comparison with Relief
In order to further show the utility of feature selection, and in particular the benefits of using FRFS, a further well established FS algorithm was chosen for experimental comparisons: Relief. Unlike most FS methods, both FRFS and Relief can handle continuous decision features. Relief(O, c, its, ǫ). O, the set of all objects; c, the number of conditional features; its, the number of iterations; ǫ, weight threshold value. (1) (2) (3) (4) (5) (6) (7) (8) (9) (10)
R ← {} ∀ Wa , Wa ← 0 for i = 1...its choose an object x in O randomly calculate x’s nearHit and nearMiss for j = 1...c Wj ← Wj − diff(xj , nearHitj )/its + diff(xj , nearM issj )/its for j = 1...c if Wj ≥ ǫ; R ← R ∪ {j} return R Figure 8: The Relief Algorithm
In Relief [17] each feature is given a relevance weighting that reflects its ability to discern between decision class labels. An overview of this algorithm can be found in figure 8. A threshold, its, specifies the number of sampled objects used for constructing the weights. For each sampling, an object x is randomly 18
chosen, and its nearHit and nearMiss are calculated. These are x’s nearest objects with the same class label and different class label respectively. The user must supply a threshold which determines the level of relevance that features must surpass in order to be finally chosen. The method has been extended to enable it to handle inconsistency, noise and multi-class datasets [18]. For the experimentation presented here, only those features that result in a final positive weight are selected (see table 2). Table 2: Features selected: Relief Species Subset 1 {1} {size,flow,2,3,4,5,6,7,8} 2 {size,flow,2,3} 3 {size,1,2,3,4,5,6,7} 4 5 {size,1,3,4,5,6,7,8} {size,1,3,4,5,6,7,8} 6 {season,1,4,5,6,7,8} 7
Figure 9: Unreduced, reduced and Relief-reduced RMSEs and MAEs for species 1
Figures 9 to 15 show the results for the unreduced, FRFS-reduced and Relief-reduced data for algae species 1-7. It is clear that estimators trained using data reduced by FRFS generally outperform those trained using Relief-reduced data for algae species 1, 5 and 7. Relief performs generally better than FRFS for species 3 and 4. For the remaining algae species, both methods perform equivalently. Note that for all species in general, population estimators that employ feature selection perform significantly better than those without. This suggests that the data contains features that are redundant, noisy or irrelevant to the task at hand. The average RMSEs over all classifiers and algae species are: 10.46 for the unreduced method, 9.93 for FRFS, and 10.17 for Relief. Similarly, the average MAEs are: 6.67 for the unreduced method, 6.38 19
for FRFS, and 6.48 for Relief. The FRFS-reduced method exhibits a lower average RMSE and MAE overall. The p-values for each classifier for FRFS and Relief can be found in table 3, where comparisons are against the unreduced data performance. It can be seen that for both methods, the only statistically significant improvement is for neural net-based prediction. Table 3: P-values for each classifier for the FS methods Classifier RMSE MAE FRFS Relief FRFS Relief Linear 0.3792 0.6766 0.1620 0.6553 0.3588 0.5018 0.5416 0.4224 M5P 0.0061 0.0158 0.0065 0.0227 Neural 0.4735 0.4475 0.6175 0.2932 Pace SMOreg 0.3109 0.2806 0.6260 0.3592
Figure 10: Unreduced, reduced and Relief-reduced RMSEs and MAEs for species 2
5.3
Comparison with existing work
Work has been previously carried out on this data in [4], which uses a neural network-based approach to predict populations. A multi-layer perceptron feed forward network with 1 hidden layer was employed, with direct connections between every input and output neuron. The dataset used is exactly the same as the one investigated here, however, in [4], two power transformation techniques were applied. Firstly, the variables were normalized taking into account skewed distributions or overly peaked or flat distributions. Secondly, the relationships between interval targets and interval variables were linearized. The transformed data was then split into training (80%), validation (10%) and testing (10%). The neural net attempts to find the best weights using the training data set. The validation set was used to assess the adequacy of the model and was also used for model 20
Figure 11: Unreduced, reduced and Relief-reduced RMSEs and MAEs for species 3
Figure 12: Unreduced, reduced and Relief-reduced RMSEs and MAEs for species 4
fine-tuning. The test set is a hold-out data set which is not used in training or validation. Its sole purpose was for obtaining a final, unbiased estimate of the generalization error of the trained network. The results from this work are presented in table 4 alongside the best RMSEs from the estimators considered in the present work, for both unreduced and reduced algae data. For algae species 1 and 4, the approaches proposed in this paper result in a more accurate estimation of population. The remaining species result in a slightly worse performance. It is surprising that the results obtained here are very similar given that the data used in [4] has been substantially modified to better suit it for the requirements of the learning algorithm. The data used in the present research has not been altered in any way. Note, no optimization of fuzzifications has taken place.
21
Figure 13: Unreduced, reduced and Relief-reduced RMSEs and MAEs for species 5
Figure 14: Unreduced, reduced and Relief-reduced RMSEs and MAEs for species 6
6
Conclusion
The control and limitation of waste production is a very important issue in preserving the fragile balance of river ecologies. River algae are very sensitive to changes in their environment, and in turn, can influence the well-being of more complex life forms. Ecologies where algae are present are thus heavily dependent on chemical and physical balance in the environment. Growth in algae communities is associated with poor water clarity and various detrimental effects on other forms of river life, as well as humans. Thus, measuring and reducing the impact that farming, manufacturing and waste disposal have on river ecologies has attracted much attention recently, especially with respect to estimating and controlling river algae population fluctuations. Biologists are attempting to locate the chemical parameters that control the rapid growth of algae communities.
22
Figure 15: Unreduced, reduced and Relief-reduced RMSEs and MAEs for species 7
Table 4: Comparison of RMSEs for algae population estimators Algae Results from [4] Best predictor Species Valid. Test Unred. Red. 1 13.05 18.14 16.22 15.88 2 13.30 7.14 10.27 10.22 3 5.57 5.33 7.43 7.65 4 3.98 6.27 3.86 3.88 5 6.33 4.93 7.48 7.70 6 16.36 9.54 10.23 10.29 7 5.37 3.55 5.42 5.34
It would be desirable to have an intelligent computer-based system to locate these parameters and use this information to estimate population fluctuations. Such a system would serve in a number of ways. It would simplify the collection of measurements by isolating the absolutely necessary tests needed. The system would also decentralize the entire process, allowing individual testers to sample rivers and obtain results rapidly and in situ. This would in turn reduce monetary and time requirements. This paper has described an approximation-based fuzzy-rough estimator of algae populations. The approach integrates approximation-based fuzzy-rough feature selection with potentially powerful estimator systems in a modular manner. The FRFS subsystem helps reduce the dimensionality of the domain with which the prediction subsystem has to cope. The FRFS algorithm has proved to be very useful in stripping out insignificant information, while retaining more important conditional attributes. Another desirable feature of this technique is the fact that, unlike transformation-based attribute reduction approaches [16], it maintains the underlying semantics of the dataset, enabling human experts to glean the distilled knowledge. In all experimental studies there has been no attempt to optimize the fuzzifications
23
or the classifiers employed. It can be expected that the results obtained with optimization would be even better than those already observed. Further work in this area includes the application of fuzzy rule induction algorithms (RIAs) to this domain. FRFS uses the fuzzification information derived statistically from the data to produce data reductions. This should mean that the FRFS-generated reductions would be better suited to fuzzy RIAs that also use both the data and fuzzifications themselves. FRFS is particularly appropriate here as it retains the underlying meaning of the features involved - something that is very important for fuzzy RIA-induced rulesets from the transparency perspective.
References [1] W.H. Au and K.C.C. Chan, “An Effective Algorithm for Discovering Fuzzy Rules in Relational Databases,” Proceedings of the 7th IEEE International Conference on Fuzzy Systems, pp. 1314–1319, 1998. [2] C. Bishop, Neural Networks for Pattern Recognition, Oxford University Press, 1995. [3] K. Chan and A. Wong, “APACS: A System for Automatic Analysis and Classification of Conceptual Patterns,” Computational Intelligence, vol. 6, pp. 119–131, 1990. [4] R. Chan, “Protecting rivers & streams by monitoring chemical concentrations and algae communities,” ERUDIT: 3rd International Competition of Data Analysis by Intelligent Techniques (runner up), 1999. [5] A. Chouchoulas and Q. Shen, “Rough Set-Aided Keyword Reduction for Text Categorisation,” Applied Artificial Intelligence, vol. 15, no. 9, pp. 843–873, 2001. [6] M. Dash and H. Liu, “Feature Selection for Classification,” Intelligent Data Analysis, Vol. 1, No. 3, pp. 131–156, 1997. [7] M. Dash and H. Liu, “Consistency-Based Search in Feature Selection,” Artificial Intelligence, 151(12):155-176, 2003. [8] P. Devijver and J. Kittler, Pattern Recognition: A Statistical Approach, Prentice Hall, 1982. [9] D. Dubois and H. Prade, “Putting rough sets and fuzzy sets together,” In [28], pp. 203–232, 1992. [10] A.L. Edwards, An Introduction to Linear Regression and Correlation, San Francisco, CA: W. H. Freeman, 1976. [11] ERUDIT, European Network for Fuzzy Logic and Uncertainty Modeling in Information Technology. Protecting Rivers and Streams by Monitoring Chemical Concentrations and Algae Communities (3rd International Competition), 1999. [12] B. Flury and H. Riedwyl, Multivariate Statistics: A Practical Approach, Prentice Hall, 1988. [13] I. Hayashi, T. Maeda, A. Bastian and L.C. Jain, “Generation of Fuzzy Decision Trees by Fuzzy ID3 with Adjusting Mechanism of AND/OR Operators,” Proceedings of the 7th IEEE International Conference on Fuzzy Systems, pp. 681–685, 1998. [14] U. H¨ ohle, “Quotients with respect to similarity relations,” Fuzzy Sets and Systems, 27, pp. 31–44, 1988. [15] C.Z. Janikow, “Fuzzy Decision Trees: Issues and Methods,” IEEE Transactions on Systems, Man and Cybernetics — Part B: Cybernetics, 28, pp. 1–14, 1998.
24
[16] R. Jensen and Q. Shen, “Semantics-Preserving Dimensionality Reduction: Rough and Fuzzy-Rough Based Approaches,” IEEE Transactions on Knowledge and Data Engineering, Vol. 16, No. 12, pp. 1457–1471, 2004. [17] K. Kira and L.A. Rendell, “The feature selection problem: Traditional methods and a new algorithm,” In Proceedings of Ninth National Conference on Artificial Intelligence, pp. 129–134, 1992. [18] I. Kononenko, “Estimating attributes: Analysis and Extensions of Relief,” Proceedings of the European Conference on Machine Learning, pp. 171–182, 1994. [19] H. Liu and H. Motoda, Feature Selection for Knowledge Discovery and Data Mining, Kluwer Academic Publishers, 1998. [20] H. Liu and L. Yu, “Toward Integrating Feature Selection Algorithms for Classification and Clustering,” IEEE Transactions on Knowledge and Data Engineering, Vol. 17, No. 3, pp. 1–12, 2005. [21] J.G. Marin-Bl´ azquez and Q. Shen, “From approximative to descriptive fuzzy classifiers,” IEEE Transactions on Fuzzy Systems, Vol. 10, No. 4, pp. 484–497. 2002. [22] S.K. Pal and A. Skowron (Eds.), “Rough-Fuzzy Hybridization: A New Trend in Decision Making,” Springer Verlag, Singapore, 1999. [23] Z. Pawlak, Rough Sets: Theoretical Aspects of Reasoning About Data. Kluwer Academic Publishing, 1991. [24] J. Platt, “Fast Training of Support Vector Machines using Sequential Minimal Optimization,” Advances in Kernel Methods - Support Vector Learning, B. Sch¨olkopf, C. Burges, and A. Smola, eds., MIT Press, 1998. [25] J.R. Quinlan, C4.5: Programs for Machine Learning, The Morgan Kaufmann Series in Machine Learning. Morgan Kaufmann Publishers, San Mateo, CA, 1993. [26] Q. Shen and A. Chouchoulas, “FuREAP: A fuzzy-rough estimator of algae population,” Artificial Intelligence in Engineering, vol. 15, No. 1, pp. 13–24, 2001. [27] Q. Shen and R. Jensen, “Selecting informative features with fuzzy-rough sets and its application for complex systems monitoring,” Pattern Recognition, Vol. 37, No. 7, pp. 1351–1363, 2004. [28] R. Slowinski, editor. Intelligent Decision Support, Kluwer Academic Publishers, Dordrecht, 1992. [29] A.J. Smola and B. Sch¨ olkopf, “A Tutorial on Support Vector Regression,” NeuroCOLT2 Technical Report Series - NC2-TR-1998-030, 1998. [30] M. Stone, “Cross-validatory choice and assessment of statistical predictions,” Journal of the Royal Statistical Society B, Vol. 36, pp. 111–147. 1974. [31] Y Wang, “A new approach to fitting linear models in high dimensional spaces,” PhD Thesis, Department of Computer Science, University of Waikato. 2000. [32] Y. Wang and I.H. Witten, “Inducing model trees for continuous classes,” M. van Someren and G. Widmer (eds), Proc. Poster Papers: Ninth European Conference on Machine Learning, Prague, Czech Republic, pp. 128–137, 1997. [33] I.H. Witten and E. Frank, Data Mining: Practical machine learning tools with Java implementations, Morgan Kaufmann, San Francisco, 2000. [34] Y. Yao and Y. Chen, “Rough set approximations in formal concept analysis,” LNCS Transactions on Rough Sets, Vol. 5, pp. 285–305, 2006. [35] L.A. Zadeh, “The concept of a linguistic variable and its application to approximate reasoning,” Information Sciences, Vol. 8, pp. 199–249, 301–357; Vol 9, pp. 43–80, 1975.
25