1
An Application of the Quality Transfer Function by Andy Urquhart Introduction In a previous article 1, we proposed a Quality transfer function as a general form of the transfer functions used by engineers to describe the Quality of various characteristics, such as optical images, acoustic waveforms, feedback control responsiveness, and electronic filter response, as follows: Y ( ) = Г ( )* X ( )
Eqn. 1
Where, in using Equation (1) Y ( ) represents an output, X ( ) an input, and Г ( ) as the set of Quality transfer functions, all functions having an argument denoting frequency. Although some may consider Equation (1) somewhat daunting, it only represents the product of two variables, which some people already use intuitively when inquiring about the frequency response of a stereo amplifier. With one particular frequency in mind, instead of Equation (1) we could simply write: Y = Г *X
Eqn. 2
Where, in using Equation (2) Y represents an output, Г a scalar transfer function, and X an independent variable. In the following sections, we will describe how we can use one particular member of the set of Quality transfer functions – a work transfer function (WTF) – to study the principles of operation of systems, such as film handling systems; one of the many sub-systems comprising Image Setters: but before we do, to clarify our usage, we will describe how we use the WTF to gain insights into simpler systems, such as a single-flow manufacturing line and a Kinetic Energy Recovery System (KERS.) Once the reader has become accustomed to our terminology, we will then use the WTF to investigate the film handling system in rather more detail, with the goal of understanding the principles of operation and the root cause of a family of failures modes . We will also mention how we incorporate other methods and approaches into our studies, including: emulation, the scientific method, and the systems approach; which we use to reduce complexity. Although we completed this film handler study several years ago, 2 and the company has sold more than 3,000 units of their award winning Drum Image Setter worldwide, our use of the WTF is germane given the resurgent interest in rotating systems; including kinetic energy recovery systems (KERS) 2 and high-efficiency renewable energy systems. Renewable energy systems, such as windmills, hybrid magnetic motors, and permanent magnetic generators can all benefit from our Quality Transfer Function approach, because in working with these types of systems, we cannot always assume 100% efficiency when transforming energy from one form to another, which is why we introduce the concepts of useful work and worthwhile work.
© Andy Urquhart 2009 All Rights Reserved.
(www.tauquality.wordpress.com)
2
The Work Quality Transfer Function As we mentioned in our earlier article 1, we base our general form of the Quality transfer function (Equation 1) on the optical transfer function (OTF). Our justification for using the OTF as a template is the knowledge that lenses transform light, and since light comprises electromagnetic energy, we have inadvertently stumbled upon a transfer function suitable for describing the Quality of work. (The reader may recall energy and work share the same physical dimensions: Joules.) As with the response of a stereo amplifier, the WTF ( ) is a function of frequency, or period of repetition. Therefore, in using the optical transfer function as a template, we invoke a WTF having the following form: Y(ω) = WTF(ω)* X(ω)
Eqn. (3)
Where, in using Equation (3) Y ( ) represents an output, X ( ) an input, and WTF ( ) the work transfer function – a particular member of the set of Quality transfer functions, Г(ω). Since we can associate the work transfer function WTF with efficiency
= Work OUT / Work IN
by virtue of the relationship:
Eqn. (4)
We can rewrite Equation (4) as follows: Y(ω) = (ω)*X(ω)
Eqn. (5)
We further clarify the relevance of the frequency in Equation (5) in the context of a single-flow manufacturing line, in which we process items one by one, sometimes through numerous stages, in sympathy with a takt cycle. The relationship between the the takt period ( ) and the frequency is: ω=1/
Eqn. (6)
Although American Lean production lines use takt times, our usage is limited to production lines using the method of one-by-one confirmation of the Toyota Production System (TPS) as described by Kitano-san 2. Under the TPS, each stage uses autonomous inspection (process self-assurance) to trigger an alarm that stops production as soon as the stage encounters a problem, or defect. Therefore, under the TPS, we cannot define the Quality of a product or service in terms of defects, process capability, or any other inspection metric, because the one-by-one confirmation method implies zero defects. If the reader is happy to accept efficiency as a member of the set of Quality transfer functions, we can better appreciate how another transformation - the 5S transformation - can improve Quality.
Useful Work versus Worthwhile Work As optical engineers often factorise the Optical Transfer function (OTF) into two parts: a Modulation transfer function (MTF) part and a Phase transfer function (PTF) part, as indicated by Equation (7) as follows: OTF (ω) = MTF (ω) * PTF (ω)
© Andy Urquhart 2009 All Rights Reserved.
Eqn. (7)
(www.tauquality.wordpress.com)
3 Where, in using Equation (7) the MTF ( ) represents the bandwidth or spectrum or useful energies available to an optical imaging system due to the physical limitation of a finite lens aperture, or light collecting ability. The PTF ( ) on the other hand represents the bandwidth of worthwhile energies remaining after degradation in passing through a malformed lens, the malformation due to a lens aberration, such as a spherical aberration. In sympathy with the OTF, we can also factorizing the WTF into two parts: Y (ω) =
U
(ω) *
W
(ω) * X(ω )
Eqn. (8)
Where, in using Equation (8) the term U ( ) denotes the useful efficiency, or the spectrum of useful work, while the other term W ( ) denotes the worthwhile efficiency, or spectrum of worthwhile work. (We often use the terms ‘frequency response’ and ‘spectrum’ interchangeably.) Our usage allows us to draw a distinction between useful work and worthwhile work, as in the following: How often does useful work bring forth little worthwhile. Useful Work Using the example of a single-flow manufacturing line again and bearing in mind the following relationship: Work = Power * time
Eqn. (9)
Alternatively, we can rewrite Equation (9) as: Work = Effort * time
Eqn. (10)
Accordingly, we are able to estimate the amount of useful work WU performed by a stage in a singleflow manufacturing line from the standard time, provided we assume an average effort. (In the author’s experience, Japanese companies calculate standard times theoretically using software 5.) Worthwhile Work In manufacturing, the only worthwhile work is that which delivers a fully functional unit or part. Accordingly, in a single flow line, this only occurs after completing a successful takt because as soon as someone on the production line encounters a problem, an alarm sounds and the production line stops. If the line is balanced and there are m stages, T successful takts produce: WU = m * T
Eqn. (11)
Where in using Equation (11), we determine the useful work by multiplying the number of stages, m, by the total number of takt periods, T.
Useful Efficiency versus Worthwhile Efficiency Since it is unreasonable to expect someone performing manual labour to work flat out all the time with maximum effort, we have to recognise that periods of hard labour require periods of rest otherwise mistakes happen. This ‘no unreasonableness’ principle is called “Muri” in Japanese © Andy Urquhart 2009 All Rights Reserved.
(www.tauquality.wordpress.com)
4 companies because it has a major impact on waste, which explains their preference for calculating standard times – not to make people work harder - but to ensure a balance between effort and sufficient time to complete the task correctly. How different from most Western companies who always try to ‘crack the whip’ at the end of the month. Useful Efficiency For reasons already mentioned, the takt time should comprise the standard time and a period of rest, the rest time also sufficient to allow an operator to move from one stage to another: if necessary, which is often the case on a new line. Taking this in account, we can calculate the useful efficiency using the ratio: U
( ) = (Power Out * Std. time) / (Power In * Takt time) = Std. time / Takt time Eqn. (12)
Thus, if the effort only goes towards producing a part, the Power Out equals the Power In and the useful efficiency is just the ratio of the standard time to the takt time. For the sake of simplicity, we will ignore the possibility of the actual working time being greater than the standard time because under TPS this would also cause considerable concern. Indeed, we now see how we can improve the efficiency of a production line using power tools, hoists, or other means to improve the efficiency of useful work. Furthermore, we conclude the use of these can actually improve Quality and not just productivity. The reader should note it is not possible to keep on increasing the frequency of production by reducing the period of the takt while maintaining the same standard time, as this would diminish the rest period. If we want to reduce the takt time, we must first reduce the standard time by increasing the division of labour, through the creation of a greater number of stages. We would then have to work out how much rest operators need to maintain stamina while working under the arrangements. Worthwhile Efficiency As mentioned previously, the amount of worthwhile work equates to the number of good items produced through each stage and since the potential for good items is the theoretical number of takts per day, we can calculate the worthwhile efficiency using the following ratio: ( ) = (m * TG ) / n
Eqn. (13)
Where, in using Equation (13) m represents the number of stages, TG the number of good takts, and n = number of planned daily takts. More conventionally, we refer to the useful efficiency as production efficiency and the worthwhile efficiency as yield. Thus, in our usage, we combine both efficiencies. For processes not involved in replication, such as original works of art, literary works, or even custom designed software, the Quality of these processes, means of production, and services must be characterised by different means.
Applications Previously, we provided a manufacturing interpretation of U ( ) and w ( ) - we will now discuss how we can apply the Work transfer function to KERS (Kinetic Energy Recovery Systems) in the hope © Andy Urquhart 2009 All Rights Reserved.
(www.tauquality.wordpress.com)
5 this might further clarify our approach. Following this short description of KERS, we will then describe how we used the WTF to study our film handling system in detail in the next sections.
KERS Kinetic Energy Recovery System (KERS) is a recent innovation in F1 Motor Racing, giving the sport even greater interest and excitement. KERS involves recovering angular kinetic energy from wheel spins ( U) which is then stored in a lightweight, compact flywheel and later released via a continuous velocity transmission (CVT) to boost performance along straight sections of the racetrack. Clearly then, it is advantageous for the KERS to have any useful energy derived from the racing car’s wheels transmitted efficiently to the storage flywheel ( U) and likewise to have any stored energy transmitted efficiently to the wheels ( w). Having clarified our use of useful and worthwhile energy terms with several examples, we will now apply these concepts to a film handling system.
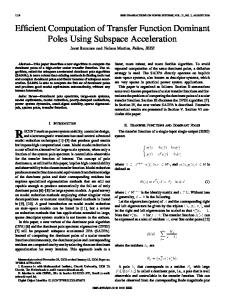
Film Handling System Image Setter Description Image Setters are high resolution (1200 to 4800 dots per inch) laser optical systems widely used in the printing industry to record photographic images of various media, such as photographs, graphics, and text. Once developed, operators transfer records on to plates using lithography - an etch process. (Nowadays one can also use infrared to record images direct to plate, but this is only an upgrade of the existing equipment.) After coating the plates with ink, we press the plates on to paper to form a portion of a colour image. Since printing in colour requires four imprints: three colours and black, alignment and registration of each impact are critical to image Quality. As Image-setters are as complex as motor vehicles, – more than five thousand components – we have to take a systems approach (Appendix A) to reduce complexity to a manageable level. Indeed, it is often advantageous to analyse (using the reduction method) to drill down to a deeper level, even beyond (b) the functional level to observe the principles of (e) operation. In Japanese companies, this mindset reflects the true interpretation of attention to detail. (c) (a) (d) Film Handler Sub-Assembly (Sub-System) The design of a film handler is technically challenging because the mechanism has to operate at high speeds to achieve high productivity using wide format film. The use of wide format film gives the option of printing up to four magazine pages at a time in what printers term a ‘four up.’
(d) (e)
(f )
FIG. 1: Basic film handling system. One of the most important considerations is how to decelerate the film and mechanism towards the end of a feed cycle, since rolls of film inside cassettes carry considerable angular momentum. The angular momentum carried also varies considerably depending on the amount of film remaining on the roll, which is a function of usage. © Andy Urquhart 2009 All Rights Reserved.
(www.tauquality.wordpress.com)
6 Figure (1) illustrates, in diagrammatic form, a basic film handling system, having rollers (a) and film (b) either driven forwards (c) or backwards (d) in sympathy with roller bar (c) the roller bar rotating under the influence of drive band (d) and U-tube wheel (e) which under normal circumstance would be connected to motor (f). (The reader should note that for clarity the following important components are not indicated in Figure (1): film guides, roller bar u-grooved wheel, and the rotor u-grooved wheel.) Historical Perspective Historically, film-handling sub-systems suffer many production problems, including difficulties assembling components, multiple adjustments, and numerous rechecks, with the major cause due to component mismatching. By mismatching, we infer those components that do not interfere correctly, or mesh: even though they satisfy univariately specified tolerances. When encountering these components, operators have either to choose another component, or modify the components on the production line - with all the difficulties and delays that entails. Inspection/Checking/Final Test/ Burn-in Although many authors claim Japanese manufacturers do not inspect, test, or burn-in, nothing could be further from the truth. Moreover, those who make such claims contradict Deming’s own advice encapsulated by his universally known ‘PDCA’ Cycle: Plan, Do, Check, and Act. Anyone who has actually worked for a Japanese company should understand the importance of checking and taking immediate corrective action, even on processes that are near perfect! Without checking and confirmation, how else can one insure/assure production processes? Reliability One of the important measures of reliability is ‘Mean Time between Failures’ (MBTF.) This metric is important because it has a direct bearing on the cost-of-ownership, which includes unit manufacturing costs, service costs, and the warranty costs. Indeed, many Japanese companies cite unquestionable reliability as their most important mission - for this very reason. Consequently, the specified operational performance for new systems can be exceptionally challenging - not just in terms of eliminating those conditions that might conspire to create reliability functional failures, but also due to the length of time involved testing and confirming the reliability. In the case of our film handler development, the specification for the film handling MTBF was so low it implied six months of continuous, uninterrupted testing without a single failure. For major projects, which invariably have to be completed within the space of one year, early failures might lead to technologists spending most of their time trying to explain the cause of failure, why it won’t happen again, and how to justify continued testing to meet deadlines. Hardly a worthwhile investment of resources when no one has any idea how extreme values of distributions and joint probability can conspire to cause reliability failures in the first place.
The Systems Approach Complex systems, such as KERS and Film Handling Systems really require us to take a systems approach because the function of these systems is quite complex. We use the systems approach to reduce the extent of the system boundary and study a less complex part of the system in detail.
© Andy Urquhart 2009 All Rights Reserved.
(www.tauquality.wordpress.com)
7 By combining the systems approach with the scientific method, we stand a greater chance of discovering the best system instead of merely improving or optimizing what someone came up with as a first guess.
The Scientific Method According to the Princeton University’s Word Net; “... the Scientific Method is a method of investigation involving observation and theory to test scientific hypothesis.” Methods suitable for observation, theorizing, and testing include: 1. 2. 3. 4. 5.
Mathematical modelling Statistical modelling Simulation Emulation Prototypes
Moreover, in terms of well-known failure modes, it is useful to try to produce them intentionally - to confirm we understand the true cause. Mathematical models Various mathematical models can be formulated, including equations with terms, such as angular kinetic energy, angular momentum, moments of inertia, and linear momentum. Unfortunately, mathematical models do not always predict what we observe in practice. In the 70’s there was a story about a farmer who wanted to know how long it would take to freeze a chicken by dipping it in iced water. On opening the final report, he read the first sentence: “Consider a spherical chicken ...” and immediately threw the report on the fire because he knew none of his chickens were round in appearance. 1. Statistical modelling We use statistical models to try to explain reliability failures because these problems occur randomly and relatively infrequently. Figure (2) illustrates a statistical model we developed to explain film handling skew film failures. 2. Simulation There are many software packages for simulation. We considered using an inexpensive package called Working Model, unfortunately, at the time, it did not support the simulation of drive belts; nor does it today. 3. Emulation Many people working outside the field computer science often overlook the usefulness of emulation – to emulate the characteristics of one system by another. One method of emulation still very popular in Japan is the use of functional Cardboard Models to study the function of designs, not just the aesthetics of a particular design, as is the practice in the West. 4. Prototyping
© Andy Urquhart 2009 All Rights Reserved.
(www.tauquality.wordpress.com)
8 While the use of a prototype might give us a good idea of what to expect when we build an actual product, reality often brings many surprises. The famous Quality Engineer, Dorian Shainin once remarked; “The human mind is so rational, it can explain anything,” which is why we must always be on our guard, remaining sceptical, and only relying on verifiable facts. Even a well-designed prototype may not work as expected or indicate what we might expect to see on a production line, either on start-up or even after manufacturing several thousand units. Datum Statistical Model With reference to Figure (2), we illustrate, in diagrammatic form, a statistical model for use with a film handler which might explain the possible cause of a family of failure modes known as film skew. (In practice, many operators use different names to describe the same fault.) The skew film failure mode Operators often observe film skew after assembling and setting up film handling systems on the production line. Operators also observe skew film during operation, but less frequently.
Left edge
( (a) b )
Right edge
FIG. 2: Statistical model
Based on previous observations , we theorise the skew film problem occurs when one edge of the film runs faster than the other, such as the right edge illustrated in Figure (2) where the average speed on the right edge is faster than the average speed of the left edge. In other words, the mechanism performs more useful work on the right than on the left by virtue of the relationship: Work = force*speed*time
Eqn. (14)
The speed variation across the width of the film is similar to non-spherical, wave fronts, as light passes through a lens in the presence of a non-spherical lens form. We often find differential variation in processes, such as textile webs, rolled sheets, float glass, diffusion boats, components in trays, and injection moulds. A situation made worse when there is a high degree of correlation, which in the case of the film handling system is intentional and the reason for having a rigid roller bar, driven from one side. As mentioned previously, correct alignment of each colour recording and plate is critical for the production of high resolution images and any deviation of the film, as depicted in Figure (2) would lead to misplacement of half-tone dots with consequential degradation of image Quality. Usually, when we use the emulator to characterise the film handler’s function, we do it without film guides because the presence of film guides might encourage the film to stick or jam when the skew of sufficient magnitude, or if the rollers cannot accommodate a redirection of the film stock as it bumps off one of the film guides. To accomplish this end, we can describe the correct choice of roller/film-guide interaction has having a directional polarisation, and we leave it to the reader to draw their own conclusions. [The rollers depicted in Figure (1) do not exhibit this property.] © Andy Urquhart 2009 All Rights Reserved.
(www.tauquality.wordpress.com)
9 Reliability There are two types of reliability failures. The first is due to material properties while the second is a consequence of function. By functional, we imply those problems that arise because of a joint probably of extreme values. Historically, reliability engineers have used mechanical cycling mainly to study material fatigue, but we believe it can also use cycling to test functional reliability. Figure (2) illustrates the second type of reliability failure in diagrammatic form. When one considers the likelihood of encountering two extreme values from the opposite ends of two distributions, as illustrated in Figure (2) it is a rare event – one of low joint probability. Fortunately, the statistical model of Figure (2) suggests how we might accelerate reliability testing by cycling our mechanism at higher frequencies, thereby increasing the likelihood of a rare event. It also suggests how we might devise a system having a very low MTBF - by matching edge speed distributions. Although our statistical model suggests an approach to reduce the incidence of stuck film, it does not provide any insight as to how to go about it. By what means can we match the average edge speed and reduce edge speed variation? Unfortunately, it is not always sufficient to optimise a system using Design of Experiments (DOE) or Robust Design and it is necessary to innovate. This is the primary purpose of emulation because a heuristic approach allows us make quick changes, induce conditions intentionally, and to use the scientific method to test our understanding of the basic principles of operation, long before we commit to a hardware design and ordering components for a prototype.
(d)
(e)
(c)
(a) (b)
FIG. 3: Film handling sub-system with adjustable pendulum drive
Emulation
arm As we mentioned previously, cardboard modelling is very popular in Japan because it provides an inexpensive, fast and flexible method of emulation, which they use to resolve functional problems long before committing resources. Cardboard Modelling By cardboard modelling, we infer the use of cardboard to create structural elements, such as chassis and skins, but without excluding the use of other materials, such as aluminium u-groove wheels, iron ball bearings, polymer drive bands (neoprene) etc. We take a heuristic approach to cardboard modelling because it is difficult to emulate the properties of a real systems, or sub-systems in their entirety with any degree of accuracy. By heuristic, we imply a ‘suck it and see it’ approach, by first testing the basic functions, and then trying to induce various failure modes and the consequences of extreme values of joint probability.
© Andy Urquhart 2009 All Rights Reserved.
(www.tauquality.wordpress.com)
10 Using the Cardboard Emulator Referring to Figure (4) which illustrates, in diagrammatically form, a film handling sub-system with adjustable pendulum drive, comprising arm (a) mass (b) platen (c) drive belt (e) and u-groove wheel (d) we first set up the pendulum to oscillate at a particular frequency by adjusting the height of mass (b). Since our pendulum does not constitute an ideal pendulum because it is damped by the ugroove wheel bearing or by a load transmitted by drive belt (e) we have to restrict ourselves to small amplitudes of oscillations to avoid instability due to non-linear effects. We can avoid the use of Polar coordinates by defining X(ω) as the starting height of mass (b) in Figure (3) and Y(ω) as the height of mass (b) on the opposite side. Each time the pendulum swings from XN to YN it performs a small amount of work. In principle, we could calculate the total work by summing over the total number of swings (N) until the pendulum rests, but we only have to record the number of swings since the constant of proportionality will cancel in our efficiency ratio. Accordingly, we can write the relationship between work and the successive pendulum swings is as: Work ( ω) ~ N(ω)
Eqn. (15)
Estimating the efficiency of Useful Work We estimate the efficiency of the Useful work using the ratio WU-OUT / WU-IN and counting the number of swings with the load connected to give WU-OUT and then with drive band (c) disconnected to give WU-IN. Before describing how we estimate the efficiency of the Worthwhile Work, refer to Figure (4) where we illustrate, in diagrammatic form: A method for measuring film skew. As film stock traverses along the bed of the Image Setter, the film skews towards the left because the edge speed of the film is faster on the right. Although we can use a pair on film guides, on either side of the film, to minimise the skew, when skew is severe, it jams hard up against the film guide and causes a stuck film failure.
Datum
DL
DR Film stock
FIG. 4: A method for measuring film skew
In the first instance, we do not use film guides because our first goal is to try and understand what causes film skew in the first place, and film guides would only mask the root cause. Estimating the efficiency of Worthwhile Work In order to estimate the worthwhile efficiency, as before, we have to estimate the work applied and the work done and we do not have to measure energy directly because we can use the relationship:
© Andy Urquhart 2009 All Rights Reserved.
(www.tauquality.wordpress.com)
11 Work = Force * Distance
Eqn. (16)
Referring to Figure (4) the arrows marked DR, DL represent the distance the right, and left edges of the film travel respectively. Taking the maximum and minimum of these DR and DL, we can calculate a modulation defined by the following relationship: DM = (DMAX - DMAX) / (DMAX + DMAX)
Eqn. (17)
Where, in using Equation (17) DMAX and DMAX represent the maximum and minimum distances travelled by the film during a cycle, and in the case represented in Figure (4) we obtain: DM = (DR – DL) / (DR + DL)
Eqn. (18)
After we measure DM for each frequency of interest, we can calculate the efficiency spectrum as: (ω) = [ 1 – DM(ω)]
Eqn. (19)
As with optics and stereo amplifiers, we can use Equation 19 to calculate a -3dB bandwidth of in the usual way. Synthesis and Integration Although we have endeavoured to provide a mathematical foundation for our approach, in the case of the film handling system, we took a heuristic approach. This was because it is difficult to calculate these terms using an emulation comprising a cardboard model. However, an understanding of the terms of the work transfer function is necessary to gain insight into the principles of operation and the root cause of a failure mode. Our own studies lead to three main conclusions: 1. Although we optimize the film handler to drive the film stock along the centre of the bed, in practice we use film guides. Unfortunately, when we use film guides, we still suffer the effects of skew film, depending on the geometry and position of the film rollers. 2. The rollers illustrated in Figure (1) are not optimised so that when the film stock meets the film guide, it can still jam up against the guide and jam. Now there is a temptation to assume that the observed effect is only due to our use of a ‘Heath Robinson” emulator, but this does not appear to be the case because we observe film stress proximal to the roller. (In our more recent model, we used an acetate overhead projector slide to emulate film.) 3. The problem of film jamming due to film skew occurs because rollers should allow some sideways movement of the film under the roller, which implies several factors have to be optimized, including roller width, roller radius, roller bar pressure, and belt tension. In fact, one could say the roller should exercise polarised control, so that there is high resistance axially and less trans-axially. 4. When operating the pendulum at high frequencies, the relationship between belt slip and film skew becomes obvious. Belt Wrap Belt wrap is a major issue in film handling systems because it affects traction and less belt wrap implies less traction, which can lead to belt slip. With reference to Figure (4) if there is considerable © Andy Urquhart 2009 All Rights Reserved.
(www.tauquality.wordpress.com)
12 belt slippage at high frequency, there is a tendency for the right side of the film to speed up, which leads to film skew - a counter intuitive result.
(5a)
(5b)
(5c)
FIG. 5: Various belt wrap configurations
Figure (5) illustrates, in diagrammatic form: Various belt wrap configurations. Figure (5a) depicts a typical arrangement, where the drive wheel and the slave wheel have the same diameters, and Figure (5b) an arrangement designed to minimize relative error. A solution suggested by one of our Japanese mechanical design engineers is represented in Figure (5c.) Referring to Figure (5a) when u-groove wheels are of the same size the wrap on each is about 50%. When we change the size of one wheel compared to another – perhaps in order to use scaling to reduce a sources of error - the wrap on only one wheel increases as in (b.) The solution proposed by a Japanese mechanical design engineer is illustrated in (c) and has the effect of increasing efficiency of worthwhile efficiency at higher frequencies (short arm pendulum swings.)
Conclusions By now, it should be apparent the use a Quality Transfer Function in conjunction with a rapid prototyping methodology provides a useful approach to indentifying the root cause of variation and defects, both in the concept phase, the design phase, and even during the production phase. This is because it is so flexible and easy to modify in an effort to induce problems and to investigate possibilities for eliminating them. The method can also be used to reduce functional testing to ensure the ‘Mean Time between Failures’ is limited to material’s properties and not to functional failures.
Acknowledgements Although the author takes full responsibility for any conceptual flaws or mistakes in this article, he would like to thank Giuseppe (Peppe) Calcara and Matt Moore for proof reading the article.
© Andy Urquhart 2009 All Rights Reserved.
(www.tauquality.wordpress.com)
13
References 1
Is y= f(x) really a Transfer function http://www.improvementandinnovation.com/features/articles/y-fx-really-transfer-function
2
Toyota Production System: One-by-one confirmation, by Kitano-san,
3
Introduction to Tau Quality Lecture, Andy Urquhart 2009
4
Definition of Effort in terms of Power http://www.biology-online.org/dictionary/Effort
5
Software suitable for calculating theoretical standard times can be found here: http://www.dfma.com/software/dfm.htm
6
As a Japanese colleague built our first cardboard model of the film handler system several years ago and only reported his results, the author had to build a new model in 2009 and perform his observations to confirm the importance of belt wrap.
7
The Scientific Method – Princeton WordNet: wordnetweb.princeton.edu/perl/webwn
© Andy Urquhart 2009 All Rights Reserved.
(www.tauquality.wordpress.com)
14
APPENDIX A The Systems Approach Most Japanese companies we’ve encountered use the scientific method in conjunction with a systems approach to break down, observe, theorize (model) and test hypothesis. The systems approach incorporates the following steps: 1.
Define the system
2.
Analyse the system (sub-divide the system into sub-assemblies)
3.
Observe and model the sub-system of interest (to try to understand its principles of operation)
4.
Integrate the sub-system back into the overall system
5.
Test and evaluate the overall system performance
Once the system has been defined in terms of what it has to deliver and how, it is necessary to analyse, or break the system down, into a number of sub-assemblies or components. In my own experience, Japanese companies tend to reduce sub-system boundaries to a greater degree than most western companies. This is also true for process development where, for example, there is greater appreciation of the various process steps, such as the dynamics of spinning wafers, how resist spreads on spinning disk, etc. In other words there is a greater attention to detail and cause and effect. This systems approach is somewhat different to the DMADV or DMAIC process because the latter processes take a statistical approach – one in which Analysis has a different meaning. (If the reader finds these terms unfamiliar, documents describing these processes are readily available on this internet site and others.) In the systems approach, analysis implies reduction – breaking systems down into ever smaller sub-systems and assemblies. Since R&D engineers continually investigate alternative solutions, a Chief Engineer in a Japanese company, is often able to choose the best solution from a number of options under investigation by R&D teams. His ultimate choice depending on a number of factors, including: the company’s mission statement, Reliability, Quality, Delivery, Cost, Competitiveness, Cost of ownership (warranty costs) and Risk. Some risks the Chief Engineer and his team have to consider include: Do we understand how the technology works? - Can we model the system and predict the outcome? How sensitive might products are to component variation? – Is the design robust to component variation? What is the manufacturability like? How many components are off the shelf, what are the lead times for custom components? What is the security of supply? – Are the manufacturers financially sound?
© Andy Urquhart 2009 All Rights Reserved.
(www.tauquality.wordpress.com)