AGRICULTURAL SYSTEMS Agricultural Systems 88 (2006) 514–527 www.elsevier.com/locate/agsy
Application of a simple ecological sustainability simulator (SESS) as a management tool in the semi-arid rangelands of northeastern Mexico H. Diaz-Solis a, M.M. Kothmann b, W.E. Grant c,*, R. De Luna-Villarreal a
a
Departamento de Recursos Naturales, Universidad Auto´noma Agraria Antonio Narro, Saltillo, Coahuila 25315, Mexico b Department of Rangeland Ecology and Management, Texas A&M University, College Station, TX 77843-2126, USA c Department of Wildlife and Fisheries Sciences, Texas A&M University, College Station, TX 77843-2258, USA Received 1 July 2004; received in revised form 12 July 2005; accepted 27 July 2005
Abstract We use a simple ecological sustainability simulator (SESS) [Diaz-Solis, H., Kothmann, M.M., Hamilton, W.T., Grant, W.E., 2003. A simple ecological sustainability simulator (SESS) for stocking rate management on semi-arid grazinglands, 76, 655] for rangelands with mean annual precipitation of 500 mm to evaluate tendencies in range productivity and cattle production under four management options: (1) supplemental feeding, (2) short-term reduction of stocking rate, (3) early weaning, and (4) adjustment of breeding seasons. We have made five modifications to SESS for the present paper. (1) Cattle mortality now occurs each month as a function of body condition. (2) Cows that are not pregnant 2 months after the end of the breeding season are sold. (3) Forage intake is calculated separately for each cohort of cows. (4) Cows that have been sold or have died are replaced just
*
Corresponding author. E-mail addresses:
[email protected] (H. Diaz-Solis),
[email protected] (M.M. Kothmann),
[email protected] (W.E. Grant),
[email protected] (R. De Luna-Villarreal). 0308-521X/$ - see front matter Ó 2005 Elsevier Ltd. All rights reserved. doi:10.1016/j.agsy.2005.07.008
H. Diaz-Solis et al. / Agricultural Systems 88 (2006) 514–527
515
before the beginning of each breeding season (except for the short-term reduction of stocking rate strategy). (5) The calculation of stocking rate now includes cows, bulls, nursing calves, weaned heifers less than 20 months of age, and pre-reproductive heifers aged 20 months or older. Simulation results suggest the four management options might be ranked from best to worst, in terms of increasing cattle production while maintaining range productivity, as: (1) short-term reduction of stocking rate, (2) adjustment of breeding seasons, (3) early weaning, and (4) supplementation. Short-term reduction of high stocking rates reduces the deterioration of range productivity because of the reduction in the number of stock. Adjustment of breeding seasons such that periods of highest energy requirements of cows and calves coincide with periods of highest forage production increases percentage pregnancy. Early weaning of calves improves the body condition of cows and increases annual production of weaned calves, but does not reduce the stocking rate and thus does not improve range productivity. Supplemental feeding, and other management practices that artificially sustain herbivores, break the negative feedback that promotes good range productivity and maintains long-term system stability. In general, strategies to increase cattle production in semi-arid rangelands should be based on the improvement of natural forage production. Ó 2005 Elsevier Ltd. All rights reserved. Keywords: Cattle production; Grazinglands; Range productivity; Rangelands; Simulation models; Stocking rate; Supplemental feeding; Semi-arid zones; Sustainability
1. Introduction Given the complexity of animal production systems in semi-arid rangelands, scientists and managers are relying increasingly on the use of simulation models as decision aids (e.g., Dix and Beidleman, 1969; Wight, 1983; Wight and Skiles, 1987; Carlson and Thurow, 1992). These production systems include a myriad of important variables including climate, soils, and vegetation, as well as current range productivity , stocking rate, and market conditions, all of which influence management decisions. The principal decision is the determination of the stocking rate in each pasture (Olivares and Ibarra, 1999; Redmon, 1999), since this affects the balance between the domestic animal population and the available forage (Behnke and Scoones, 1993). Forage production, which determines animal production, is controlled primarily by precipitation. In the semi-arid rangelands of northeastern Mexico, where annual precipitation varies from 300 to 700 mm, most producers operate extensive cow-calf production systems with no controlled breeding season and fixed stocking rates, which were estimated by COTECOCA (1979) more than 25 years ago. Reduction of animal production due to desertification is a critical problem; mean pregnancy rates commonly are 40–60%. Recently, as part of the agricultural extension activities of the Mexican government and some regional animal production specialists, producers are being urged to consider the possibilities of increasing production through management practices such as supplemental feeding, early weaning, adjustment of breeding seasons, and use of variable stocking rates.
516
H. Diaz-Solis et al. / Agricultural Systems 88 (2006) 514–527
Due to climatic variability, the establishment of fixed stocking rates for semi-arid rangelands appears unwise (Behnke and Scoones, 1993; Illius et al., 1998). One common option for maintaining a constant stocking rate as climate varies is to provide supplemental feed, however, irreversible vegetation change may occur when animal numbers are held constant when natural resources are scarce (Van de Koppel and Rietkerk, 2000). Alternative management strategies might include increasing or decreasing stocking rate based on the current condition of the pasture, season of the year, and the direction and rate of change in animal body condition. Managers also might influence body condition by weaning calves early or shifting the breeding season such that the period in which nutrient requirements of animals is highest coincides with the period of highest forage quantity and quality. In this paper, we use a simple ecological sustainability simulator (SESS) (Diaz-Solis et al., 2003) to compare potential trends in range productivity and cattle production in the semi-arid rangelands of northeastern Mexico under supplemental feeding and several management options that differ from those traditionally used in the region (COTECOCA, 1979). More specifically, we examine (1) supplemental feeding, (2) short-term reduction of stocking rate, (3) early weaning, and (4) adjustment of breeding seasons.
2. Brief model description We formulated SESS as a compartment model based on difference equations (Dt = 1 month) programmed in STELLAÒ 6.0 (High Performance Systems, Inc., Hanover, New Hampshire) to simulate the dynamics of standing crop forage, range productivity class, diet selection, and cattle production. To relate annual aboveground net primary production (ANPP, kg dry matter ha 1 year 1) to annual precipitation (PPT, mm year 1), we used the concept of rain use efficiency (RUE, kg aboveground dry matter (DM) produced ha 1 mm 1 of precipitation-year 1) proposed by Le Houreou (1984). We used soil characteristics (SC, unit-less index) to modify ANPP based on soil depth and slope. The forage submodel represents the dynamics of green and dry standing crop. ANPP is distributed across the months depending on the seasonal distribution of PPT and mean monthly temperature. Green standing crop is converted into dry standing crop via frosts and senescence. A fraction of senescent forage, representing senescence, respiration and translocation, is lost with the remainder transferred to dead standing crop. Green standing crop also is lost due to consumption, trampling, and dung deposition by cows. Dry standing crop is lost due to consumption, trampling and dung deposition by cows, and via decomposition. The range productivity submodel represents long-term changes in range productivity based on the proportion of ANPP consumed by cattle, which depends on the proportion of ANPP produced as forage. Range productivity class (RP) is quantified on a relative scale to represent ranges in Excellent (RP = 1.25), Good (RP = 1.0), Fair (RP = 0.75), and Poor (RP = 0.50) classes. The diet selection submodel estimates the proportions of green and dry forage in cattle diets based on preference and harvestibility, as described by Blackburn and
H. Diaz-Solis et al. / Agricultural Systems 88 (2006) 514–527
517
Kothmann (1991). The cattle production submodel simulates dry matter intake, body condition scores of cows (unit-less index with values between 1 = extremely thin and 9 = very obese; National Research Council of the United States, NRC, 2000, pp. 33–37), and herd pregnancy rates. Grazing efficiency is calculated as the proportion of ANPP consumed by cattle. For details see Diaz-Solis et al. (2003).
3. Materials and methods We evaluated the four management options using SESS, which is a stochastic compartment model based on difference equations (Dt = 1 month) programmed in STELLAÒ 6.0 (High Performance Systems, Inc., Hanover, New Hampshire, USA); a detailed description of SESS is available in Diaz-Solis et al. (2003). For the present paper, we modified SESS such that (1) cattle mortality occurs each month as a function of body condition, (2) cows that are not pregnant 2 months after the end of the breeding season are sold, (3) forage intake is calculated separately for each cohort of cows, (4) cows that have been sold or have died are replaced just before the beginning of each breeding season (except for the short-term reduction of stocking rate strategy), and (5) the calculation of stocking rate includes all cows, bulls, nursing calves, weaned heifers less than 20 months old, and pre-reproductive heifers aged 20 months or older. For each of the four management options, we ran 100, 20-year replicate, stochastic simulations for each scenario, with monthly net primary production calculated as the product of precipitation values drawn randomly from normal distributions based on historical weather records, as described in Diaz-Solis et al. (2003). We evaluated each scenario only under an annual precipitation regime of 500 mm, with both moderate (15 ha per Animal Unit Year (AUY)) and heavy (8 ha AUY 1) stocking rates. For all scenarios, except those of management option 4 (adjustment of breeding seasons), we simulated a fixed, 3-month breeding season during April, May, and June. During each simulation, we monitored range productivity classes (Excellent, Good, Fair, Poor) and cattle production, in terms of body condition score (BCS, from 1 to 9) and calf production at weaning (kg ha 1 year 1), as well as other factors of specific interest under the given management option, as described below. 3.1. Supplemental feeding The most common type of supplemental feed used in the rangelands of northeastern Mexico is made from chicken manure, cottonseed meal and urea. The objective is to provide nitrogen to microorganisms in the rumen to improve energy utilization from dry forage. To evaluate supplemental feeding, we simulated 4 different levels of supplementation representing 0%, 20%, 40%, and 60% of the energy deficit between energy requirements for maintenance, pregnancy and lactation, and energy intake estimated by SESS. We monitored the cost of supplementation, assuming the supplemental feed was corn-based.
518
H. Diaz-Solis et al. / Agricultural Systems 88 (2006) 514–527
3.2. Short-term reduction of stocking rate To evaluate reduction of stocking rate, we simulated 3 different decision rules for the sale of cows (partial sale of 50% of herd) as a function of change of BCS; loss of 1, 2, or 3 BCS units during the previous 2 months. Open heifers are sold first, followed by cows that are lactating just before the beginning of the breeding season. In all selling scenarios (except control), when weighted BCS < 2, all animals were sold (total sale). Under this management practice, the calves of those cows sold during lactation can be raised in a corral until they are 7 months old, however this was not simulated in this paper. We monitored the annual average proportion of herd reduction, the proportion of years with partial sales, the proportion of years with total sales, and the proportion of animals dying. These treatments were simulated with no supplementation. 3.3. Early weaning To evaluate early weaning, we simulated, in addition to normal weaning at 7 months (control), 3 scenarios in which calves are weaned at 3 months if cows have lost 1 BCS unit within the last month, 2 BCS units within the last 2 months, or 3 BCS units within the last 3 months. We monitored the weight of calves at weaning (3 or 7 months old), proportion of cows pregnant, the proportion of years with early weaning, and the proportion of animals dying. These treatments were simulated without supplementation; early weaned calves could be provided supplemental feed in a corral or put on irrigated pasture (Diaz-Solis et al., 2005) to help compensate for low weaning weights, but we do not explore those options in this paper. 3.4. Adjustment of breeding seasons To evaluate the adjustment of breeding seasons, we simulated breeding seasons (1) January–March, (2) March–May, (3) May–July, (4) July–September, (5) September–November, and (6) November–January. We monitored total maintenance energy requirements, energy intake, and basal metabolic requirements (all in Mcal cow 1 day 1). These treatments were simulated with no supplementation.
4. Results and discussion 4.1. Supplemental feeding Range productivity decreased as the level of supplemental feeding was increased, and this reduction was greater at heavy stocking rates Fig. 1(a)). Heavier cows (supplementation) permitted higher forage consumption from the rangeland and lower mortality. As residual forage was reduced, lighter cows (no supplementation) had reduced consumptive capacity while heavier cows continued to consume forage at these lower levels of residual forage, resulting in more complete utilization of the
H. Diaz-Solis et al. / Agricultural Systems 88 (2006) 514–527
RANGE PRODUCTIVITY CLASS
-1
519
-1
15 ha AUY
8 ha AUY
E
a G
F
P
BODY CONDITION
8
b 7
6
5
CALVES WEANED (kg ha
-1
-1
yr )
4
20
c
16
12
8
4
0.0
0.2
0.4
0.6
0.0
0.2
0.4
0.6
SUPPLEMENTATION (PROPORTION OF DEFICIT)
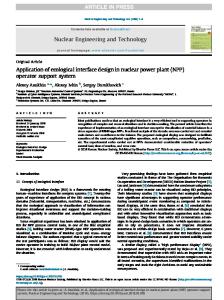
Fig. 1. Effect of energy supplementation scenarios (supplementation of 0, 0.20, 0.40, and 0.60 of the energy deficit) under moderate and heavy stocking rates on (a) range productivity classes (E = Excellent, G = Good, F = Fair, P = Poor), (b) body condition score, and (c) production of weaned calves. Each group of four bars in (a) represents the mean ± 1 SD for years 5, 10, 15, and 20 of simulated time. Bars in (b) and (c) represent the mean ± 1 SD for the entire 20-year simulation.
available forage. Reducing weight loss due to low forage availability by energy supplementation allowed the maintenance of high stocking rates, and elimination of this natural control led to range degradation. BCS was increased at higher levels of supplementation, however that increment was lower at high stocking rate (Fig. 1b). BCS was higher than desirable at the moderate stocking rate when supplementation was equal to 60% of the energy deficit.
520
H. Diaz-Solis et al. / Agricultural Systems 88 (2006) 514–527
Thus, supplementation was more important at high stocking rates, as reported by Kothmann et al. (1970). However, heavy supplementation and high stocking rate can lead to degradation of range productivity (Fig. 1(a)). Supplementation increased calf production at weaning (Fig. 1(c)). Production ranged from 7 kg ha 1 year 1 at the moderate stocking rate with no supplementation to 20 kg ha 1 year 1 at the heavy stocking rate with supplementation of 60% of the energy deficit. These values are close to those reported by Kothmann et al. (1970) for the Throkmorton Experimental Ranch; they observed productions of 12–40 ha 1 year 1 for moderate to heavy stocking rates in an area with an average annual precipitation of 600 mm, somewhat higher than the 500 mm that we are simulating. 4.2. Short-term reduction of stocking rate Short-term reduction of stocking rate had little effect on range productivity (Fig. 2(a)) or BCS (Fig. 2(b)) at either moderate or heavy stocking rates. The improvement in range productivity was observed only at the moderate stocking rate, which is in agreement with the experience of local ranchers. Although BCS and range productivity both were lower with heavy stocking, the declines in range productivity and average BCS were less under the strategy of selling cows (partial sales) when cows had lost 1 BCS unit during the previous 2 months. Delaying stocking rate reductions until cows had lost 2 or 3 BCS units during the previous 2 months, and no sales (control), resulted in higher levels of forage utilization and a greater decline in range productivity. At the moderate stocking rate, calf production at weaning was almost the same for the 4 strategies (close to 6.8 kg ha 1 year 1) (Fig. 2(c)). At the heavy stocking rate, calf production was highest under the scenario in which cows were sold when they had lost 2 or 3 BCS units (>10 kg ha 1 year 1), and under no sales (control), but was lower under the scenario in which cows were sold when they had lost 1 BCS unit than when no cows were sold; note that the control treatment had no herd reduction (higher population) and more weaning production than the 1 BCS treatment (more herd reduction and lower weaning production) (Table 1 and Fig. 2(c)), so, the 1 BCS treatment had lower weaning production, lower rangeland degradation, and herd mortality was lower than when cows were not sold (Table 1). When cows were sold when they had lost 2 or 3 BCS units, calf production at weaning was maximized because these treatments had the best balance among number of cows, pregnancy percentage, and weaning weight. For example, these treatments had fewer cows than the control treatment, but their higher pregnancy percentages and weaning weights more than compensated for the lower number of cows. At the moderate stocking rate, there was no noticeable difference in mortality among the various selling scenarios. The highest frequency of partial sales occurred at the heavy stocking rate under the scenario in which cows were sold when they had lost 1 BCS unit (Table 1); this high frequency of reductions in stocking rate resulted in the lowest percent of years in which the entire herd was sold (Table 1).
H. Diaz-Solis et al. / Agricultural Systems 88 (2006) 514–527
RANGE PRODUCTIVITY CLASS
-1
521
-1
15 ha AUY
8 ha AUY
E
a G
F
P
BODY CONDITION
9
b 7
5
3
-1
-1
CALVES WEANED (kg ha yr )
1
c 11
9
7
5
Control
-1
-2
-3
Control
-1
-2
-3
BODY CONDITION CHANGE FOR SALE
Fig. 2. Effect of short-term reduction of stocking rate scenarios (sale of animals based on loss of 1, 2, or 3 body condition units, and no sale (control)) under moderate and heavy stocking rates on (a) range productivity classes (E = Excellent, G = Good, F = Fair, P = Poor), (b) body condition score, and (c) production of weaned calves. Each group of four bars in (a) represents the mean ± 1 SD for years 5, 10, 15, and 20 of simulated time. Bars in (b) and (c) represent the mean ± 1 SD for the entire 20-year simulation.
4.3. Early weaning The different early weaning strategies had little effect on range productivity at the moderate stocking rate, but range productivity was reduced under all strategies at the heavy stocking rate because the heavier cows that resulted from early weaning led to increased range utilization (Fig. 3(a)). In terms of BCS of cows, the best early
522
H. Diaz-Solis et al. / Agricultural Systems 88 (2006) 514–527
Table 1 Effects of several decision rules for the sale of 50% of the herd (destocking) under two stocking rates in a rangeland with a mean annual precipitation of 500 mm Stocking rate (ha AUY 1) 15
8
Decision rule for sale
Herd reduction (%)
Mortality (%)
Years with partial sales (%)
Years with total sales (%)
Control 1 2 3
0.0 ± 0.0 5.19 ± 2.45 0.76 ± 1.68 0.46 ± 1.37
8.41 ± 3.78 5.80 ± 1.27 7.42 ± 1.48 7.47 ± 1.64
0.0 ± 0.0 13.5 ± 7.50 1.55 ± 3.38 0.50 ± 1.51
0.0 ± 0.0 0.60 ± 1.63 0.60 ± 1.63 0.50 ± 1.51
Control 1 2 3
0.0 ± 0.0 12.43 ± 2.47 7.96 ± 3.31 7.46 ± 3.14
25.78 ± 10.33 5.51 ± 2.53 12.72 ± 4.58 13.03 ± 5.29
0.0 ± 0.0 44.55 ± 8.01 11.50 ± 5.79 8.20 ± 3.45
0.0 ± 0.0 3.85 ± 4.86 8.65 ± 3.54 8.20 ± 3.44
Values presented are means ± 1 SD.
weaning scenario was to wean calves when cows had lost 1 BCS unit during the previous month (Fig. 3(b)). At the heavy stocking rate, with early weaning when cows had lost 1 BCS unit during the previous month, the BCS of cows was higher than the BCS of cows at the moderate stocking rate, with no early weaning. At the heavy stocking rate, early weaning ( 1 BCS in 1 month) produced the greatest improvement in calf production compared to no early weaning, 11.2 vs. 9.8 kg ha 1 year 1, respectively (Fig. 3(c)). With early weaning, although weaning weights were lower, frequency of pregnancy was higher, and cows entered their next lactation with a higher BCS, which resulted in more and heavier weaned calves. At the moderate stocking rate, these effects were much smaller. Early weaning had an effect on pregnancy at the heavy stocking rate (Table 2), as a result of the improvement in BCS (Fig. 3(b)). This is in accordance with the experience of local ranchers. However, at the moderate stocking rate, early weaning had only a slight effect on pregnancy. At the heavy stocking rate, early weaning treatments had lower mortality (Table 2), and early weaning occurred, on average, in 22.45–47.90% of the years (Table 2); the greatest reduction in mortality occurred when calves were weaned when cows had lost 1 BCS unit. Under moderate stocking, early weaning treatments had little effect on mortality, and early weaning occurred, on average, in only 1.55–12.90% of the years. 4.4. Adjustment of breeding seasons The effects of changing breeding season on range productivity were relatively small and did not differ noticeably among treatments (Fig. 4(a)). Seasonal changes in BCS at heavy and moderate stocking rates were the greatest for the spring breeding season (March–May) and the lowest for the fall breeding season (September– November) (Fig. 4(b)). At the heavy stocking rate, seasonal changes of BCS varied by 3.68 ± 0.54 units with the spring breeding season compared to a variation of 1.59 ± 0.59 units with the fall breeding season.
H. Diaz-Solis et al. / Agricultural Systems 88 (2006) 514–527
RANGE PRODUCTIVITY CLASS
-1
-1
15 ha AUY E
523
8 ha AUY
a
G
F
P 9
BODY CONDITION
b 7
5
3
CALVES WEANED (kg ha
-1
-1
yr )
1
13
c
11
9
7
5 Control
-1/1
-2/2
-3/3
Control
-1/1
-2/2
-3/3
TREATMENTS
Fig. 3. Effect of early weaning scenarios based on loss of 1, 2, or 3 body condition units in the last 1, 2 or 3 months respectively ( 1/1, 2/2 and 3/3, respectively), and no early weaning (control) under moderate and heavy stocking rates on (a) range productivity classes (E = Excellent, G = Good, F = Fair, P = Poor), (b) body condition score, and (c) production of weaned calves. Each group of four bars in (a) represents the mean ± 1 SD for years 5, 10, 15, and 20 of simulated time. Bars in (b) and (c) represent the mean ± 1 SD for the entire 20-year simulation.
Calf production was highest with spring breeding seasons (March–May or May– July) (Fig. 4(c)). The model estimates pregnancy probability based on BCS during the first month of the breeding season, without considering recent fluctuations in BCS or stability of BCS during a year, which can be more important for pregnancy. Thus, spring breeding seasons, with initially large decreases in BCS, permit a rapid
524
H. Diaz-Solis et al. / Agricultural Systems 88 (2006) 514–527
Table 2 Effects of several decision rules for early weaning under two stocking rates in a rangeland with a mean annual precipitation of 500 mm Stocking rate (ha AUY 1) 15
8
Decision rule for early weaning
Pregnancy rate (proportion)
Mortality (%)
Years with early weaning (%)
Control 1/1 2/2 3/3
0.83 ± 0.02 0.85 ± 0.01 0.85 ± 0.02 0.84 ± 0.01
6.41 ± 0.16 6.17 ± 1.03 6.57 ± 2.45 7.35 ± 1.46
0.0 ± 0.0 12.9 ± 5.78 9.15 ± 6.63 1.55 ± 3.15
Control 1/1 2/2 3/3
0.71 ± 0.06 0.82 ± 0.04 0.81 ± 0.04 0.76 ± 0.05
28.25 ± 10.26 10.51 ± 5.57 11.59 ± 5.32 17.99 ± 6.48
0.0 ± 0.0 47.90 ± 6.97 42.05 ± 9.35 22.45 ± 8.97
Values presented are means ± 1 SD.
recuperation of BCS via compensatory growth and a greater probability of pregnancy. For the moderate stocking rate, the bigger difference between the highest and lowest total energy requirements of cows across months during a year was obtained with the spring breeding season (March–May) (10.48 ± 0.68 Mcal cow 1 day 1) and the smallest difference was obtained with the fall breeding season (September– November) (3.64 ± 0.38 Meal cow 1 day 1). Since spring-bred cows calved in December, January, and February, their highest energy requirements (for lactation, thermoregulation) occurred during the season of lowest forage availability and quality, and their lowest energy requirements occurred during the season of high forage availability and quality, so spring-bred cows have higher rates of change of weight than fall-bred cows. Similar results were obtained for the high stocking rate treatments. Differences in the range of annual fluctuations in BCS among the different breeding seasons (Fig. 4(b)) were due to differences in total maintenance energy requirements. BCS is highly related to animal weight, so for the moderate stocking rate, the larger difference between the highest and lowest weight of cows during a year was obtained with the spring breeding season (March–May) (101.48 ± 13.80 kg cow 1) and the smallest was for fall-bred cows (September–November) (35.79 ± 14.47 kg cow 1). Similar results were obtained for high stocking rate treatments. Fall-bred cows were lactating during the season of greatest forage availability, which allowed them to have a lower reduction of their BCS during lactation. However, spring-bred cows were not lactating during the period of maximum forage growth and higher quality, thus they gained more weight during the summer and began winter with a higher body weight than fall-bred cows. This relationship produced a negative feedback that caused large decreases in BCS during winter for spring-bred cows (Fig. 4(b)). The higher body weight attained during the previous season of vegetation growth and the consequent rapid loss of BCS during winter, allowed larger increases in BCS during the following growing season via compensatory growth. Fall-bred cows maintained more stable BCS.
H. Diaz-Solis et al. / Agricultural Systems 88 (2006) 514–527
CALVES WEANED (kg ha
-1
15 ha AUY
8 ha AUY
E
a G
F
P 5
b 4 3 2 1 0
12
c
-1
-1
yr )
RANGE OF BODY CONDITION
RANGE PRODUCTIVITY CLASS
-1
525
10
8
6
4
1-3
3-5
5-7
7-9
9-11
11-1
1-3
3-5
5-7
7-9
9-11
11-1
BREEDING SEASON (months)
Fig. 4. Effect of adjustment of breeding season (1–3: January–March, 3–5: March–May, 5–7: May–July, 7–9: July–September, 9–11: September–November, or 11–1: November–January) under moderate and heavy stocking rates on (a) range productivity classes (E = Excellent, G = Good, F = Fair, P = Poor), (b) annual range of body condition score, and (c) production of weaned calves. Each group of four bars in (a) represents the mean ± 1 SD for years 5, 10, 15, and 20 of simulated time. Bars in (b) and (c) represent the mean ± 1 SD for the entire 20-year simulation.
5. Conclusions The best management practice to sustain range productivity and maintain a stable level of animal production for semi-arid rangelands is to maintain a moderate stocking rate. Cattle production in these ecosystems is tightly coupled to the vegetation; vegetation controls the population of herbivores and the population of herbivores
526
H. Diaz-Solis et al. / Agricultural Systems 88 (2006) 514–527
controls the vegetation. If we use management practices that artificially improve herbivore weight gains and reduce herbivore mortality, then we break this natural negative feedback that maintains the long-term equilibrium of the system, and range productivity is reduced. The degree of utilization of net primary production controls range productivity. Thus management practices such as supplemental feeding, which permit maintenance of a higher BCS and reduce mortality, cause higher consumption of vegetation and thereby reduce range productivity. Short-term reduction of high stocking rates reduces the deterioration of range productivity because of the reduction in the number of stock cows and bulls. Early weaning of calves improves BCS of cows and increases annual production of weaned calves. The increase in annual production of weaned calves with early weaning results from the production of more calves, since average weaning weights are lower. The lower weaning weights can be compensated for by maintaining early weaned calves on supplemental feed from 3 to 7 months of age. The September–November breeding season produces the least seasonal variation in BCS of cows; the January–June breeding seasons produce noticeably higher seasonal variability. Although the present model uses the current monthÕs BCS to determine percentage pregnancy, seasonal variation in BCS may be an even more important determinant of pregnancy. In summary, strategies to maintain or increase cattle production in semi-arid rangelands should be based on the use of a variable stocking rate that permits the optimum relationship between herbivores and vegetation and the improvement of natural forage production. References Behnke, R.H., Scoones, I., 1993. Rethinking range ecology: Implications for rangeland management in Africa. In: Behnke, R.H., Scoones, I., Kerven, C. (Eds.), Range Ecology at Disequilibrium. Overseas Development Institute, London, pp. 1–30. Blackburn, H.D., Kothmann, M.M., 1991. Modelling diet selection and intake for grazing herbivores. Ecological Modelling 57, 145–163. Carlson, D.H., Thurow, T.L. 1992. Spur-91: Workbook and User Guide. MP-1743, Tex. Agric. Exp. Sta., College Station. COTECOCA. 1979. Coahuila. Tipos de vegetacio´n, sitios de productividad forrajera y coeficientes de agostadero. Secretaria de Recursos Hidra´ulicos. Comisio´n Te´cnico Consultiva para la Determinacio´n Regional de los Coeficientes de Agostadero, Me´xico. Diaz-Solis, H., Kothmann, M.M., Hamilton, W.T., Grant, W.E., 2003. A simple ecological sustainability simulator (SESS) for stocking rate management on semi- arid grazinglands. Agricultural Systems 76, 655–680. Diaz-Solis, H., Kothmann, M.M., Grant, W.E., De Luna-Villarreal, R. 2005. Use of irrigated pastures in semi-arid grazinglands: A dynamic model for stocking rate decisions. Agricultural Systems, in press. Dix, R.L., Beidleman, R.G. (Eds.), 1969. The Grassland Ecosystem. A Preliminary Synthesis. Range Sci. Dept. Sci. Series No. 2., November 1969, Colorado State Univ., Fort Collins. Illius, A.W., Deny, J.F., Gordon, I.J., 1998. Evaluation of strategies for tracking climatic variation in semi-arid grazing systems. Agricultural Systems 57 (3), 381–398. Le Houreou, H.N., 1984. Rain use efficiency: a unifying concept in arid-land ecology. Journal of Arid Environments 7, 213–247.
H. Diaz-Solis et al. / Agricultural Systems 88 (2006) 514–527
527
Kothmann, M.M., Mathis, G.W., Marion, P.T., Waldrip, W.J. 1970. Livestock Production and Economic Returns from Grazing Treatments on the Texas Experimental Ranch. B-1100. Texas Agricultural Experiment Station, College Station. 37 p. NRC. 2000. Nutrient Requirements of Beef Cattle. Seventh revised edition: Update 2000. Available from: http//:www.nap.edu/openbook/0309069343/html/R11.html. The National Academy of Sciences. Olivares, E., Ibarra, H. 1999. Soil conservation and management on rangelands of northeast Me´xico. In: Proceedings of the Conservation and Use of Natural Resources and Marketing of Beef Cattle, 27–29 January, Universidad Auto´noma de Nuevo Leo´n, Monterrey, Nuevo Leo´n, Me´xico. Redmon, L.A. 1999. Conservation of soil resources on lands used for grazing. In: Proceedings of the Conservation and Use of Natural Resources and Marketing of Beef Cattle, 27–29 January, Universidad Auto´noma de Nuevo Leo´n, Monterrey, Nuevo Leo´n, Me´xico. Van de Koppel, J., Rietkerk, W., 2000. Herbivore regulation and irreversible vegetation change in semiarid grazing systems. Oikos 90, 253–260. Wight, J.R. (Ed.), 1983. SPUR – Simulation of Production and Utilization of Rangelands: A Rangeland Model for Management and Research. US Dept. Agric., Misc. Pub. No. 1431, 120 p. Wight, J.R., Skiles, J.W. (Eds.), 1987. SPUR: Simulation of Production and Utilization of Rangelands. Documentation and User Guide. US Dept. Agric., Agric. Res. Serv., ARS 63, 372 p.