AMERICAN JOURNAL OF PHYSICAL ANTHROPOLOGY 115:1–12 (2001)
Ancient Mitochondrial DNA Evidence for Prehistoric Population Movement: The Numic Expansion Frederika A. Kaestle1* and David Glenn Smith2 1
Department of Anthropology, Yale University, New Haven, Connecticut 06520 Department of Anthropology, University of California, Davis, California 95616
2
KEY WORDS
Native American; Great Basin; Uto-Aztecan; aDNA; molecular archaeology
ABSTRACT The mitochondrial DNA of modern Native Americans has been shown to fall into one of at least five haplogroups (A, B, C, D, or X) whose frequencies differ among tribal groups. The frequencies of these five haplogroups in a collection of ancient individuals from Western Nevada dating to between approximately 350 –9,200 years BP were determined. These data were used to test the hypothesis, supported by archaeological and linguistic data, that the current inhabitants of the Great Basin, the Numic speakers, are recent immigrants into the area who replaced
the previous non-Numic inhabitants. The frequency distributions of haplogroups in the ancient and modern Native Americans differed significantly, suggesting that there is a genetic discontinuity between the ancient inhabitants and the modern Numic speakers, providing further support for the Recent Numic Expansion hypothesis. The distribution of mitochondrial haplogroups of the ancient inhabitants of the Great Basin is most similar to those of some of the modern Native American inhabitants of California. Am J Phys Anthropol 115:1–12, 2001. © 2001 Wiley-Liss, Inc.
A long-debated question regarding Great Basin cultural history concerns the prehistoric movement of Native Americans into and within this region. Currently, Numic-speaking Native Americans inhabit most of the Great Basin (Miller, 1986).
ulary and of place names support this hypothesis (Miller et al., 1971; Fowler, 1972; Nichols, 1981; Miller, 1986). The ethnic affiliation of the previous, presumably non-Numic, inhabitants is unknown, and all of the major Native American groups of the area have at various times been suggested as descendants of these pre-Numic inhabitants (Hopkins, 1965; D’Azevedo et al., 1966; Fowler, 1977; Jorgensen, 1980; Moratto, 1984). However, both linguists and archaeologists have suggested alternative hypotheses. Several archaeologists have proposed that the Numic presence in the Great Basin is quite ancient. They see little evidence in the archaeological record for a discontinuity representing a population replacement at any time in the past several thousand years, or interpret such evidence as support not for a population movement but for local adaptation to increasing population density and environmental change (Swanson, 1962; Elston, 1982; Aikens and Witherspoon, 1986; Raven, 1994). Some linguists also agree that a long history in the Great Basin is compatible with the modern distribution of Numic languages (Goss, 1977; Crapo and Spykerman, 1979). It is apparent that the spread of genes, language, and material culture can
NUMIC EXPANSION HYPOTHESIS In 1958, Lamb used glottochronology to place the divergence of the Numic family of languages at approximately 1,000 years ago. Following Steward (1940), Lamb (1958) suggested that Numic speakers expanded into the Great Basin from a proto-Numic homeland in the southwestern Great Basin, perhaps Death Valley (as this was the area of highest linguistic diversity of Numic languages; Fig. 1). This scenario has since received support from both archaeologists and linguists. Many archaeologists see evidence, in the form of shifts in technology (e.g., point types, and basketry and pottery styles) and residence patterns, for a population replacement in the Great Basin within the last 1,000 years, accompanied by a change in subsistence strategy (Grosscup, 1960; Bettinger and Baumhoff, 1982; Sutton, 1991; Young and Bettinger, 1992; Adovasio and Pedler, 1994; Bettinger, 1994; Janetski, 1994; Delacorte, 1995). They also find evidence supporting a Numic homeland to the southwest of the Great Basin (e.g., Owens Valley). Linguists have also supported the hypothesis of an expansion of the Numicspeaking peoples northeast into the area at this time. They believe that lexicostatistics, the distribution of modern Numic languages, linguistic borrowing, and lexical analysis of floral and faunal vocab©
2001 WILEY-LISS, INC.
Grant sponsor: NSF; Grant numbers: GER9255683, SBR9630926; Grant sponsor: NIH; Grant numbers: RR00169, RR05090. *Correspondence to: Frederika Kaestle, Department of Anthropology, Yale University, 51 Hillhouse Ave., New Haven, CT 06520. E-mail:
[email protected] Received 17 November 1999; accepted 2 November 2000.
2
F.A. KAESTLE AND D.G. SMITH
Fig. 1. Distribution of modern Numic languages at contact. After Madsen and Rhode (1994).
occur at disparate times and rates and by different routes. NATIVE AMERICAN MITOCHONDRIAL DNA HAPLOGROUPS Mitochondrial DNA (mtDNA) extracted from prehistoric skeletal material provides another potential source of evidence regarding prehistoric population movement in the Great Basin. Recent studies have shown that certain mtDNA mutations characterize at least five distinct founding matrilines (haplogroups A, B, C, D, and X) to which most modern Native Americans belong (Schurr et al., 1990; Torroni et al., 1992; Horai et al., 1993; Scozzari et al., 1997; Brown et al., 1998; Stone and Stoneking, 1998). These haplogroups are minimally defined by four restriction fragment length polymorphisms and the presence or absence of an intergenic 9-bp deletion (Table 1), and their frequencies vary significantly among modern Native American groups (e.g., Merriwether et al., 1994, 1996; Lorenz and Smith,
1996). In fact, some tribes completely lack one or more of the lineages (Lorenz and Smith, 1996). This variation in the frequency distribution of the five haplogroups allows us to test hypotheses of relatedness between tribes, and also ancestor-descendant relationships between ancient and modern populations. Groups that are closely genetically related should exhibit similar frequencies of the five haplogroups, while groups with very different frequencies are probably not closely related to each other. Of course, this inference is based on the assumption that the frequencies of haplogroups in modern tribal groups are similar to those of their ancestors. Major genetic bottlenecks might have accompanied population declines associated with European contact with North American tribes, and genetic drift in small populations might have resulted in significant changes in haplogroup frequencies. However, contrary to expectations, there is limited evidence to support the assumption that the frequencies of the mitochondrial haplogroups did not change significantly due to genetic drift. First, the haplogroup frequency distribution of different tribes thought to be closely related, such as the Yuman-speaking tribes in the southwest and Baja, are often very similar (Lorenz and Smith, 1996; Smith et al., 1999). Second, comparisons of the frequencies of the four most common Native American haplogroups (A, B, C, and D) in the ancient populations of Norris Farms in Illinois (dated to AD 1300; Stone and Stoneking, 1993, 1998), the ancient Fremont from Utah (dated to 1700 –750 yBP; Parr et al., 1996), and the ancient Anasazi from Utah and Arizona (dated to between 500 –2000 years BP; Carlyle personal communication) to those of their probable modern descendants are consistent with ancestor/ descendant relationships, and hence the absence of a large degree of genetic drift (Lorenz and Smith, 1994, 1996; Kaestle, 1995, 1998; Kaestle et al., 1999). In fact, a recent survey of mitochondrial haplogroup frequencies in modern and ancient Native North Americans found evidence that “differentiation of regional patterns of mtDNA lineage variation occurred early in North American prehistory (much more than 2,000 years B.P.), has remained relatively stable since its origin, and was little influenced by the disruptions hypothesized for other genetic systems” (O’Rourke et al., 2000, p. 15). Nonetheless, the issue of possible confounding ef-
TABLE 1. Markers identifying the five common mitochondrial haplogroups found among modern Native Americans1 Haplogroup A B C D X Other 1
HaeIII np 663
9-bp deletion
HindII np 13259
AluI np 13262
AluI np 5176
DdeI np 1715
⫹ ⫺ ⫺ ⫺ ⫺ ⫺
⫺ ⫹ ⫺ ⫺ ⫺ ⫺
⫹ ⫹ ⫺ ⫹ ⫹ ⫹
⫺ ⫺ ⫹ ⫺ ⫺ ⫺
⫹ ⫹ ⫹ ⫺ ⫹ ⫹
⫹ ⫹ ⫹ ⫹ ⫺ ⫹
np, nucleotide position; ⫹, presence of a restriction site; ⫺, absence of a restriction site.
ANCIENT NATIVE AMERICAN DNA
Fig. 2.
3
Distribution of modern groups as defined for this study. A: Language groups. B: Geographic groups.
fects of genetic drift on our comparisons will be revisited below. Thus, comparisons of distributions of haplogroups in modern and prehistoric populations in at least some regions can be used to test hypotheses about ancestor/descendant relationships (e.g., Hagelberg and Clegg, 1993; Kaestle, 1995, 1997; O’Rourke et al., 1996; Parr et al., 1996). For the reasons stated above, it seems unlikely that the ancient population in Western Nevada is ancestral to any modern group from which its frequencies of the five mtDNA haplogroups differ significantly. Therefore, if the recent Numic expansion hypothesis is correct, a genetic discontinuity between the ancient Native Americans in the Great Basin, who predate the time of Numic expansion, and the modern local inhabitants, who are descendants of the Numic immigrants, should be apparent in the frequencies of these five haplogroups. If, on the other hand, the modern Numic groups of the Great Basin have inhabited the region for millennia, the frequencies of the five haplogroups in the ancient Great Basin groups should be similar to those seen in the modern inhabitants. POPULATIONS SAMPLED Data for the modern Native American groups studied were taken from the literature (Schurr et
al., 1990; Torroni et al., 1992; Merriwether et al., 1995; Lorenz and Smith, 1996; Kaestle, 1997; Smith et al., 1999). Because the relationship among genes, language, and geography is often complicated (Campbell, 1986; Weiss and Woolford, 1986; Ruvolo, 1987; Lorenz and Smith, 1994), the modern samples were sorted into both language groups and geographic regions for estimating and comparing frequencies of the four most common mtDNA haplogroups. The language groups compared (Jorgensen, 1980; Greenberg, 1987; Campbell, 1997) consist of eight subsets of three larger groups: Penutian (California Penutian and Zuni), Hokan (Northern Hokan, Yuman, Washo, and Central Coast Hokan), and Uto-Aztecan (Northern Uto-Aztecan, which includes the Numic, Tubatulabalic, Takic, and Hopic speakers, and Central Uto-Aztecan, all Piman; Fig. 2A), although the validity of the first two of these large groups is very controversial. The geographic regions (Fig. 2B) include four of those defined by Driver (1961): California, Baja, the Great Basin, and the Southwest (Driver’s “Oasis”). The languages and geographic affiliations, and mtDNA haplogroup frequencies of the tribal groups sampled for this study, are given in Table 2.
4
F.A. KAESTLE AND D.G. SMITH TABLE 2. Frequencies of five common Native American haplogroups in modern language and geographic groups and in ancient groups1 Group
Penutian Hokan
Uto-Aztecan Great Basin California Southwest Baja Ancient
Subgroup
Sample size2
%A
%B
%C
%D
%X
California Penutian Zuni Northern Hokan Yuman Washo Central Coast Hokan Northern Uto-Aztecan Central Uto-Aztecan
16 20 6 80 28 11 116 37 127 37 98 43 30 21 18 39
12 20 0 4 0 46 0 5 0 19 8 0 0 5 11 8
44 70 33 62 53 18 42 57 44 35 61 44 83 38 33 36
0 10 17 34 36 9 15 38 17 8 31 17 10 0 0 0
44 0 33 0 11 27 43 0 39 35 0 39 7 57 56 56
0 0 17 0 0 0 0 0 0 3 0 0 0 0 0 0
Fremont Stillwater Marsh Pyramid Lake West. Nev. Combined
1
Data on frequency of haplogroup X are from Smith et al. (1999). Tribal groups and number of individuals from each tribe included in each language group, with geographic assignments of each tribal group in parentheses (NI, not included), are as follows: California Penutian includes 5 Costanoan/Ohlone (CA), 1 Miwok (CA), 1 Maidu (CA), and 9 Yokuts (CA) individuals; Zuni includes 20 Zuni (SW) individuals; Northern Hokan includes 1 Karok (CA), 1 Achumawi (CA), and 4 Pomo (CA) individuals; Yuman includes 5 Walapai (SW), 5 Havasupai (SW), 5 Yavapai (SW), 8 Paipai (BJ), 19 Quechan (SW), 3 Mojave (SW), 16 Kumiai (BJ), 3 Cocopa (BJ), 3 Kiliwa (BJ), and 13 Cochimi (BJ) individuals; Washo includes 28 Washo (GB) individuals; Central Coast Hokan includes 2 Salinan (CA) and 9 Chumash (CA) individuals; Northern Uto-Aztecan includes 98 Northern Paiute/Shoshone (BG), 1 Kawaiisu (GB), 4 Tubatulabal (CA), 4 Kitanemuk (NI), 1 Gabrieleno (NI), 1 Luiseno (NI), 1 Juaneno (NI), 1 Fernandeno (NI), 1 Cahuilla (NI), and 4 Hopi (SW) individuals; Central Uto-Aztecan includes 37 Pima (SW) individuals. CA, California; SW, Southwest; BJ, Baja; GB, Great Britain.
2
Bone samples from 21 prehistoric individuals from the Pyramid Lake region and 27 prehistoric individuals from the Stillwater Marsh region of Western Nevada were obtained from the Nevada State Museum. All of the samples from Pyramid Lake have been 14C dated to between 860 ⫾ 75 and 9200 ⫾ 60 yBP (Dansie, 1997, and personal communication); some of those from Stillwater Marsh, and organic remains associated with them, have been 14 C dated to between 290 ⫾ 80 and 3290 ⫾ 90 yBP (Raven and Elston, 1988; Kelly, 1995; Larsen, 1995). Projectile points recovered at Stillwater Marsh also indicate a date between 3250 – 650 yBP (Kelly, 1995; Larsen, 1995). Therefore, the individuals sampled for this study date to a time period that almost completely precedes the hypothesized date of the Numic expansion. The osteological homogeneity of the Stillwater Marsh skeletal series (Brooks et al., 1988; see also Kelly, 1995) and the geographical proximity of the Stillwater Marsh and Pyramid Lake sites (within 40 miles of each other) suggest that these two ancient samples can be regarded as members of a single population for the purposes of a genetic analysis. A prehistoric Fremont sample of 30 individuals from the Great Salt Lake wetlands, dating to between 700 –1750 yBP (Parr et al., 1996), was also included in the analysis for comparison. Since the haplogroup frequency distribution of this sample was found not to differ from that of the prehistoric Anasazi populations of Grand Gulch and Canyon del Muerto in southeastern Utah and northeastern Arizona, respectively (Carlyle, personal communication), only the Fremont sample was included in our comparisons.
METHODS DNA extraction and amplification Extraction and amplification setup were performed in a laboratory physically separate from that in which amplification took place, using an ultraviolet (UV)-irradiated, bleach-sterilized glovebox with dedicated equipment, and DNA-free disposables. Precautions cited by Kelman and Kelman (1999) designed to prevent contamination of the ancient samples were followed as closely as possible. Bone samples from the Stillwater Marsh individuals had been previously processed (ground to a powder and deproteinized in a buffered saline solution) for a study of albumin polymorphism (Smith et al., 1995). Bone samples from the Pyramid Lake individuals were intact fragments. To eliminate any minor surface contamination, the bone fragments from the Pyramid Lake individuals were cross-linked for 10 min on each side with UV light (254 nm), and in some cases soaked for approximately 5 min in a 5% bleach solution. These samples were then ground to a powder in bleach-sterilized, UV-irradiated electric coffee grinders. Approximately 0.25 g of powdered bone from the Pyramid Lake individuals or 0.25 g of deproteinized bone residue from the Stillwater Marsh individuals were incubated with slight agitation for 72–96 h at 4°C in 0.5 M EDTA, pH 8.0, changing the EDTA solution every 24 h. The decalcified bone powder was then incubated overnight at 55°C in a proteinase K buffer (50 mM Tris, pH 8.0, 1 mM CaCl2, 1 mM DTT, 5% Tween-20, and 1 mg/ml proteinase K). Samples were then successively extracted with phenol, phenol-chloroform (1:1), and
5
ANCIENT NATIVE AMERICAN DNA
chisam (chloroform:isoamyl alcohol, 24:1), concentrated to approximately 50 l with Centricon威 100 microconcentrators (Amicon), washed twice with Tris-EDTA, pH 8.0 (TE) or ddH2O, and then reconcentrated to 50 –100 l. Negative controls were also processed at each step of the extraction protocol, and multiple independent extracts were performed for each sample. A master PCR mix containing all reagents (0.6 mM primers, 1 ⫻ manufacturer’s buffer, ddH2O, 1 mg/ml BSA, 200 nM dNTPs) except the Taq polymerase and the ancient DNA template was UV cross-linked for 10 min to eliminate any exogenous DNA contamination. Coordinates for primers used to amplify the fragment containing the restriction site (or 9-bp deletion) characteristic of each haplogroup indicated are as follows: A, 591– 611 and 765– 743 (Stone and Stoneking, 1993) or 610 – 635 and 698 – 677 (Handt et al., 1996); B, 8249 – 8267 and 8352– 8332 (Parr et al., 1996) or 8195– 8215 and 8316 – 8297 (Wrischnik et al., 1987); C, 13237–13256 and 13419 –13397 (Parr et al., 1996) or 13236 –13257 and 13310 –13290 (Handt et al., 1996); D, 5099 –5120 and 5246 –5229 (Parr et al., 1996) or 5106 –5127 and 5211–5190 (Handt et al., 1996); X, 1651–1670 and 1793–1776 (designed by F.A.K. using Amplify 1.2; Engels, 1992); and I, 9911–9932 and 10107–10088 (Torroni et al., 1996). The equivalents of “hot start” amplifications were performed in 25-l volumes using 3–5 l ancient DNA extract and 1.5 units of Amplitaq Gold DNA polymerase (Perkin Elmer) or Platinum Taq DNA polymerase (Gibco BRL). The amplifications were subjected to an initial 4 –11-min denaturation step at 95°C, then 35– 45 cycles in which reactions were denatured at 95°C for 15 s, annealed at 49 –59°C for 15 s, and extended at 72°C for 25 s, followed by a final extension step of 3 min at 72°C. The negative controls cited above were included in each amplification, and multiple extractions were analyzed for each sample.
same population (Thomas, 1976). The modern Northern Hokan language group was excluded from this comparison due to its small sample size (N ⫽ 6). Due to sampling error, it is possible that a sample size as small as 39 individuals provides an inaccurate estimate of the frequencies of the five haplogroups in the ancient inhabitants of Western Nevada, even if those inhabitants were both ancestral and genetically identical to the modern inhabitants. To test this hypothesis, simulations were run to produce 10,000 replicate samples of 39 individuals, each drawn randomly from the pool of modern individuals in the Northern Uto-Aztecan and Numic language groups and the Great Basin geographic group, each with its empirically observed frequency distribution of mtDNA haplogroups. The haplogroup frequency distribution of each of these 10,000 samples was compared to that of the original modern sample, and the (10,000) values of chi-square (for homogeneity) were calculated (program written by P.A. Vick, 1998, personal communication). The actual observed chi-square values for comparisons between the ancient and the modern samples were then compared to the distribution of simulated chisquare values to assess the probability of drawing such an atypical sample of 39 individuals from the (modern) population under consideration. Phylogenetic analysis
Five to ten microliters of amplification product containing the restriction site gain that characterizes haplogroup A and the restriction site losses that characterize haplogroups C, D, and X were digested overnight at 37°C with 5 units HaeIII, HindII/AluI, and AluI and DdeI, respectively, according to manufacturers’ recommendations. Restriction fragments and the presence/absence of the 9-bp deletion were resolved on 6% polyacrylamide gels, stained with ethidium bromide, visualized, and then photographed, on a UV transilluminator using an IS2000 imaging system (Alpha Innotech).
Excluding haplogroup X, which was absent in all the modern samples except one Northern Hokan individual and unconfirmed in the ancient samples, the frequencies of the Native American haplogroups can be treated as four alleles at a single (the mtDNA) locus. Genetic distances between the populations studied were calculated from the frequencies of these haplogroups in each population (Cavalli-Sforza and Edwards, 1967; Nei, 1972). These genetic distances, unlike the chi-square test for homogeneity, are independent of sample size (although the small sample sizes for some modern groups in this study might have resulted in biased haplogroup frequency distributions in some cases). The GENDIST program from the PHYLIP 3.572c software package (Felsenstein, 1998) was used to estimate chord distances (Cavalli-Sforza and Edwards, 1967) between the ancient and modern groups. Phylogenetic trees were produced from these data using the unweighted pair group method of analysis (UPGMA), Neighbor-Joining, and Fitch-Margoliash methods (with randomized input order) of the FITCH and NEIGHBOR programs, and were drawn using the DRAWTREE program from the PHYLIP 3.572c software package (Felsenstein, 1998).
Statistical analysis
RESULTS
The frequencies of the five haplogroups in the modern and ancient groups were compared, using a chi-square test for homogeneity, to test the null hypothesis that the two samples were drawn from the
Nineteen of the 21 ancient Pyramid Lake samples could be assigned to one of the five modern Native American haplogroups (Table 3). One sample (NSM25) does not belong to any of these haplo-
Haplogroup assignment
6
F.A. KAESTLE AND D.G. SMITH TABLE 3. Mitochondrial haplogroup assignments of ancient individuals from Pyramid Lake sites (NSM) and Stillwater Marsh sites (SW)1
Laboratory ID NSM1 NSM2 NSM6 NSM7 NSM8 NSM9 NSM10 NSM11 NSM12 NSM13 NSM14 NSM15 NSM16 NSM17 NSM18 NSM19 NSM20 NSM21 NSM22 NSM23 NSM25 SW1 SW2 SW3 SW4 SW5 SW6 SW7 SW8 SW9 SW10 SW11 SW12 SW13 SW14 SW15 SW16 SW17 SW18 SW19 SW20 SW21 SW22 SW23 SW24 SW25 SW26 SW27 1
Museum ID
A (HaeIII)
B (9-bp del)
Ahur 2016 ⫺(2), ⫹(2) ⫺(2) Ahur 2017 ⫺(2) ⫹(2) Ahur 830 ⫺(2) ⫺(2) Ahur 869 ⫺(3) ⫺(2) Ahur 870 ⫺(2) ⫺(2) Ahur 871 ⫺(2) ⫺(2) 26DO524 b1 ⫺(2) ⫺(2) 26DO524 b2 ⫺(2) ⫺(2) Ahur 862 ⫺(3) ⫹(2) Ahur 2007 ⫺(2) ⫹(2) Ahur 2011 ⫹(2) ⫺(2) Ahur 2022 ⫺(2) ⫹(2) Ahur 2023 ⫺(2) ⫺(2) Ahur 840 ⫺(3) ⫺(3) Ahur 846 ⫺(2) ⫺(2) Ahur 853 ⫺(3) ⫺(2) Ahur 778 ⫺(2) ⫺(2) Ahur 779 ⫺(3) ⫹(3) Ahur 844 ⫺(2) ⫹(2) Ahur 845 ⫹(2) ⫺(2) Ahur 866 ⫺(3) ⫺(3) (26CH1043) 5-2⫺(2) ⫺(3) 4(a) (1043) 37-3-30(a) ⫺(2) ⫺(3) (1043) 61-1-18 ⫺(2) ⫺(2) (1044) 1-2-32(a) ⫺(3) ⫹(3) (1044) 2-3-30(b) ⫺(2) ⫺(2) (1045) 1-2-15(a) ⫺(2) ⫺(3) (1046) 2A-3⫺(2) ⫺(2) 29(a) (1046) 2B-327(a) (1046) 9-11-31(b) ⫺(2) ⫺(3) (1047) 1-1-13 ⫺(2) ⫹(2) (1050) 3-5-31(b) ⫺(2) ⫹(2) (1054) 1-3-26(b) ⫺(2) ⫺(4) (1055) 1-4-9(b) ⫺(2) ⫺(3) (1058) 12-10-(a) ⫺(2) ⫺(2) (1062) 1-2-30(a) ⫺(2) ⫹(2) (1063) 20-2-16 ⫺(2) ⫹(2) (1064) 1-2-19 ⫹(2) ⫺(3) (1070) 3-3-31 ⫺(2) ⫺(2) (1070) 4-3-42 ⫺(2) ⫹(3) (1158) 1-1-13 ⫺(3) ⫺(2) (1159) 4-1-32(b) ⫺(2) ⫺(3), ⫹(1) (1159) 6-1-29 ⫺(3) ⫹(2) (1159) 7-1-31(c) ⫺(2) ⫺(2) (1159) 200 ⫺(2) L53 (1160) 2-10-1 ⫺(2) ⫹(2) L72-200 ⫺(2) ⫺(1)
C (combined)
D (AluI)
⫹(1) ⫺(3) ⫺(2) ⫺(3) ⫺(2) ⫺(3) ⫺(1) ⫺(1) ⫺(1) ⫺(2)
(4) (2) (2) (3) (2) (2) (2) (2) (3) (2) (2) (2) (2) (3) (2) (4) (2) (3) (2) (2) (2) (3)
⫹(2), ⫺(2) ⫹(2) ⫺(2) ⫺(3) ⫺(2) ⫺(2) ⫺(2) ⫺(2) ⫹(3) ⫹(2) ⫹(3) ⫹(2) ⫹(2) ⫺(3) ⫺(2) ⫺(3) ⫺(2) ⫹(3) ⫹(2) ⫹(2) ⫹(3) ⫺(2)
⫺(2) ⫺(1) ⫺(1) ⫺(2) ⫺(1) ⫺(2)
(2) (2) (2) (2) (2) (2)
⫺(2) ⫺(4) ⫹(3) ⫺(4) ⫺(4) ⫺(2)
⫺(2) ⫺(2) ⫺(1) ⫺(1) ⫺(2) ⫺(1) ⫺(1) ⫺(1) ⫺(3) ⫺(3) ⫺(2) ⫺(2) ⫺(2) ⫺(3) ⫺(3)
(2) (2) (2) (2) (2) (2) (2) (2) (3) (3) (2) (2) (2) (3) (3)
⫹(2), ⫺(1) ⫹(3) ⫹(2) ⫺(3) ⫺(3) ⫺(3) ⫹(2) ⫹(2) ⫹(3) ⫺(3) ⫹(3) ⫹(3) ⫹(3) ⫹(2) ⫺(3) ⫹(1)
⫺(2) ⫺(2)
(2) (2)
⫹(3) ⫺(2)
C (HincII)
C (AluI)
⫹(1) ⫹(1) ⫹(1) ⫹(2) ⫹(2) ⫹(2) ⫹(1) ⫹(2) ⫹(3) ⫹(2) ⫹(2) ⫹(2) ⫺(1)
⫺(3) ⫺(1) ⫺(1) ⫺(1)
⫹(1) ⫹(1) ⫹(1) ⫹(1) ⫹(1) ⫹(1) ⫹(1) ⫹(1) ⫹(1)
⫹(1) ⫹(1) ⫹(1) ⫹(1) ⫹(1) ⫹(1)
⫺(1) ⫺(2)
X (DdeI)
I (AluI)
Haplogroup A/D B D D D D D D B B A B C D D D D B B A other D
⫹(2)
D D B D D D
⫺(3)
⫺(3)
⫹(6)
⫺(3)
⫹(1)
⫺(2), ⫹(1) ⫹(3)
⫺(2)
⫹(1)
Date (yBP) 3725 ⫾ 105 860 ⫾ 75 2935 ⫾ 140 4745 ⫾ 115 2735 ⫾ 100 2434 ⫾ 85 1620 ⫾ 50 1490 ⫾ 50 1820 ⫾ 180 1360 ⫾ 80 1520 ⫾ 90 5905 ⫾ 125 9200 ⫾ 60 3630 ⫾ 60 2430 ⫾ 100 3165 ⫾ 370 1620 ⫾ 90 1950 ⫾ 100 3540 ⫾ 95 4504 ⫾ 105 4435 ⫾ 110
1140 ⫾ 80
D/X B B 290 ⫾ 80 D D 1860 ⫾ 70 D B 1100 ⫾ 120 B A D B 660 ⫾ 30 X/other B/other 1080 ⫾ 50 B D 2265 ⫾ 70 B D
820 ⫾ 70
Numbers in parentheses indicate number of ancient DNA extracts from an individual giving those results.
groups, and could represent either a sixth Native American haplogroup, a recent mutation causing the loss of the restriction site used to identify its true haplogroup, or contamination of the bone sample. The remaining sample (NSM1) did not amplify well and could not be placed unambiguously into one haplogroup; both samples were excluded from the analysis. The only sample possessing the C haplogroup markers was also excluded from the analysis because it is more than 3,000 years older than any of the other samples studied. Of the 18 remaining samples from Pyramid Lake whose haplogroups were identified, 2 (11.1%) were A, 6 (33.3%) were B, and
10 (55.6%) were D (see Table 2). These haplogroup assignments were confirmed in preliminary analyses of sequencing data from the first hypervariable segment of the mitochondrial control region (Kaestle and Smith, unpublished data). The dates for the oldest representative of each of these three haplogroups fell between 4500 – 6000 yBP, and the haplogroup membership (with the exception of the single sample assigned to haplogroup C, dated at 9200 yBP, that was eliminated from statistical comparisons) appears to be uncorrelated with date of samples. Twenty-one of the 27 ancient Stillwater Marsh samples could be assigned to one of the modern
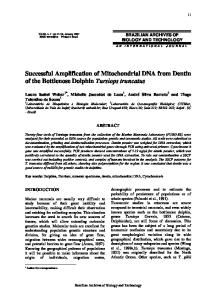
ANCIENT NATIVE AMERICAN DNA
Fig. 3. Histogram of frequencies of the four most common Native American haplogroups in ancient and modern groups.
Native American haplogroups (Table 3). While testing the Stillwater Marsh samples for the markers that identify the five Native American haplogroups, it became apparent that some of these ancient samples had become contaminated with the modern DNA of one of the authors (D.G.S.), who extracted albumin from them for an earlier study (Smith et al., 1995). However, because this individual does not belong to any of the Native American haplogroups, it was still possible to identify the haplogroup for most of the Stillwater samples. Of the 21 samples from Stillwater Marsh in which the haplogroup was identified, 1 (4.8%) was A, 8 (38.1%) were B, none were C, and 12 (57.1%) were D (see Table 2). Two additional samples might belong to haplogroup X (SW9 and SW20), as they lack the DdeI site at np 1715 (and lack the AluI site at np 10028 that, in combination with the DdeI site loss, identifies European haplogroup I (Torroni et al., 1996), of which one of the authors (F.A.K.) is a member). However, as some DNA extracts from these samples contradict the assignment of these samples to haplogroup X, and as preliminary analyses of mitochondrial control region sequence suggest they might have been contaminated (Kaestle, 1998), they have been excluded from these analyses. Since the frequency distributions of haplogroups in these two samples (the ancient Pyramid Lake and Stillwater Marsh groups) were not statistically significantly different (2 ⫽ 0.617, P ⫽ 0.735), and there appeared to be no correlation between mtDNA haplogroup and 14C dates, the two sets of samples were combined, providing a total sample size of 39; 3 (7.7%) are A, 14 (35.9%) are B, none are C, and 22 (56.4%) are D (see Table 2). A visual comparison of the frequencies of the four most common haplogroups among the modern and ancient groups is provided by the histogram in Figure 3. The ancient Western Nevada group exhibits a very high frequency of haplogroup D, while the ancient Fremont group exhibits a very high frequency of haplogroup B, the most common haplogroup among modern Native American inhabitants of the Southwest and Baja. The haplogroup frequency distribution of the ancient Western Nevada group is statistically significantly different (P ⬍ 0.025) from
7
that of all modern language groups (excluding the Northern Hokan sample, N ⫽ 6) except for the California Penutians and from that of all modern geographic groups except California (Table 4). In no case did any of the 10,000 chi-square values for the replicates in the three chi-square simulations exceed that obtained when the ancient Western Nevada group was compared to the modern group, and fewer than 5% of them exceeded a chi-square value of 11. The average of the chi-square values from the simulations was approximately 1.5 in all three cases, with an associated P value of about 0.68, suggesting that samples of 39 individuals drawn from the modern populations adequately represent the frequency distribution of their haplogroups. These results support the conclusion that the frequency distribution of haplogroups in the ancient sample is unlikely to have been sampled from a population whose haplogroup frequency distribution is similar to that of the modern Numic inhabitants of the Great Basin. Genetic distances between the ancient sample and the modern samples clustered by language and geography are shown in Tables 5 and 6. Using these distances, all phylogenetic methods employed produced trees with the same topology. Representative phylogenetic trees depicting the relationships among both the language and the geographic groups are provided in Figure 4. In the language group tree (Fig. 4A), the ancient Western Nevada sample forms a clade with the modern California Penutian, while the ancient Fremont sample is grouped with the modern Zuni, Central Uto-Aztecan, and Yuman (all southwestern groups). The modern Northern UtoAztecan, Washo, and Northern Hokan are intermediate. In the geographic group tree (Fig. 4B), the ancient Western Nevada population forms a group with the modern Californians, while the ancient Fremont are grouped with the modern Southwest and Baja groups. Again, the modern Great Basin group is intermediate, although more closely allied with the modern Californians and ancient Western Nevadans. DISCUSSION AND CONCLUSIONS The lack of any correlation between the 14C dates of the samples and their haplogroup affiliations is consistent with our hypotheses, also supported by morphometric data (Kelly, 1995), that the 39 ancient individuals studied can be regarded as a population and that their mtDNA haplogroup frequency distributions have not been influenced significantly by genetic drift. If the frequencies of the haplogroups in modern tribal groups reflect those of their ancestors, the comparison of the haplogroup frequency distribution of the ancient Western Nevada group with those of the modern groups provides additional support for the Numic Expansion Hypothesis. To the authors’ knowledge, the Pyramid Lake samples reported here include the oldest published examples of each of the common Native American haplogroups,
8
F.A. KAESTLE AND D.G. SMITH TABLE 4. Chi-square values for test of homogeneity of frequencies of four most common Native American haplogroups between ancient Western Nevadan group and modern language group, geographic group, and Ancient Fremont group1 Group
Language
Penutian Hokan Uto-Aztecan
Geographic
Subgroup
N
Chi square
P
California Penutian Zuni Yuman Washo Central Coast Hokan Northern Uto-Aztecan Central Uto-Aztecan
57 59 119 67 50 155 76 166 137 82 75 69
0.92 20.11 62.55 26.38 13.49 16.04 37.57 15.69 70.54 41.14 6.84 25.02
0.631 0.000 0.000 0.000 0.004 0.001 0.000 0.000 0.000 0.000 0.077 0.000
Great Basin Southwest Baja California Fremont
Ancient
Degrees of freedom (d.f.) are three except for California Penutian when d.f. ⫽ 2. N ⫽ number of modern (or Fremont) individuals plus number of ancient Western Nevada individuals (39).
1
TABLE 5. Cavalli-Sforza and Edwards chord-distances between ancient groups and modern language groups Ancient Western Nevada Ancient Western Nevada California Penutian Northern Uto-Aztecan Northern Hokan Central Coast Hokan Fremont Washo Zuni Yuman Central Uto-Aztecan
California Penutian
Northern Uto-Aztecan
Northern Hokan
Central Coast Hokan
Fremont
Washo
Zuni
Yuman
Central Uto-Aztecan
0.0
0.011
0.159
0.193
0.223
0.341
0.420
0.500
0.630
0.648
0.011
0.0
0.180
0.200
0.185
0.294
0.396
0.387
0.545
0.562
0.159
0.180
0.0
0.007
0.358
0.152
0.104
0.447
0.352
0.363
0.193
0.200
0.007
0.0
0.370
0.098
0.063
0.371
0.270
0.283
0.223
0.185
0.358
0.370
0.0
0.508
0.452
0.329
0.474
0.458
0.341 0.420 0.500 0.630 0.648
0.294 0.396 0.387 0.545 0.562
0.152 0.104 0.447 0.352 0.363
0.098 0.063 0.371 0.270 0.283
0.508 0.452 0.329 0.474 0.458
0.0 0.079 0.184 0.131 0.156
0.079 0.0 0.268 0.103 0.107
0.184 0.268 0.0 0.090 0.098
0.131 0.103 0.090 0.0 0.002
0.156 0.107 0.098 0.002 0.0
TABLE 6. Cavalli-Sforza and Edwards chord-distances between ancient groups and modern geographic groups
Ancient Western Nevada California Great Basin Fremont Southwest Baja
Ancient Western Nevada
California
Great Basin
Fremont
Southwest
Baja
0.0 0.088 0.178 0.354 0.605 0.622
0.088 0.0 0.148 0.270 0.330 0.383
0.178 0.148 0.0 0.124 0.337 0.303
0.354 0.270 0.124 0.0 0.134 0.087
0.605 0.330 0.337 0.134 0.0 0.015
0.622 0.383 0.303 0.087 0.015 0.0
except for haplogroup B, which was found in an 8,000-year-old individual from Colorado (Stone and Stoneking, 1996), and haplogroup X, whose presence has not been confirmed in the samples studied. While all four common Native American haplogroups (A, B, C, and D) were present in Western Nevada before 4500 yBP, the frequency of haplogroup D is unusually high compared to that of modern groups (Lorenz and Smith, 1996). Thus, a high frequency of haplogroup D, otherwise the least common of the four haplogroups, might have characterized the prehistoric population of Western Nevada until the last millennium. The haplogroup frequency distribution of the ancient Western Nevada group is statistically significantly different from those of the modern Northern Uto-Aztecan language group, the
Great Basin geographic group, and the modern Numic-speaking groups (i.e., the Northern Uto-Aztecan language group, excluding Tubatulabalic, Takic, and Hopic speakers), at least at the 0.001 level of probability. This outcome is consistent with a recent expansion of the Numic-speaking group into the Great Basin, leading to a replacement of the preNumic inhabitants. The chi-square simulation results support statistical elimination of the modern Great Basin group as a probable descendant of the ancient Nevadans. Although current evidence suggests that genetic drift has not had a large effect on mitochondrial haplogroup frequencies in recent North American prehistory (O’Rourke et al., 2000), it is possible that the differences in haplogroup frequencies between the ancient Nevadans and modern
ANCIENT NATIVE AMERICAN DNA
9
Fig. 4. Phylogenetic dendrograms of ancient and modern groups. A: Language group dendrogram generated from chord distances of Cavalli-Sforza and Edwards (1967), using the neighbor-joining method (Felsenstein, 1998). B: Geographic group dendrogram generated from chord distances of Cavalli-Sforza and Edwards (1967), using the Fitch-Margoliash method (Felsenstein, 1998).
Numic groups have been influenced by the stochastic effect of drift. These effects are mediated by a number of factors, including population size, structure, and other demographic and reproductive factors. Because a chi-square test cannot incorporate the possible effects of drift as mediated by the above factors, we are currently developing a simulation model that does, based loosely on the model by Wobst (1974, 1976) of hunter-gatherer social systems as multitiered, hexagonally organized collectives of tribes (Cabana et al., 2000). Preliminary results, using ethnographic data from modern hunter-gatherers for the relevant parameters, indicate that at the smallest tribal sizes, below approximately N ⫽ 245, the effects of genetic drift cannot be eliminated as the cause of the difference in haplogroup frequencies between the ancient Nevadans and modern Great Basin inhabitants (P ⬍ 0.05) (Cabana et al., 2000a). However, at larger tribal sizes the effects of genetic drift appear to be inadequate to cause the degree of difference observed between the haplogroup frequencies in the ancient and modern populations (P ⬍ 0.05) (Cabana et al., 2000a). Because the lowest estimates of tribal size derive from modern Australian and Arctic huntergatherers who had a significantly lower population density than is estimated for prehistoric peoples of the Great Basin (Birdsell, 1958, 1968; Wobst, 1974; Leland, 1986; Ubelaker, 1988; Crawford, 1998), it is unlikely that the ancient Nevadan tribal groups fell within this low end of the range. In the future, we will explore further the factors that would affect this
conclusion, including migration rates between populations and the number of generations of genetic drift allowed (Cabana et al., 2000b). The modern California Penutian language group and the California geographic group have haplogroup distributions that are not statistically significantly different from that of the ancient Western Nevada group. Both groups are therefore plausible descendants of the ancient Pyramid Lake (presumably non-Numic) group. Hattori (1982) and Moratto (1984) have suggested that some California Penutian speakers originated in northwestern Nevada, while ancestors of the Hokan speakers have probably inhabited California continuously for perhaps 10,000 years. Although the correlation between language and genetics is problematic, the linguistic evidence suggests it is more likely that the California Penutians, rather than the Central Coast or Northern Hokans, are the modern descendants of the ancient Pyramid Lake group. Given that the Hokanand the Penutian-speaking groups have long inhabited adjacent geographic regions (Moratto, 1984), it is possible that admixture, or even common ancestry, is responsible for the genetic similarities observed between the modern Californian Penutianand Hokan-speaking groups. Haplogroup X is absent in modern Numic speakers (Smith et al., 1999), but has been reported in both the Yakima (Forster et al., 1996; Brown et al., 1998), members of the Plateau Penutian language group who many believe to be related to the California Penutian speakers (Silverstein, 1979; Foster,
10
F.A. KAESTLE AND D.G. SMITH
1996; but see Campbell, 1997), and the Pomo, Northern Hokan speakers (Smith et al., 1999a). Because haplogroup X is the rarest of the five Native American haplogroups, it is possible that modern California Penutians also possess the marker for haplogroup X in frequencies too low to be detected in the small sample examined thus far. Additional evidence for a recent Numic expansion and a connection between the pre-Numic inhabitants of the Great Basin and the Californians would exist if the presence of haplogroup X is confirmed among the ancient Western Nevada group. While caution must be exercised when genetic distances and phylogenetic trees are generated from a single locus and those generated from multiple loci are preferable (Avise, 1994), the present study supports the connection between the ancient Western Nevadans and the Californians. However, these results suggest that the ancient Western Nevada group, while most similar to the California groups, might be more distantly related to the Northern Uto-Aztecan language group and/or the Great Basin geographic group (see Tables 5 and 6). The placement of the Northern Uto-Aztecan language group and the Great Basin geographic group near the California/Ancient Western Nevada clade in phylogenetic analyses is further support of this relationship (Fig. 4A). These data, in combination with the chisquare results, suggest an alternative hypothesis involving admixture. If the ancient Western Nevada population were early Penutian inhabitants of the western Great Basin with a haplogroup frequency distribution resembling that of modern California Penutians (high frequencies of B and D, but very low frequencies of A and C), while the haplogroup frequency distribution of the proto-Numic group expanding into the region resembled that of the modern California Uto-Aztecans (moderate frequencies of B, C, and D, and the absence of A), random admixture between the pre-Numic residents and the Numic immigrants could have produced the frequency distribution seen in the modern Numic inhabitants (high frequencies of B and D, a low frequency of C, and the absence of A). This hypothesis has received support from studies of the frequencies of an albumin variant, albumin Mexico (AlMe), in these groups (Kaestle et al., 1999; Smith et al., 2000). A final alternative is that the pre-Numic inhabitants of the Great Basin, represented by the ancient Western Nevada individuals, left no modern descendants, and any similarities in haplogroup frequencies to modern groups such as the California Penutians are due simply to chance. If that is the case, studies of other genetic markers such as nuclear microsatellite alleles should eliminate both the California Penutians and Northern Hokans as probable descendants of the ancient Western Nevada population. It is noteworthy that these prehistoric inhabitants of the western Great Basin, with a high frequency of
haplogroup D, differed significantly from the ancient Fremont people of the eastern Great Basin who themselves resemble the ancient Anasazi, south of them (Carlyle, personal communication), and modern groups in the American Southwest. These prehistoric western groups also all differed from the prehistoric groups of the midwest who themselves resembled modern Siouan living near that region (Stone and Stoneking, 1998). This continuity of regional variation over time and its correlation with population movements hypothesized from linguistics and archaeological studies suggest that genetic drift has not obscured haplogroup frequency distributions sufficiently to preclude the identification of ancestor/descendant relationships, given sufficient sample sizes. ACKNOWLEDGMENTS The authors thank the Native Americans who donated blood and hair samples and granted permission for these studies. We also thank Amy Dansie for her efforts in providing the ancient samples from Nevada and for valuable discussion of these issues, and Paul Vick for his assistance in the statistical analysis. We are grateful to Dennis O’Rourke, Robert Bettinger, Victor Golla, Joseph Lorenz, Tad Schurr, and Anne Stone for their contributions to our discussions and to Emo˝ke Szathma´ry and two anonymous reviewers for their helpful comments on this paper. This research was supported by NSF grants GER9255683 and SBR9630926 to F.A.K., and NIH grants RR00169 and RR05090 to D.G.S. LITERATURE CITED Adovasio JM, Pedler DR. 1994. A tisket, a tasket: looking at the Numic speakers through the “lens” of a basket. In: Madsen DB, Rhode D, editors. Across the West: human population movement and the expansion of the Numa. Salt Lake City: University of Utah Press. p 114 –123. Aikens CM, Witherspoon YT. 1986. Great Basin prehistory: linguistic, archaeology and environment. In: Condie KC, Fowler DD, editors. Anthropology of the Desert West: papers in honor of Jesse D. Jennnings. Salt Lake City: University of Utah Anthropological Papers no. 110. p 7–20. Avise JC. 1994. Molecular markers, natural history and evolution. New York: Chapman and Hall. Bettinger RL. 1994. How, when, and why Numic spread. In: Madsen DB, Rhode D, editors. Across the West: human population movement and the expansion of the Numa. Salt Lake City: University of Utah Press. p 44 –55. Bettinger RL, Baumhoff MA. 1982. The Numic spread: Great Basin cultures in competition. Am Antiq 47:485–503. Birdsell JB. 1958. On population structure in generalized hunting and collecting populations. Evolution 12:189 –205. Birdsell JB. 1968. Some predictions for the Pleistocene based on equilibrium systems among recent hunter-gatherers. In: Lee RB, DeVore I, editors. Man the hunter. Chicago: Aldine Publishing Co. p. 229 –240. Brooks ST, Haldeman MB, Brooks RH. 1988. Osteological analyses of the Stillwater skeletal series. U.S. Fish and Wildlife Services region 1, Cultural Resources Series 2. Portland, OR: Department of the Interior. Brown MD, Hosseini SJ, Torroni A, Bandelt H-J, Allen JC, Schurr TG, Scozzari R, Cruciani F, Wallace DC. 1998. MtDNA haplogroup X: an ancient link between Europe/Western Asia and North America? Am J Hum Genet 63:1852–1861.
ANCIENT NATIVE AMERICAN DNA Cabana G, Hunley K, Kaestle FA. 2000a. Modeling the effects of random genetic drift and migration on the genetic diversity of ancient populations. Paper presented at the 5th International Ancient DNA Conference, July 12–14, Manchester, England. Campbell LR. 1986. Comments. Curr Anthropol 27:488. Campbell LR. 1997. American Indian languages: the historical linguistics of Native America. New York: Oxford University Press. Cavalli-Sforza LL, Edwards AWF. 1967. Phylogenetic analysis models and estimation procedures. Am J Hum Genet 19:233– 257. Crapo RH, Spykerman BR. 1979. Social variation in Shoshoni phonology: an ecological interpretation. Hum Ecol 7:317–332. Crawford MH. 1998. The origins of Native Americans: evidence from anthropological genetics. Cambridge: Cambridge University Press. Dansie A. 1997. Early Holocene burials in Nevada: overview of localities, research and legal issues. Nevada Hist Soc Q 40:4 – 14. D’Azevedo W, Davis W, Fowler D, Suttles W. 1966. The current status of anthropological research in the Great Basin: 1964. Reno: Desert Research Institute Publications in Social Sciences no. 1. Delacorte MG. 1995. Desert side-notched points as a Numic population marker in the West-Central Great Basin. Paper presented at the 29th Society for California Archaeology Meetings in Eureka, OR. Driver HE. 1961. Indians of North America. Chicago: University of Chicago Press. Elston RG. 1982. Good times, hard times: prehistoric culture change in the Western Great Basin. In: Madsen DB, O’Connell JF, editors. Man and the environment in the Great Basin. Washington, DC: Society for American Archaeolology Papers no. 2. p 186 –206. Engels B. 1992. Amplify 1.2 for analyzing PCR experiments. Madison: University of Wisconsin. Felsenstein J. 1998. PHYLIP (phylogeny inference package) version 3.572c. Seattle: Department of Genetics, University of Washington. Forster P, Harding R, Torroni A, Bandelt H-J. 1996. Origin and evolution of Native American mtDNA variation: a reappraisal. Am J Genet 59:935–945. Foster MK. 1996. Language and the culture history of North America. In: Goddard I, editor. Handbook of North American Indians, volume 17: languages. Washington, DC: Smithsonian Institution. p 64 –116. Fowler C. 1972. Some ecological clues to Proto-Numic homelands. In: Fowler D, editor. Great Basin cultural ecology: a symposium. Desert Res Inst Publ Social Sci 8:105–122. Fowler D. 1977. Models of Great Basin prehistory: a symposium. Desert Res Inst Publ Social Sci 12:105–122. Goss JA. 1977 Linguistic tools for the Great Basin prehistorian. Desert Res Inst Publ Social Sci 12:48 –70. Greenberg J. 1987. Language in the Americas. Stanford: Stanford University Press. Grosscup GL. 1960. The culture history of Lovelock Cave, Nevada. Univ Cal Archaeol Surv Rep 52:1–72. Hagelberg E, Clegg JG. 1993. Genetic polymorphisms in prehistoric Pacific Islanders determined by analysis of ancient bone DNA. Proc R Soc Lond [Biol] 252:163–170. Handt O, Krings M, Ward RH, Paabo S. 1996. The retrieval of ancient human DNA sequences. Am J Hum Genet 59:368 –376. Hattori EM. 1982. The Archaeology of Falcon Hill, Winnemucca Lake, Washoe County, Nevada. Ph.D. dissertation. Pullman: Department of Anthropology, Washington State University. Hopkins NA. 1965. Great Basin prehistory and Uto-Aztecan. Am Antiq 31:48 – 60. Horai S, Kondo R, Nakagawa-Hattori Y, Hayashi S, Sonoda S, Tajima K. 1993. Peopling of the Americas, founded by four major lineages of the mitochondrial DNA. Mol Biol Evol 10:23– 47. Janetski JC. 1994. Recent transitions in Eastern Great Basin prehistory: the archaeological record. In: Madsen DB, Rhode D, editors. Across the West: human population movement and the
11
expansion of the Numa. Salt Lake City: University of Utah Press. p 157–178. Jorgensen J. 1980. Western Indians: comparative environments, languages, and cultures of 172 Western American Indian tribes. San Francisco: W.H. Freeman and Co. Kaestle FA. 1995 Mitochondrial DNA evidence for the identity of the descendants of the prehistoric Stillwater Marsh population. Anthropol Pap Am Mus Nat Hist 77:73– 80. Kaestle FA. 1997. Molecular analysis of ancient Native American DNA from Western Nevada. Nevada Hist Soc Q 40:85–96. Kaestle FA. 1998. Molecular evidence for prehistoric Native American population movement: The Numic expansion. Ph.D. dissertation, Department of Anthropology, University of California, Davis. Kaestle FA, Lorenz JG, Smith DG. 1999. Molecular genetics and the Numic expansion: a molecular investigation of the prehistoric inhabitants of Stillwater Marsh. In: Hemphill BE, Larsen CS, editors. Prehistoric lifeways in the Great Basin Wetlands: bioarchaeological reconstruction and interpretation. Salt Lake City: University of Utah Press. p 167–183. Kelly RL. 1995. Hunter-gatherer lifeways in the Carson Desert: a context for bioarchaeology. Anthropol Pap Am Mus Nat Hist 77:12–32. Kelman LM, Kelman Z. 1999. The use of ancient DNA in paleontological studies. J Vert Paleontol 19:8 –20. Lamb SM. 1958. Linguistic prehistory in the Great Basin. Int J Am Ling 24:95–100. Larsen CS. 1995. Prehistoric human biology of the Carson Desert: a bioarchaeological investigation of a hunter-gatherer lifeway. Anthropol Pap Am Mus Nat Hist 77:33– 40. Leland J. 1986. Population. In: Sturtevant, WC, D’Azevedo WL, editors. Handbook of North American Indians, volume 11: Great Basin. Washington, DC: Smithsonian Institution. p 608 – 619. Lorenz JG, Smith DG. 1994. Distribution of the 9 bp mitochondrial DNA region V deletion among North American Indians. Hum Biol 66:777–788. Lorenz JG, Smith DG. 1996. MtDNA variation among Native North Americans: geographic and ethnic distribution of the four founding mtDNA haplogroups. Am J Phys Anthropol 101: 307–323. Madsen DB, Rhode D. 1994. Across the west: Human population movement and the expansion of the Numa. Salt Lake City: University of Utah Press. Merriwether DA, Rothhammer F, Ferrell RE. 1994. Genetic variation in the New World: ancient teeth, bone, and tissue as sources of DNA. Experientia 50:592– 601. Merriwether DA, Rothhammer F, Ferrell RE. 1995. Distribution of the 4 founding lineage haplogroups in Native Americans suggests a single wave of migration for the New World. Am J Phys Anthropol 98:411– 430. Merriwether DA, Hall WW, Vahlne A, Ferrell RE. 1996. MtDNA variation indicates Mongolia may have been the source for the founding population for the New World. Am J Hum Genet 59:204 –212. Miller WR. 1986. Numic languages. In: d’Azevedo WL, editor. Handbook of North American Indians, volume 11: Great Basin. Washington, DC: Smithsonian Institution. p 98 –106. Miller WR, Tanner J, Foley L. 1971. A lexicostatistic study of Shoshoni dialects. Anthropol Ling 13:142–164. Moratto MJ. 1984. California archaeology. Orlando, FL: Academic Press, Inc. Nei M. 1972. Genetic distance between populations. Am Nat 949:283–292. Nichols M. 1981. Old California Uto-Aztecan. In: Schlicter A, Chafe WL, Hinton L, editors. Survey of California and other Indian languages, vol. 1. Berkeley: University of California Press. O’Rourke DH, Carlyle SW, Parr RL. 1996. Ancient DNA: a review of methods, progress, and perspectives. Am J Hum Biol 8:557– 571. O’Rourke DH, Hayes MG, Carlyle SW. 2000. Spatial and temporal stability of mtDNA haplogroup frequencies in native North Americans. Hum Biol 72:15–34.
12
F.A. KAESTLE AND D.G. SMITH
Parr RL, Carlyle SW, O’Rourke DH. 1996. Ancient DNA analysis of Fremont Amerindians of the Great Salt Lake Wetlands. Am J Phys Anthropol 99:507–518. Raven C. 1994. Invisible from the West: Numic expansion from the perspective of the Carson Desert. In: Madsen DB, Rhode D, editors. Across the West: human population movement and the expansion of the Numa. Salt Lake City: University of Utah Press. p 152–156 Raven C, Elston R. 1988. Preliminary investigations in Stillwater Marsh: human prehistory and geoarchaeology no. 2. Portland: U.S. Fish and Wildlife Service. Ruvolo M. 1987. Reconstructing genetic and linguistic trees: phenetic and cladistic approaches. In: Hoenigswald HM, Wiender LF, editors. Biological metaphor and cladistic classification: an interdisciplinary perspective. Philadelphia: University fo Pennsylvania Press. p 193–216. Schurr TG, Ballinger SW, Gan Y, Hodge JA, Merriwether DA, Lawrence DN, Knowler WC, Weiss KM, Wallace DC. 1990. Amerindian mitochondrial DNAs have rare Asian mutations at high frequencies, suggesting they derived from four primary maternal lineages. Am J Hum Genet 46:613– 623. Scozzari R, Cruciani F, Santolamazza P, Sellitto D, Cole DEC, Rubin LA, Labuda D, Marini E, Succa V, Vona G, Torroni A. 1997. MtDNA and Y chromosome-specific polymorphisms in modern Ojibwa: implications about the origin of their gene pool. Am J Hum Genet 60:241–244. Silverstein M. 1979. Penutian: an assessment. In: Campbell L, Mithun M, editors. The languages of Native America: historical and comparative assessment. Austin: University of Texas Press. p 650 – 691. Smith DG, Bettinger RL, Rolfs BK. 1995. Serum albumin phenotypes at Stillwater: implications for population history in the Great Basin. Anthropol Pap Am Mus Nat Hist 77:68 –72. Smith DG, Malhi RS, Lorenz JG, Kaestle FA. 1999a. Distribution of mtDNA haplogroup X among Native North Americans. Am J Phys Anthropol 110:271–284. Smith DG, Lorenz J, Rolfs BK, Bettinger RL, Green B, Eshleman J, Schultz B, Malhi R. 2000. Implications of the distribution of albumin Naskapi and albumin Mexico for New World prehistory. Am J Phys Anthropol 11:557–572.
Steward J. 1940. Native cultures of the intermountain (Great Basin) area. Smithsonian Misc Collections 100:445–502. Stone AC, Stoneking M. 1993. Ancient DNA from a pre-Columbian Amerindian population. Am J Phys Anthropol 92:463– 471. Stone AC, Stoneking M. 1996. Genetic analyses of an 8000 yearold Native American skeleton. Ancient Biomol 1:83– 88. Stone AC, Stoneking M. 1998. MtDNA analysis of a prehistoric Oneota population: implications for the peopling of the New World. Am J Hum Genet 62:1153–1170. Sutton M. 1991. Approaches to linguistic prehistory. North Am Archaeol 12:303–324. Swanson EH. 1962. Early cultures in Northwestern America. Am Antiq 28:151–158. Thomas DH. 1976. Figuring anthropology: first principles of probability and statistics. New York: Holt, Rinehart and Winston. Torroni A, Schurr TG, Yang C, Szathmary EJE, Williams RC, Schanfield MS, Troup GA, Knowler WC, Lawrence DN, Weiss KM, Wallace DC. 1992. Native American mitochondrial DNA analysis indicates that the Amerind and the Nadene populations were founded by two independent migrations. Genetics 130:153–162. Torroni A, Huoponen K, Francalacci P, Petrozzi M, Morelli L, Scozzari R, Obinu D, Savontaus ML, Wallace DC. 1996. Classification of European mtDNAs from an analysis of three European populations. Genetics 144:1835–1850. Ubelaker DH. 1988. North American Indian population size, A.D. 1500 to 1985. Am J Phys Anthropol 77:289 –294. Weiss KM, Woolford EB. 1986. Comments. Curr Anthropol 27: 491– 492. Wobst HM. 1974. Boundary conditions for Paleolithic social systems: a simulation approach. Am Antiq 39:147–178. Wobst HM. 1976. Locational relationships in Paleolithic society. In: Ward RH, Weiss KM, editors. The demographic evolution of human populations. London: Academic Press. p 49 –58. Wrischnik LA, Higuchi RG, Stoneking M, Erlich HA, Arnheim N, Wilson AC. 1987. Length mutations in human mitochondrial DNA: direct sequencing of enzymatically amplified DNA. Nucleic Acids Res 15:529 –542. Young DA, Bettinger RL. 1992. The Numic spread: a computer simulation. Am Antiq 57:85–99.