An Unbiased Distance-based Outlier Detection Approach for High-dimensional Data Hoang Vu Nguyen1 , Vivekanand Gopalkrishnan1 , and Ira Assent2 1
School of Computer Engineering, Nanyang Technological University, Singapore
[email protected],
[email protected] 2 Department of Computer Science, Aarhus University, Denmark
[email protected]
Abstract. Traditional outlier detection techniques usually fail to work efficiently on high-dimensional data due to the curse of dimensionality. This work proposes a novel method for subspace outlier detection, that specifically deals with multidimensional spaces where feature relevance is a local rather than a global property. Different from existing approaches, it is not grid-based and dimensionality unbiased. Thus, its performance is impervious to grid resolution as well as the curse of dimensionality. In addition, our approach ranks the outliers, allowing users to select the number of desired outliers, thus mitigating the issue of high false alarm rate. Extensive empirical studies on real datasets show that our approach efficiently and effectively detects outliers, even in highdimensional spaces.
1
Introduction
Popular techniques for outlier detection, especially density-based [1] and distancebased [2] ones, usually rely on the notion of distance functions defining the (dis)similarity between data points. However, since they take full-dimensional spaces into account, their performance is impacted by noisy or even irrelevant features. This issue was addressed in [3], which asserts that in such spaces, the concept of nearest neighbors becomes meaningless since nearest and farthest neighbors are alike. Even employing global dimension reduction techniques does not resolve this problem, because feature irrelevance is a local rather than a global property [3]. Therefore, in recent years, researchers have switched to subspace anomaly detection [3–5]. This paradigm shift is feasible as outliers though may be difficult to find in full-dimensional space, where they are hidden by irrelevant/noisy features, they nevertheless can be found completely in subspaces [3]. In addition, because subspaces are typically much fewer dimensions than the entire problem space, detection algorithms are able to overcome the curse of dimensionality. However, this approach opens new challenges: Unavoidable exploration of all subspaces to mine full result set: Since the monotonicity property does not hold in the case of outliers, one cannot apply apriori-like heuristic [6] (as used in mining frequent itemsets) for mining outliers. In other words, if a data point 𝑝 does not show any anomalous behavior
2
Nguyen, Gopalkrishnan, and Assent 4
4
3
3 B
A
2
2 1 1
1
0
0 0
1
2
3
4
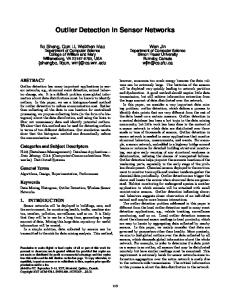
(a) A is an outlier in the full space
0
1
2
3
4
(b) B is an outlier in a subspace
Fig. 1. Non-monotonicity of subspace outliers.
in some subspace 𝑆, it may still be an outlier in some lower-dimensional projection(s) of 𝑆 (and this is also the reason why we find outliers in subspaces). On the other hand, if 𝑝 is a normal data point in all projections of 𝑆, it can still be an outlier in 𝑆. Figure 1 provides two examples on synthetic datasets illustrating our point. Though 𝐴 is not an outlier on any 1-dimensional projection of the dataset, it is an outlier in the 2-dimensional space. Conversely, 𝐵 is not an outlier in the 2-dimensional space, but it shows anomalous behavior when the dataset is mapped to the 𝑥-axis. Therefore, exploring all subspaces is unavoidable in order to find all outliers. However, algorithms that explore all subspaces are infeasible on high-dimensional data, because the number of available subspaces grows exponentially with the number of data dimensions. Difficulty in devising an outlier notion: Defining what an outlier should be in high-dimensional data is not straightforward. Popular distance-based outlier definitions (e.g., 𝑟-Distance [2], kNN [7], CumNN [8]) have been successfully used in full-dimensional space outlier detection. However, when they are applied for mining outliers in subspaces, they suffer the issue of dimensionality bias. In particular, they assign data points higher outlier scores in high-dimensional subspaces than they do in lower-dimensional ones. This leads to the loss of outliers located in low-dimensional subspaces. Moreover, it is so far unclear how these metrics should be extended to subspaces. Current notions specifically developed for mining outliers in subspaces simply consider outliers as by-products of the clustering process [9], or are arbitrary, i.e., they work with grids whose resolution cannot be easily determined [3, 5], or use cutoff thresholds without clear details on how the values may be set [4]. On the other hand, it is not easy to devise a subspace outlier notion whose parameters can be decided intuitively. Exposure to high false alarm rate: Because typical mining approaches make a binary decision on each data point (normal or outlier) in each subspace, they flag too many points as outliers as the number of possible subspaces to examine is large. This not only causes high false alarm rates, but also requires additional effort in analyzing the results. This problem can be avoided by employing a ranking-based algorithm [10], which would allow users to limit such large result sets. However, such algorithms are difficult to design, mainly because
Unbiased Distance-based Outlier Detection
3
of the lack of appropriate scoring functions. In the context of subspace mining, a score function permitting ranking must be able to produce scores that can be compared to each other across subspaces, i.e., it should be dimensionalityunbiased. Problem Statement. Our goal is to resolve the above challenges, and build an efficient technique for mining outliers in subspaces. It should: (a) avoid expensive scan of all subspaces while still yielding high detection accuracy, (b) include an outlier notion that eases the task of parameter setting, and facilitates the design of pruning heuristics to speed up the detection process, and (c) provide a ranking of outliers across subspaces. We achieve this goal by presenting Highdimensional Distance-based Outlier Detection (HighDOD), a novel technique for outlier detection in feature subspaces. Overcoming the aforementioned difficulties, HighDOD provides a distance-based approach [11, 12] towards detecting outliers in very high-dimensional datasets. Though being distance-based, the notion of outliers here is unbiased w.r.t. the dimensionality of different subspaces. Furthermore, HighDOD produces a ranking of outliers using a direct, integrated nested-loop algorithm [12], which helps to reduce the overall runtime cost. HighDOD is also not grid-based (i.e., it does not require division of data attributes into ranges) and hence, is not dependent on grid resolution. Similar to other subspace outlier detection approaches [3, 4], HighDOD explores subspaces of dimensionality up to some threshold. However, it is able to yield very high accuracy (c.f., Section 4). Our experimental results on real datasets demonstrate that it works efficiently and effectively to meet our purpose. The rest of this paper is organized as follows. We provide a formal background of the problem and review related work in the next section. Then we present the HighDOD approach in in Section 3 and empirically compare with other existing techniques in Section 4. Finally, we conclude our paper in Section 5 with directions for future work.
2
Background & Literature Review
Consider a dataset 𝐷𝑆 with 𝑁 data points in 𝑑 dimensions. Each of the dimensions is normalized such that they all have the same scale (without loss of generality, we assume the range is [0, 1]). The distance between any two data points 𝑝 = (𝑝1 , 𝑝2 , ⋅ ⋅ ⋅ , 𝑝𝑑 ) and 𝑞 = (𝑞1 , 𝑞2 , ⋅ ⋅ ⋅ , 𝑞𝑑 ) in subspace 𝑆 = {𝑠1 , 𝑠2 , ⋅ ⋅ ⋅ , 𝑠𝑑𝑖𝑚(𝑆) } ⊂ ∑ {1, 2, ⋅ ⋅ ⋅ , 𝑑} is defined as 𝐷(𝑝𝑆 , 𝑞 𝑆 ) = ( 𝑖∈𝑆 ∣𝑝𝑖 − 𝑞𝑖 ∣𝑙 )1/𝑙 where 𝑙 is a positive integer. In other words, we restrict the distance function to the 𝐿-norm class. While most of the data points are normal, some are abnormal (outlier), and our task is to mine these outliers. Work in distance-based outlier detection was pioneered by Knorr and Ng in 1998 [2]. According to their proposal, outliers are points from which there are fewer than 𝑘 other points within distance 𝑟. While this definition requires the specification of 𝑘 and 𝑟 (which is not easy) and produces only binary results (outlier or non-outlier), Ramaswamy et al. [7] proposed the first anomaly notion, called kNN, that facilitates the ranking of outliers. More specifically, instead of counting the 𝑟-neighborhood of a data point 𝑝, their technique only takes 𝑝’s
4
Nguyen, Gopalkrishnan, and Assent
distance to its 𝑘 𝑡ℎ nearest neighbor (and this is considered to be 𝑝’s outlier score) into account. Those data points with largest outlier scores will be flagged as outliers. Angiulli et al. [8] proceed further by defining 𝑝’s total distances to its 𝑘 nearest neighbors to be its outlier score. This notion also allows the design of ranking-based methods and is shown in the same article to be more intuitive than kNN. Ranking-based techniques in general have many advantages over thresholdbased ones (for more details on the classification of a detection method into either ranking-based or threshold-based, please refer to [10]). First, as pointed out in [9], binary decision on whether or not a data point is an outlier is not practical in many applications and hard to parameterize. As for ranking-based methods, the difficulty one would face in setting the cutoff threshold is lifted off. Instead, users may specify how many outliers they want to see. Subsequently, the respective technique will produce a list of anomalies sorted in ascending/descending order of outlier scores and whose cardinality is equal to the user input parameter. This is of great convenience because users can avoid analyzing excessively large amount of outputs. Moreover, they are provided with an intuition on the degree of outlier-ness of output points. Subspace mining has been studied extensively in the field of data clustering, which aims to group similar data points together. Typical clustering approaches are ineffective on high-dimensional data, because irrelevant features hide some underlying structures, and also distance functions utilizing all attributes are meaningless in such spaces [3]. Reducing data dimensionality using global dimension reduction techniques like PCA is also ineffective because feature irrelevance is a local rather than a global property, i.e., a feature may be irrelevant in one subspace but required in another subspace. This issue has been addressed by many subspace clustering methods, which efficiently explore the subspaces by employing the monotonicity property of clusters. In other words, if a cluster is present in a subspace, it is reflected in some projection of the latter, so apriori-like algorithms can be designed to avoid irrelevant subspaces. Unfortunately, as the monotonicity property does not hold in our case, designing efficient outlier detection techniques in subspaces becomes very challenging. This problem was first addressed by Aggarwal et al. in their proposal HighOut [3], which defines a data point to be an outlier if it is present in a region of abnormally low density in some lower-dimensional projection. HighOut performs a grid discretization of the data by dividing each data attribute into 𝜙 equi-depth ranges, and then employs a genetic approach to mine hypercubes (of dimensionality up to 𝑚), with the smallest densities. There are a few issues with HighOut. First, its notion of outliers is grid-based whereas the grid resolution cannot be easily determined. Second, it suffers the intrinsic problems of evolutionary approaches - its accuracy is unstable and varies depending on the selection of initial population size as well as the crossover and mutation probabilities. Finally, it may suffer high false alarm rates, since it only produces a ranking of hypercubes whose total cardinality may be high while actual the number of outliers is small. In order to improve HighOut, the authors later introduced DenSamp, a non-grid-
Unbiased Distance-based Outlier Detection
5
based subspace detection approach [4]. Though designed to work with uncertain data, it is also applicable on normal data. Similar to HighOut, DenSamp also mines outliers in subspaces of dimensionality up to 𝑚. However, it flags a data point 𝑝 as a (𝛿, 𝜂)-outlier if the 𝜂-probability of 𝑝 in some subspace is less than 𝛿. Here, the 𝜂-probability of 𝑝 is defined as the probability that 𝑝 lies in a region with data density of at least 𝜂. One major drawback of DenSamp is that the two important parameters 𝛿 and 𝜂 are not easy to set. Furthermore, 𝛿 is dimensionality biased. In particular, with increasing dimensionality, distances between points grow and densities drop [13]. Thus, in high-dimensional subspaces, the 𝜂-probability of 𝑝 tends to be less than that in lower-dimensional ones. Besides, DenSamp does not provide a ranking of outliers, i.e., the number of outputs may be very high making post-analysis difficult. Recently Ye et al. presented PODM [5], an apriori-like method for mining outliers in subspaces. Based on the idea of HighOut, PODM discretizes each dimension into ranges. It then assigns each subspace an anomaly score based on Gini-entropy, designed such that an apriori-like pruning rule can be applied. Consequently, PODM claims to explore all subspaces efficiently. PODM discards irrelevant subspaces, and then for the remaining ones, it calculates each hypercube’s outlying degree and outputs those with highest values. This approach has several limitations. First, its performance is dependent on the grid resolution which is not easy to determine. Second, and perhaps more vital, is that it discards potentially useful subspaces (by implicitly assuming monotonicity), which causes loss of knowledge. In addition, similar to HighOut, PODM only ranks hypercubes, so it cannot provide a ranking of outliers. Finally, PODM lacks intuition on how to choose the cutoff thresholds utilized in its subspace pruning process. Our experiments (c.f., Section 4), show that PODM yields unsatisfactory accuracy for subspace outlier detection. Motivated by the need of a ranking-based and dimensionality unbiased detection technique, M¨ uller et al. [9] proposed the OutRank approach for ranking outliers in high-dimensional data. In order to overcome the curse of dimensionality, OutRank first performs subspace clustering and then assigns each object an outlier score that is an aggregation of its presence in different subspace clusters. This nonetheless smooths out the density deviations that we are trying to detect. Hence, OutRank does not account for great deviations in each individual subspace. Furthermore, the aggregation nature of outlier score in OutRank fails to address the issue of local feature irrelevance that we are interested in studying in this paper.
3
Approach
In this section, we first introduce a novel dimensionality unbiased notion of subspace outliers. Based on that, we proceed to present HighDOD and then theoretically explain why HighDOD works well to meet our purpose. 3.1
Outlier Score Function
Formally, we make the following assertion for subspace outliers:
6
Nguyen, Gopalkrishnan, and Assent
Property 1. [Non-monotonicity Property] Consider a data point 𝑝 in the dataset 𝐷𝑆. Even if 𝑝 is not anomalous in subspace 𝑆 of 𝐷𝑆, it may be an outlier in some projection(s) of 𝑆. Even if 𝑝 is a normal data point in all projections of 𝑆, it may be an outlier in 𝑆. Among the available notions of distance-based outliers, the proposal by Angiulli et al. [8] is the most efficient and has been applied in many works, e.g. [12]. Denoting the set of 𝑘 nearest neighbors of a data point 𝑝 in 𝐷𝑆 as 𝑘𝑁 𝑁𝑝 , we can present their outlier score function as follows. Definition 1. [Outlier Score Function: 𝐹𝑜𝑢𝑡 [8]] The dissimilarity of a point 𝑝 with respect to its 𝑘 nearest neighbors is known by its cumulative neighborhood distance. This is defined as the total distance ∑from 𝑝 to its 𝑘 nearest neighbors in 𝐷𝑆. In other words, we have: 𝐹𝑜𝑢𝑡 (𝑝) = 𝑚∈𝑘𝑁 𝑁𝑝 𝐷(𝑝, 𝑚). This function is dimensionality biased and violates Property 1. In particular, it is easy to recognize that if 𝑆 is a subspace of 𝑇 , then we have: 𝐷(𝑝𝑆 , 𝑞 𝑆 ) ≤ 𝐷(𝑝𝑇 , 𝑞 𝑇 ). Thus, data points in higher-dimensional subspaces will have larger outlier scores than in lower-dimensional ones, i.e., if 𝑝 is not an outlier in 𝑇 , 𝑝 will not be an outlier in 𝑆 when a ranking-based technique is in play. This is obviously unanticipated. Let us denote the set of 𝑘 nearest neighbors of a data point 𝑝 ∈ 𝐷𝑆 in subspace 𝑆 as 𝑘𝑁 𝑁𝑝 (𝑆). In order to ensure Property 1 is not violated, we redefine the outlier score function as below. Definition 2. [Subspace Outlier Score Function: 𝐹 𝑆𝑜𝑢𝑡 ] The dissimilarity of a point 𝑝 with respect to its 𝑘 nearest neighbors in a subspace 𝑆 of dimensionality 𝑑𝑖𝑚(𝑆), is known by its cumulative neighborhood distance. This is defined as the total distance from 𝑝 to its 𝑘 nearest neighbors in 𝐷𝑆 (projected onto 𝑆), normalized by 𝑑𝑖𝑚(𝑆). In other words, we have: 𝐹 𝑆𝑜𝑢𝑡 (𝑝, 𝑆) =
1 [𝑑𝑖𝑚(𝑆)]1/𝑙
∑
𝐷(𝑝𝑆 , 𝑚𝑆 ),
𝑚∈𝑘𝑁 𝑁𝑝 (𝑆)
where 𝑞 𝑆 is the projection of a data point 𝑞 ∈ 𝐷𝑆 onto 𝑆. Besides assigning multiple outlier scores (one per subspace) to each data point, 𝐹 𝑆𝑜𝑢𝑡 is also dimensionality unbiased and globally comparable. We illustrate the dimensionality unbiased property of 𝐹 𝑆𝑜𝑢𝑡 by revisiting the examples in Figure 1. Let us set 𝑘 = 1 and 𝑙 = 2 (i.e., using Euclidean √ distance). In Figure 1(a), 𝐴’s outlier score in the 2-dimensional space is 1/ 2 which is the largest across all subspaces. In Figure 1(b), the outlier score of 𝐵 when projected on the subspace of the 𝑥-axis is 1, which is also the largest in all subspaces. Hence, 𝐹 𝑆𝑜𝑢𝑡 flags 𝐴 and 𝐵 (in their respective datasets) as outliers. The globally comparable property of 𝐹 𝑆𝑜𝑢𝑡 is established by the following lemmas.
Unbiased Distance-based Outlier Detection
7
Lemma 1. [Range of Distance] In each subspace 𝑆 of 𝐷𝑆, the distance between any arbitrary data points 𝑝 and 𝑞 is bounded by (𝑑𝑖𝑚(𝑆))1/𝑙 . Mathematically: 𝐷(𝑝𝑆 , 𝑞 𝑆 ) ≤ (𝑑𝑖𝑚(𝑆))1/𝑙 Proof. From the definition of distance function D, we have: 𝐷(𝑝𝑆 , 𝑞 𝑆 ) =
(∑
)1/𝑙 ∣𝑝𝑖 − 𝑞𝑖 ∣𝑙
𝑖∈𝑆
a. When 𝑙 < ∞: Since 𝑝𝑖 , 𝑞𝑖 ∈ [0, 1], it holds that ∣𝑝𝑖 − 𝑞𝑖 ∣ ≤ 1. Thus, ∣𝑝𝑖 − 𝑞𝑖 ∣𝑙 ≤ 1. As a result: ( ∑ )1/𝑙 = (𝑑𝑖𝑚(𝑆))1/𝑙 𝐷(𝑝 , 𝑞 ) ≤ 1 𝑆
𝑆
𝑖∈𝑆
b. When 𝑙 → ∞: By definition of the Minkowski distance for 𝑙 → ∞: 𝑆
𝑆
𝐷(𝑝 , 𝑞 ) = lim
𝑙→∞
(∑
)1/𝑙 ∣𝑝𝑖 − 𝑞𝑖 ∣
𝑙
= max ∣𝑝𝑖 − 𝑞𝑖 ∣ 𝑖∈𝑆
𝑖∈𝑆
Thus, 𝐷(𝑝𝑆 , 𝑞 𝑆 ) ≤ 1 (1). As lim𝑙→∞ (1/𝑙) = 0 and 1 ≤ 𝑑𝑖𝑚(𝑆) < ∞, we have lim𝑙→∞ (𝑑𝑖𝑚(𝑆))1/𝑙 = (𝑑𝑖𝑚(𝑆))lim𝑙→∞ (1/𝑙) = (𝑑𝑖𝑚(𝑆))0 = 1 (2). From (1) and (2), we conclude that as 𝑙 → ∞, 𝐷(𝑝𝑆 , 𝑞 𝑆 ) ≤ (𝑑𝑖𝑚(𝑆))1/𝑙 . ⊓ ⊔ Lemma 2. [Range of Outlier Score] For an arbitrary data point 𝑝 and any subspace 𝑆, we have 0 ≤ 𝐹 𝑆𝑜𝑢𝑡 (𝑝, 𝑆) ≤ 𝑘. Proof. By definition, we get: 𝐹 𝑆𝑜𝑢𝑡 (𝑝, 𝑆) =
1 (𝑑𝑖𝑚(𝑆))1/𝑙
∑
𝐷(𝑝𝑆 , 𝑚𝑆 )
𝑚∈𝑘𝑁 𝑁𝑝 (𝑆)
Following Lemma 1: 𝐷(𝑝𝑆 , 𝑚𝑆 ) ≤ (𝑑𝑖𝑚(𝑆))1/𝑙 . Thus, it holds that: 𝐹 𝑆𝑜𝑢𝑡 (𝑝, 𝑆) ≤
1 (𝑑𝑖𝑚(𝑆))1/𝑙
∑
(𝑑𝑖𝑚(𝑆))1/𝑙
𝑚∈𝑘𝑁 𝑁𝑝 (𝑆)
i.e., 𝐹 𝑆𝑜𝑢𝑡 (𝑝, 𝑆) ≤ 𝑘 ⊓ ⊔
8
Nguyen, Gopalkrishnan, and Assent
From Lemma 2, it can be seen outlier scores of all points across different subspaces have the same scale. Therefore, they are comparable to each other. This is of great advantage towards designing a technique for mining rankingbased subspace outliers. Having obtained a desirable score function for outliers in subspaces, now we can formally define the mining problem based upon this score function. Definition 3. [Subspace Outlier Detection Problem] Given two positive integers 𝑘 and 𝑛, mine the top 𝑛 distinct anomalies whose outlier scores (in any subspace) are largest. By using the novel 𝐹 𝑆𝑜𝑢𝑡 , we are able to reformulate the problem of detecting subspace outliers to facilitate the design of a ranking-based method. Notice that both the input parameters (𝑘 and 𝑛) can be easily decided as has been solidly founded in previous works on distance-based outliers [11, 14]. In other words, in practical applications, it is much easier to tune the dependent parameters of the solution to our problem, than it is to determine the two threshold parameters of DenSamp, or the grid resolution of HighOut and PODM. 3.2 The HighDOD Method We now present our solution towards the subspace outlier detection problem as mentioned in Definition 3. Our approach, HighDOD, is described in Algorithms 1, 2, and 3, and explained below. OutlierDetection: Property 1 highlights that in order to mine all outliers, it is unavoidable to explore all subspaces. This poses a great burden towards designing a subspace detection method. For addressing the issue, Aggarwal et al. [3, 4] suggested to examine subspaces of dimensionality up to some threshold 𝑚. Though this might cause some loss in accuracy, it is efficient in terms of runtime cost. The same article shows that the accuracy loss is not that severe as long as 𝑚 is about 𝑂(𝑙𝑜𝑔𝑁 ). Recent work by Ailon et al. [15] also mentions that a dataset’s properties can be preserved after dimensionality reduction as long as the number of features extracted is 𝑂(𝑙𝑜𝑔𝑁 ). Thus, we choose to pursue this direction in HighDOD. First we call OutlierDetection (Algorithm 1) to carry out a bottom-up exploration of all subspaces of up to a dimensionality of 𝑚, where 𝑚 is an input parameter. Therefore, 1-dimensional subspaces are examined first, then 2-dimensional ones, and so on. The top 𝑛 outliers found so far are maintained in 𝑇 𝑜𝑝𝑂𝑢𝑡. In addition, the cutoff threshold 𝑐 equal to the score of the 𝑛𝑡ℎ outlier found so far is also maintained. It plays exactly the same role as in traditional nest-loop algorithms [12]. For each investigated subspace 𝑆, we first extract some candidate anomalies by calling CandidateExtraction (Algorithm 2), and then update 𝑇 𝑜𝑝𝑂𝑢𝑡 with those candidates by invoking SubspaceMining (Algorithm 3). After exhausting all 𝑖-dimensional subspaces, we proceed to the (𝑖 + 1)-dimensional subspaces, and stop when the maximum dimensionality 𝑚 has been reached, or there are no more subspaces to explore. CandidateExtraction: This procedure is used for extracting the top 𝛽𝑛 (𝛽 ≥ 1) potential candidate outliers in any subspace 𝑆. Without it, we would
Unbiased Distance-based Outlier Detection
9
Algorithm 1: OutlierDetection Input: 𝑘: number of nearest neighbors; 𝑛: number of outliers to mine; 𝑚: maximum dimensionality; 𝑥: number of kernel centers; 𝐷𝑆: the underlying dataset Output: 𝑇 𝑜𝑝𝑂𝑢𝑡: the set of outliers 1 Set 𝑐 = 0 2 Set 𝑇 𝑜𝑝𝑂𝑢𝑡 = ∅ 3 Set 𝐶1 = the set of all 1-dimensional subspaces 4 Set 𝑖 = 1 5 while 𝐶𝑖 ∕= ∅ and 𝑖 ≤ 𝑚 do 6 foreach subspace 𝑆 ∈ 𝐶𝑖 do 7 Set 𝐶𝑎𝑛𝑑𝑂𝑢𝑡 = 𝐶𝑎𝑛𝑑𝑖𝑑𝑎𝑡𝑒𝐸𝑥𝑡𝑟𝑎𝑐𝑡𝑖𝑜𝑛(𝑛, 𝑥, 𝐷𝑆, 𝑆) 8 Call 𝑆𝑢𝑏𝑠𝑝𝑎𝑐𝑒𝑀 𝑖𝑛𝑖𝑛𝑔(𝑘, 𝑛, 𝐷𝑆, 𝑆, 𝑇 𝑜𝑝𝑂𝑢𝑡, 𝑐) 9 10
Set 𝐶𝑖+1 = the set of distinct (𝑖 + 1)-dimensional subspaces created by combining 𝐶𝑖 with 𝐶1 Set 𝑖 = 𝑖 + 1
Algorithm 2: CandidateExtraction Input: 𝑛: number of outliers to mine; 𝑥: number of kernel centers; 𝐷𝑆: the underlying dataset; 𝑆: the considered subspace Output: 𝐶𝑎𝑛𝑑𝑂𝑢𝑡: the set of candidate outliers 1 Set 𝐶𝑡𝑟𝑠 = randomly sample 𝑥 data points from 𝐷𝑆 2 Construct 𝑥 clusters 𝐶1 , 𝐶2 , ⋅ ⋅ ⋅ , 𝐶𝑥 of 𝐷𝑆 on subspace 𝑆 whose centroids are from 𝐶𝑡𝑟𝑠 3 Compute kernel bandwidths ℎ𝑖 on subspace 𝑆 4 Set 𝐶𝑎𝑛𝑑𝑂𝑢𝑡 = ∅ 5 foreach data point 𝑝 ∈ 𝐷𝑆 do 𝑥 ∑ Set 𝑓 (𝑝, 𝑆) = (1/𝑁 ) ⋅ ∣𝐶𝑗 ∣ ⋅ 𝐾(𝑝𝑆 − 𝑐𝑡𝑟(𝐶𝑗 )𝑆 ) 6 7
𝑗=1
Set 𝐶𝑎𝑛𝑑𝑂𝑢𝑡 = extract 2𝑛 points from 𝐶𝑎𝑛𝑑𝑂𝑢𝑡 ∪ {𝑝} with smallest density values
have to perform the traditional nested-loop algorithm in each individual subspaces, which is too expensive. The main idea here is to estimate the data points’ local densities by using a kernel density estimator, and choose 𝛽𝑛 data points with the lowest estimates as potential candidates. This comes from the intuition that outliers are rare events and not surrounded by many objects, i.e., their densities are expected to be very low. Note that in practice, though we only need to mine top 𝑛 outliers, we may need to extract many more candidates to account for any error caused by the density estimator, so 𝛽 > 1. Empirically, we find that 𝛽 = 2 is sufficient. In other words, we extract 2𝑛 candidate outliers in each explored subspace. Outlier detection by kernel density estimation has been studied before by Kollios et al. [16] and Aggarwal et al. [4]. Here, we follow the technique pro-
10
Nguyen, Gopalkrishnan, and Assent
posed in [4] though others like [16] are also applicable. We initially cluster the data incrementally with fixed centroids (initially chosen randomly from 𝐷𝑆) to obtain a compact representation of the underlying dataset. Then we use those centroids across all subspaces for density estimation. However, since feature relevance varies among subspaces, the one-size-fits-all clustering centroids are unsuitable for our purpose. Hence, we suggest to perform clustering in each individual subspace to account for such variance. As analyzed later in this section, the additional runtime overhead incurred is not so high as one may be concerned. We employ the Gaussian kernel function, whose 1-dimensional form is √ 2 2 expressed as 𝐾ℎ (𝑝 − 𝑐𝑡𝑟) = (1/(ℎ 2𝜋)) ⋅ 𝑒−(𝑝−𝑐𝑡𝑟) /2ℎ , where 𝑐𝑡𝑟 and ℎ are the kernel center and bandwidth, respectively. We choose the bandwidth ℎ to be 1.06 ⋅ 𝜎 ⋅ 𝑁 −1/5 , where 𝜎 is the standard deviation of 𝑁 data points [17]. The 𝑠-dimensional kernel function is the product of 𝑠 identical kernels 𝐾ℎ𝑖 (⋅), where ℎ𝑖 = 1.06 ⋅ 𝜎𝑖 ⋅ 𝑁 −1/5 with 𝜎𝑖 being the standard deviation along the 𝑖𝑡ℎ dimension. On a subspace ∑𝑥 𝑆, the density of a data point 𝑝 can be approximated as 𝑓 (𝑝, 𝑆) = (1/𝑁 ) ⋅ 𝑗=1 ∣𝐶𝑗 ∣ ⋅ 𝐾(𝑝𝑆 − 𝑐𝑡𝑟(𝐶𝑗 )𝑆 ). More details for the reasoning of the approximation method are given in [4]. SubspaceMining: This procedure is used to update the set of outliers 𝑇 𝑜𝑝𝑂𝑢𝑡 with 2𝑛 candidate outliers extracted from a subspace 𝑆. Since outlier scores across subspaces have the same scale (c.f., Lemma 2), we can maintain one global cutoff threshold 𝑐 and design a nested-loop-like algorithm for the update process. Note that in high-dimensional data, an outlier may spread its anomalous behavior in more than one subspace. Thus, if we simply replace the 𝑛𝑡ℎ outlier found so far with a new data point whose score is larger, we may end up with duplicate outliers. To prevent this from occurring, we only maintain a version of each outlier in 𝑇 𝑜𝑝𝑂𝑢𝑡. More specifically, if a data point is already in 𝑇 𝑜𝑝𝑂𝑢𝑡 before we use its newly computed score in some subspace for our updating purpose, we replace its score with the new score if it is higher, hence avoiding removal of any point maintained in 𝑇 𝑜𝑝𝑂𝑢𝑡. Otherwise, we update 𝑇 𝑜𝑝𝑂𝑢𝑡 with the new data point as in traditional nested-loop methods. The cutoff 𝑐 is adjusted along the way to ensure good pruning efficiency. 3.3
Theoretical Analysis
Analysis of Parameters Used: As suggested in [3, 15], setting the maximum dimensionality 𝑚 as logarithmic to the size of the dataset 𝑁 is sufficient, so we suggest to select 𝑚 = ⌊𝑙𝑜𝑔10 𝑁 ⌋1 . This is equivalent to dividing each dimension of the original dataset into 𝜙 = 10 ranges and choosing 𝑚 such that the dataset is not very sparse w.r.t. 𝑚. The number of 𝑚-dimensional hypercubes is 10𝑚 . To ensure that the sparsity condition is met, the average number of data points falling into each 𝑚-dimensional hypercube should be ≥ 1, i.e., 𝑁/10𝑚 ≥ 1. Solving the latter inequality, we arrive at 𝑚 = ⌊𝑙𝑜𝑔10 𝑁 ⌋. The number of kernel centers 𝑥 represents the level of data summarization. Following [4], we fix 𝑥 to 140. We set the two remaining parameters, the number 1
We here consider cases where 𝑑 is very high so that 𝑁 ≪ 10𝑑 .
Unbiased Distance-based Outlier Detection
11
Algorithm 3: SubspaceMining Input: 𝑘: number of nearest neighbors; 𝑛: number of outliers to mine; 𝐷𝑆: the underlying dataset; 𝑆: the underlying subspace; 𝐶𝑎𝑛𝑑𝑂𝑢𝑡: the set of candidate outliers; 𝑇 𝑜𝑝𝑂𝑢𝑡: the set of outliers; 𝑐: cutoff threshold 1 foreach data point 𝑝 ∈ 𝐶𝑎𝑛𝑑𝑂𝑢𝑡 do 2 foreach data point 𝑞 ∈ 𝐷𝑆 do 3 if 𝑞 ∕= 𝑝 then 4 Update 𝑝’s 𝑘 nearest neighbors in subspace 𝑆 using 𝑞 5 if ∣𝑘𝑁 𝑁𝑝 (𝑆)∣ = 𝑘 and 𝐹 𝑆𝑜𝑢𝑡 (𝑝, 𝑆) < 𝑐 then 6 Mark 𝑝 as non-outlier 7 Process next data point in 𝐶𝑎𝑛𝑑𝑂𝑢𝑡 8 9 10 11 12 13 14 15
/* 𝑝 is not marked as non-outlier, so it is used to update 𝑇 𝑜𝑝𝑂𝑢𝑡 */ if 𝑇 𝑜𝑝𝑂𝑢𝑡 contains 𝑝 then if 𝐹 𝑆𝑜𝑢𝑡 (𝑝, 𝑆) > outlier score of 𝑝 stored in 𝑇 𝑜𝑝𝑂𝑢𝑡 then Set 𝑝’s score in 𝑇 𝑜𝑝𝑂𝑢𝑡 = 𝐹 𝑆𝑜𝑢𝑡 (𝑝, 𝑆) else Set 𝑇 𝑜𝑝𝑂𝑢𝑡 = extract top 𝑛 outliers from 𝑇 𝑜𝑝𝑂𝑢𝑡 ∪ {𝑝} if 𝑀 𝑖𝑛(𝑇 𝑜𝑝𝑂𝑢𝑡) > 𝑐 then Set 𝑐 = 𝑀 𝑖𝑛(𝑇 𝑜𝑝𝑂𝑢𝑡)
of nearest neighbors 𝑘 and the number of outliers to detect 𝑛, based on many solid works on distance-based outlier mining [11, 14]. Time Complexity: For each subspace 𝑆, the cost of extracting candidates includes: (a) clustering cost, (b) bandwidth computation cost, and (c) density estimation cost. The cost of clustering is 𝑂(𝑁 ⋅ 𝑥 ⋅ 𝑑𝑖𝑚(𝑆)). To compute the bandwidths, we need to compute the data’s mean and standard deviation vectors on all dimensions of 𝑆. This incurs a cost of 𝑂(𝑁 ⋅ 𝑑𝑖𝑚(𝑆)). For each data point 𝑝 ∈ 𝐷𝑆, the cost of density estimation and maintaining the set of 2𝑛 candidates is 𝑂(𝑁 ⋅𝑥⋅𝑑𝑖𝑚(𝑆)+2⋅𝑛⋅𝑁 ), which can be reduced to 𝑂(𝑁 ⋅𝑥⋅𝑑𝑖𝑚(𝑆)) as 𝑛 ≪ 𝑥⋅𝑁 . Hence, the total cost of executing CandidateExtraction is 𝑂(𝑁 ⋅ 𝑥 ⋅ 𝑑𝑖𝑚(𝑆)). The cost of executing the SubspaceMining procedure is 𝑂(2 ⋅ 𝑛 ⋅ 𝑁 ⋅ 𝑑𝑖𝑚(𝑆)). As a result, the overall cost of exploring the subspace 𝑆 is 𝑂((𝑥 + 𝑛) ⋅ 𝑁 ⋅ 𝑑𝑖𝑚(𝑆)). Given an integer 𝑟 < 𝑑, the number of subspaces of dimensionality 𝑟 is given by 𝐶𝑑𝑟 . Since we only examine total ∑𝑚subspaces of dimensionality up to 𝑚,∑the 𝑚 runtime cost of HighDOD is: 𝑖=1 𝐶𝑑𝑖 ⋅𝑂((𝑥+𝑛)⋅𝑁 ⋅𝑖) = 𝑂((𝑥+𝑛)⋅𝑁 )⋅ 𝑖=1 𝑖⋅𝐶𝑑𝑖 . In order to understand the efficiency of our approach, let us consider a dataset with 100,000 data points (i.e., 𝑚 =∑5) and 𝑑 = 20. In this dataset, though 𝑁 is 𝑚 large, it is very sparse w.r.t. 𝑑. As 𝑖=1 𝑖 ⋅ 𝐶𝑑𝑖 = 𝑑 ⋅ 2𝑑 , the reduction ∑𝑚one obtains by using HighDOD instead of exploring all subspaces is (𝑑 ⋅ 2𝑑 )/( 𝑖=1 𝑖 ⋅ 𝐶𝑑𝑖 ) = ∑5 (20 ⋅ 220 )/( 𝑖=1 𝑖 ⋅ 𝐶5𝑖 ) > 200. In other words, HighDOD leads to a reduction of more than 200 times in execution time. Notice that the analysis above does not take into account the pruning rule used in Algorithm 3. The result is only an
12
Nguyen, Gopalkrishnan, and Assent
upper bound and our experiments (c.f., Section 4) show that the runtime cost of HighDOD is much lesser. Benefits of HighDOD: Compared to HighOut and DenSamp, HighDOD utilizes a ranking-based outlier notion which allows easier parametrization. Furthermore, our proposed definition of outliers is derived from a popular distance-based notion [8] which has already been verified to be very suitable and intuitive for practical applications. As for OutRank, in the worst case, i.e., for poor parameterization of the subspace clustering or for rather homogeneous data, it will cluster almost all subspaces and can then only start to compute any scores, i.e., its execution time will be high. HighDOD’s ranking-based algorithm is done in a nested-loop fashion, so it can avoid such costly clustering process. Different from HighOut and PODM, HighDOD is non-grid-based and hence not susceptible to the issues of grid resolution and position. The data compression in HighDOD is performed on every subspace which helps it better tune to feature local relevance than DenSamp. All of these points give HighDOD advantages over existing methods and make it be very applicable to outlier detection in high-dimensional spaces.
4
Empirical Results and Analyses
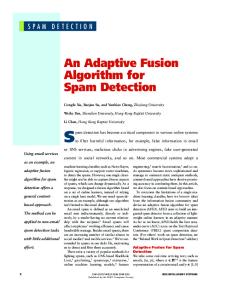
In this section, we compare the performance of HighDOD with DenSamp, HighOut, PODM, and LOF [1] (the best-known detection technique using full-dimensional space) by performing empirical studies on real datasets taken from the UCI Repository. As mentioned above, OutRank requires a clustering phase before starting the detection process. Further, OutRank is a “global” outlier detection approach that aggregates scores from different subspaces to come up with a global value, and hence, does not account for great deviations in each individual subspace. Thus, we decide not to include OutRank in our experiments. Detection Accuracy: This experiment aims to assess the effectiveness of each method in terms of detection accuracy using four real datasets whose descriptions and setup procedures are given in Table 1. It is noted that the chosen datasets’ dimensionality conforms to that of related work in the field for highdimensional data [13, 18, 3, 4]. We measure the quality of results by constructing the Precision-Recall tradeoff curve that is used widely in data classification as well as in outlier detection [3, 5]. We build this curve by varying: (a) the number of outliers to detect 𝑛 for HighDOD and LOF, (b) the number of hypercubes with lowest densities/highest outlier scores to mine for HighOut/PODM, and (c) the parameter 𝜂 for DenSamp. For HighDOD, we set 𝑘 to 0.05% ⋅ 𝑁 following established work on distance-based outliers [14]. Parameter settings for other methods follow their respective papers. The results shown in Figure 2, indicate that in all test cases HighDOD yields the best accuracy. Among the remaining subspace detectors, DenSamp produces better accuracy than HighOut, while PODM has the worst results. The superior performance of HighDOD compared to DenSamp stems from the fact that it constructs kernel centers separately for each examined subspace. This helps HighDOD to better adapt to the local change in feature relevance. Though PODM explores all subspaces, its notion of anomalies fails to capture Property 1 which causes its detection quality to
Unbiased Distance-based Outlier Detection
13
0.6 HighDOD DenSamp HighOut PODM LOF
0.4 0.2 0 0
0.2
1
HighDOD DenSamp HighOut PODM LOF
0.6
0.8
PRECISION
1 0.8
PRECISION
1 0.8
0.4 0.2
0.4
0.6
0.8
0 0
1
0.6 0.4 0.2
0.2
0.4
RECALL
0.6
0.8
HighDOD DenSamp HighOut PODM LOF
0 0
1
0.2
0.4
RECALL
(a) Ann-Thyroid 1
0.8
1
(c) WDBS
1 HighDOD DenSamp HighOut PODM LOF
0.6
0.8
PRECISION
0.8
0.4 0.2 0 0
0.6
RECALL
(b) Ann-Thyroid 2
1
PRECISION
PRECISION
Dataset Description Outlier Normal Ann-thyroid 1 21 features, 3428 instances class 1 class 3 Ann-thyroid 2 21 features, 3428 instances class 2 class 3 Breast Cancer (WSBC)2 32 features, 569 instances ‘Malignant’ class ‘Benign’ class Musk (Version 2)3 168 features, 6598 instances ‘Musk’ class ‘Non-musk’ class Arrythmia4 279 features, 452 instances class 7, 8, 9, 14, 15 class 1 Table 1. Characteristics of datasets used for measuring accuracy of techniques.
0.6 0.4 0.2
0.2
0.4
0.6
RECALL
(d) Musk
0.8
1
0 0
HighDOD DenSamp HighOut PODM LOF 0.2
0.4
0.6
0.8
1
RECALL
(e) Arrythmia
Fig. 2. Detection accuracy of HighDOD, DenSamp, HighOut, PODM, and LOF.
become unsatisfactory (the margin with HighOut is quite pronounced). While HighOut performs better than PODM, it is less accurate than the two non-gridbased methods, HighDOD and DenSamp. As for LOF, it performs relatively well when the number of dimensions is low (in Ann-Thyroid 1, Ann-Thyroid 2, and WDBS datasets). However, its accuracy deteriorates greatly with higher dimensionality where there are more noisy/irrelevant features. Scalability: We also evaluate the scalability of HighDOD with respect to the dataset’s size 𝑁 , and the dataset’s dimensionality 𝑑. Since PODM yields very unsatisfactory accuracy, we choose not to include it in this experiment. LOF is a full-dimensional detector and its accuracy on high-dimensional data (particularly those with more than 100 dimensions) is very poor. This points out that LOF is not suitable for high-dimensional outlier detection. Hence, the study of 2
3 4
We randomly extract 10 ‘Malignant’ records as outliers. We discard the record ID and label (i.e., ‘Benign’ or ‘Malignant’), and use the remaining 30 real-valued features. The test set has 166 features (the first two symbolic attributes are excluded). We consider instances in classes whose cardinality less than 10 to be outliers.
14
Nguyen, Gopalkrishnan, and Assent 2500
1500 1000 500 0 1
2
3
4
5
Dataset Size (N)
6
7 4
x 10
(a) Dataset size (CH)
2000
1000 HighDOD DenSamp HighOut
Relative Running Time
HighDOD DenSamp HighOut
2000
Relative Running Time
Relative Running Time
2500
1500 1000 500 0 5
10
15
20
25
30
35
Dimensionality (d)
(b) Dimensionality (CH)
800
HighDOD DenSamp HighOut
600 400 200 0 0
50
100
150
200
Dimensionality (d)
(c) Dimensionality (Musk)
Fig. 3. Scalability of HighDOD, DenSamp, and HighOut.
its scalability is also not of our interest. Thus, we only compare the efficiency of HighDOD against DenSamp and HighOut. Parameters settings for DenSamp and HighOut follow their respective papers. For HighDOD, 𝑛 is set to the maximum number of outliers detected by DenSamp and HighOut while 𝑘 is kept at 0.05% ⋅ 𝑁 . In this experiment, we test with the CorelHistogram (CH) dataset consisting of 68040 points in 32-dimensional space. CH contains 68040 records corresponding to 68040 photo images taken from various categories. However this dataset cannot be used to measure accuracy, because there is no clear concept of outlier among those images. Instead, it is often used for measuring the scalability of detection methods [11, 8, 12, 18]. To better illustrate the efficiency of our method against high dimensionality, we include the Musk dataset in the experiment. Since its cardinality is not large enough, we choose not to test techniques’ scalability against its size. The Arrythmia dataset though has large number of attributes is not selected due to its too small number of instances. As in [3, 4], we scale the running times obtained and present the relative running time of the three methods. Figure 3(a) shows that w.r.t. 𝑁 , HighDOD scales better than DenSamp and worse than HighOut. The genetic-based searching process of HighOut prunes much of the search space, giving it the best scalability. Even though DenSamp only identifies the kernel centers once, it suffers highest execution time because its process of calculating data points’ 𝜂-probability is costly, and moreover, it lacks pruning rules. On the contrary, the pruning rule in HighDOD’s nested-loop approach helps to offset the cost of computing kernel centers in each explored subspace. Therefore, HighDOD yields better scalability than DenSamp. Figures 3(b) and 3(c) point out that the three algorithms scale super-linear with increasing data dimensionality with the same order: HighOut produces the best performance, next is HighDOD, and finally DenSamp. In addition, HighDOD’s running time is just slightly worse than that of HighOut. From the empirical studies carried out, our proposed approach, HighDOD, obtains a better tradeoff between time and accuracy than existing methods.
5
Conclusions
This work proposes a new subspace outlier scoring scheme which is dimensionality unbiased. It extends the well-established distance-based anomaly detection to subspace analysis. Our notion of subspace outliers not only eases the parameter
Unbiased Distance-based Outlier Detection
15
setting task but also facilitates the design of ranking-based algorithms. Utilizing this score, we introduced HighDOD, a novel ranking-based technique for subspace outlier mining. In brief, HighDOD detects outliers in a nested-loop fashion allowing it to effectively prune the search space. Empirical studies carried out on real datasets demonstrate HighDOD’s efficiency as well as efficacy compared to other existing methods in the field. As future work, we are exploring possible ways to further reduce HighDOD’s running time. We are also studying how to use our novel notion of subspace outliers to effectively explore all subspaces at low cost. The availability of such a technique would help us to mine all outliers in all subspaces, and hence, to further increase the detection accuracy.
References 1. Breunig, M.M., Kriegel, H.P., Ng, R.T., Sander, J.: LOF: Identifying density-based local outliers. In: SIGMOD Conference. (2000) 93–104 2. Knorr, E.M., Ng, R.T.: Algorithms for mining distance-based outliers in large datasets. In: VLDB. (1998) 392–403 3. Aggarwal, C.C., Yu, P.S.: An effective and efficient algorithm for high-dimensional outlier detection. VLDB J. 14(2) (2005) 211–221 4. Aggarwal, C.C., Yu, P.S.: Outlier detection with uncertain data. In: SDM. (2008) 483–493 5. Ye, M., Li, X., Orlowska, M.E.: Projected outlier detection in high-dimensional mixed-attributes data set. Expert Syst. Appl. 36(3) (2009) 7104–7113 6. Agrawal, R., Srikant, R.: Fast algorithms for mining association rules in large databases. In: VLDB. (1994) 487–499 7. Ramaswamy, S., Rastogi, R., Shim, K.: Efficient algorithms for mining outliers from large data sets. In: SIGMOD Conference. (2000) 427–438 8. Angiulli, F., Pizzuti, C.: Outlier mining in large high-dimensional data sets. IEEE Trans. Knowl. Data Eng. 17(2) (2005) 203–215 9. M¨ uller, E., Assent, I., Steinhausen, U., Seidl, T.: OutRank: ranking outliers in high dimensional data. In: ICDE Workshops. (2008) 600–603 10. Nguyen, H.V., Ang, H.H., Gopalkrishnan, V.: Mining outliers with ensemble of heterogeneous detectors on random subspaces. In: DASFAA (1). (2010) 368–383 11. Angiulli, F., Fassetti, F.: DOLPHIN: An efficient algorithm for mining distancebased outliers in very large datasets. TKDD 3(1) (2009) 12. Bay, S.D., Schwabacher, M.: Mining distance-based outliers in near linear time with randomization and a simple pruning rule. In: KDD. (2003) 29–38 13. Assent, I., Krieger, R., M¨ uller, E., Seidl, T.: DUSC: Dimensionality unbiased subspace clustering. In: ICDM. (2007) 409–414 14. Tao, Y., Xiao, X., Zhou, S.: Mining distance-based outliers from large databases in any metric space. In: KDD. (2006) 394–403 15. Ailon, N., Chazelle, B.: Faster dimension reduction. Commun. CACM 53(2) (2010) 97–104 16. Kollios, G., Gunopulos, D., Koudas, N., Berchtold, S.: Efficient biased sampling for approximate clustering and outlier detection in large data sets. IEEE Trans. Knowl. Data Eng. 15(5) (2003) 1170–1187 17. Silverman, B.W.: Density Estimation for Statistics and Data Analysis. Chapman and Hall (1986) 18. Ghoting, A., Parthasarathy, S., Otey, M.E.: Fast mining of distance-based outliers in high dimensional datasets. In: SDM. (2006)