IEEE TRANSACTIONS ON INSTRUMENTATION AND MEASUREMENT, VOL. 48, NO. 5, OCTOBER 1999
995
An Improved Method for the Determination of Saturation Characteristics of Switched Reluctance Motors Virendra Kumar Sharma, S. S. Murthy, Senior Member, IEEE, and Bhim Singh
Abstract—Experimental determination of magnetization characteristics of switched reluctance motors (SRM’s) is quite important in their accurate performance prediction. Over the last decade, various experimental procedures have been used to obtain these characteristics. Every evolved new method has its own limitations and constraints. This paper describes an improved, simple and cost effective experimental procedure and an equally simple post-experimental data processing to obtain the flux–linkage–current curves at varying rotor position of the SRM. The experimental results on a 4 kW, four-phase, 8/6 pole SRM show the effectiveness of the method and the results compare well with the previously results compare well with the previously published results of similar and higher rating SRM’s. Index Terms— Flux linkage, magnetization curves, measurement and instrumentation, saturation characteristics, switched reluctance motor.
level of excitation current. This contour represents the static characteristic of the motor giving torque-rotor position useful information on the capability of its magnetic circuit to develop average torque during normal motor operation. The torque produced is a function of change in coenergy as the rotor moves from one position to another. The coenergy is a function of flux linkage, excitation current and rotor position. characteristics it Hence, for determining the static is essential to obtain the saturation characteristics of the SRM. This avoids the experimental determination of characteristics which requires expensive torque transducers and its associated signal processing. In this paper different methods of measurement reported in literature are reviewed. The new improved method is then explained highlighting its advantages with illustrations.
I. INTRODUCTION
G
ROWING interest in the switched reluctance motor (SRM) has raised many issues related to its analysis, design, performance prediction, control, measurement, and instrumentation [1]–[8]. Accurate prediction of its performance is required to study the behavior of the motor operating under different variety of steady state and transient conditions including starting, speed reversal and load perturbation. Conventional unified technique of analyzing the motor behavior cannot be applied to the SRM because of its highly nonlinear magnetic circuit comprising doubly salient pole structure. Due to this structure, the magnetic circuit excited by a pulsed dc voltage across the concentrated stator windings, does not result in sinusoidal currents and flux waveforms in time and space. The excitation current and flux waveforms are nonsinusoidal and the saturation level of magnetic circuit is quite high necessitating different set of analytical tools for performance prediction as compared to conventional ac and dc motors. In the SRM the rotor moves from one position to another by virtue of the characteristic of the magnetic circuit to attain a path of minimum reluctance for the flux on exciting the magnetic circuit by the applied m.m.f. The torque is produced due to the tendency of the rotor poles to align with the excited stator poles. The rotor poles move from an unaligned position to aligned position. In between these two extreme positions the torque contour follows a particular path depending upon the Manuscript received March 31, 1999. The authors are with the Department of Electrical Engineering, Indian Institute of Technology, New Delhi 110 016, India. Publisher Item Identifier S 0018-9456(99)06691-7.
II. METHODS
OF
MEASUREMENT
The flux-linkage of a stator winding, is a function of the excitation current and the rotor position . This relation can be represented through a family of characteristics in two forms: for different ( from unaligned to aligned position; 1) for different . 2) characteristics with -axis represents Since the area of coenergy for the given , the characteristic 1) is more relevant and widely used for performance prediction. Different methods are used to determine these characteristics for analysis of performance. The basic philosophy of all the methods have been nearly the same with variation in the technique applied. The test method described by Ferrero et al [1], [2] uses ac source of excitation (at any desired rotor position () under blocked rotor conditions. But, under actual operating conditions of the motor, the excitation source is a pulsed dc with exponentially rising current in the stator winding. This leads to a lower value of flux for a given rotor position and current as compared to dc excitation as is evident from the results [1], [2]. The other complications, associated problems and complexities with this technique of testing have been 1) use of search coil in the excited phase; 2) repetition of measurement for different peak values of excitation current for all positions of the rotor at which measurements are undertaken; 3) use of costly current probe and amplifier [6] which also contribute to measurement uncertainty;
0018–9456/99$10.00 1999 IEEE
996
IEEE TRANSACTIONS ON INSTRUMENTATION AND MEASUREMENT, VOL. 48, NO. 5, OCTOBER 1999
4) use of parabolic interpolation to reconstruct the curves and then filtering the resulting sequence of points using a digital low pass filter. Krishnan et al [3] described various methods to obtain inductance profile of a SRM, wherein flux linkage method is suggested for obtaining the inductance profile. However, this method suffers from the following discrepancies. 1) Direct method requires an elaborate hardware circuit [9] involving op-amps for addition, subtraction and integration. The measurement accuracy is affected by the temperature sensitivity, drift, noise and electromagnetic interference of the hardware circuit. Additional burden on hardware circuit is imposed by the requirement of integration time constant. The integration time constant must be selected such that the integration period is greater than the rise time of the current. 2) In the indirect method of flux-linkage measurement, the voltage across the winding does not remain constant throughout the measurement period due to the poor regulation of power supply [8]. Therefore, a large value of electrolytic capacitor is normally required across the rectified dc. This results in a series RLC circuit which generates large oscillations specially at high values of current. Additional capacitors employed to make the dc voltage stiff and ripple free increase the cost of measurement set up. Even then the ac current ripple is overriding the exponentially rising current while acquiring the winding current data. Similar ripples are observed in falling voltage transient which further compounds disturbances and distortions. Hence, the accuracy of measurement and processing of data are adversely affected. This method therefore requires tools like digital low pass finite impulse response (FIR) filter, interpolation technique etc. to obtain accurate data. Ramanarayanan et al [4] have discussed the sources of errors and their influence on flux linkage characterization of the SRM while conducting the tests. The voltage regulation of the power supply used is quite poor and the voltage drops from 60 V to 20 V as the current rises from zero to its steady state value of 20.0 A in 4 ms. Walivadekar et al [5] developed a data acquisition system characteristic by indirect (DAS) card to acquire data for hardware method. Apart from the involved hardware circuit, a major problem experienced in acquiring the data bank is the difficulty in accurate synchronization of the instant of excitation of winding with the enabling of the data acquisition card to store the useful data. In the absence of this simultaneous triggering of base drive to power module exciting the SRM winding and the DAS card enable signal, the data bank of applied voltage and resultant current at any particular measurement will have large blocks of data not required in the integration process. Further, this method requires very minute processing of huge data which is not only time consuming but needs large memory space. Lovatt et al. [7] have used a 150 V dc generator capable of supplying 25 A of current to conduct the test. Also, due to various constraints on accuracy, storage requirement and processing time they have used only 256 samples at a sampling
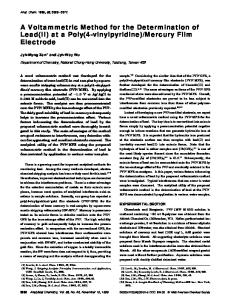
Fig. 1. Cross section of 4-phase, 8/6 pole SRM.
rate of 10 Hz in the data acquisition. This has resulted in large noise in the data acquired and various interpolation techniques were tried to remove the skew from the data as evident from the curves. Instead, a smooth surface made up of a series of bicubic splines were fitted to the data in the least-square sense. This has resulted in a very long processing time to obtain the flux linkage characteristics from the raw data. With the advancement in measurement and instrumentation techniques, the earlier procedures [1]–[8] with associated probcurves can be further simplified. This paper lems to obtain presents a simple and improved method to obtain the saturation characteristics of a SRM. Three distinct improvements of this new method over the earlier methods are identified as 1) use of less number of components, equipments and instruments in the circuit to acquire data resulting in simplified procedure; 2) use of cost effective excitation source with improved voltage regulation and overcoming the problem of large power rating [8] requirements of voltage source; 3) simplified data processing. The experimental results on a 4 kW, Oulton, TASC Drive SRM are presented and compared for accuracy with the results published earlier. III. MATHEMATICAL MODEL
OF
SRM
The doubly salient structure of a four-phase 8/6 pole SRM used in this study is shown in Fig. 1. Each stator winding can be represented by an - circuit as shown in Fig. 2 with and inductance depending on and a fixed resistance . The electrical and electro-mechanical equations governing the SR motor behavior both in transient and steady state are stated below. From Fig. 2 (1) where voltage applied across the SRM winding; current in the winding and is the flux-linkage . The doubly salient structure of the SRM and its control strategy is such that the magnetic coupling between the adjacent phases can be neglected. Hence, the flux linkage is assumed to be unaffected by the currents in other phases
SHARMA et al.: METHOD FOR THE DETERMINATION OF SATURATION CHARACTERISTICS
Fig. 2. Basic machine circuit of SRM.
and it is a function of current in the excited phase and the rotor position which determines the reluctance offered by the magnetic path as the rotor moves from one position to another. The equations governing the dynamic behavior of the SRM are (2) (3) (4) where rotor position; rotor speed; moment of inertia of the rotor of the motor including all the rotating parts; load torque; electromagnetic torque developed by the motor. For a nonlinear electromechanical system such as SRM, the electromagnetic torque is calculated by the space derivative of the coenergy at the given position [9] (5) at any rotor position The coenergy the saturation curves by
is obtained from
(6) The solution of the governing (2)–(6) requires the knowlfor any and . Hence, the experimental deteredge of curves is the crucial step in any mination of accurate analytical prediction of performance of the motor. A simple indirect method of determining the flux-linkage as defined in the mathematical model is described below. IV. IMPROVED TECHNIQUE OF FLUX-LINKAGE MEASUREMENT Use of magnetic flux sensors is not only expensive but also requires their installation in motor assembly. Integration of the e.m.f. induced in the search coil mounted in the excited phase is equally cumbersome. Hence, the indirect method of obtaining the flux-linkage is used to obtain the saturation curves of the SRM. The flux-linkage can be obtained by rearranging (1) such that (7)
997
Hence, in order to determine the flux-linkage it is required to sense only two electrical quantities: 1) the voltage appearing across the SRM winding; 2) the current flowing through the winding starting from zero until it reaches a steady state value higher than full load current, typically 120% of full load current. The problems caused by voltage source regulation and current ripples due to RLC oscillations are completely eliminated by using a pure dc source to excite the winding during the test. For this purpose a set of 12 V, 40 AH lead acid battery is used. Depending upon the resistance of the SRM winding and the peak current required during the test, two or more batteries are used in series. The use of lead acid battery is also cost effective as compared to the high cost of large rating electrolytic capacitors required to filter the rectified dc. Due to very low source resistance of the batteries, their voltage regulation is better compared to rectified dc with capacitor filters. There are no RLC oscillations observed in the current which is ripple free. This eliminates the problems of using digital FIR low pass filters, interpolation techniques, removal of skew from measured data etc. Since the battery voltage is 12/24/36 V it is directly interfaced with CRO thereby eliminating the use of potential transformer or voltage sensor or a voltage attenuator [2] for measurement of voltage across the SRM winding. The use of battery ensures supply isolation for digital storage oscilloscope. The only sensor required now is the current sensor. For this, a Hall effect current sensor capable of measuring currents up to on 100 A is used to record the exponentially rising current a DSO. Earlier, specially designed power phase-leg modules [6] have been used for exciting the SRM winding during measurements for flux-linkage data. The purpose of power phase-leg module consisting of a power semi-conductor switch such as IGBT or MOSFET and its associated firing and logic circuit is only to energize the SRM winding momentarily so that the current reaches the steady state value of approximately 20% more than the rated current. This is conveniently replaced by a simple mechanical push-button switch which is turned on for a fraction of second till the stator winding attains the steady state value of desired peak current. However, a freewheeling diode across the stator winding is essential to dissipate the stored energy on sudden removal of excitation source. The problem of synchronization of energizing the SRM winding and the enabling the data acquisition is eliminated by pre-triggering the data acquisition system at any instant ahead of the actual instant of turning on the voltage source, where is 25% of the total period of sampling till steady state condition is reached. Thus, the post-experimental data processing requires eliminating the initial 25% of data acquired during the waveform capture. The schematic diagram of the experimental setup to obtain the instantaneous voltage and current transients for flux-linkage determination is shown in Fig. 3. Ammeter and voltmeter used in the circuit help in scaling of the acquired data. At any rotor position the two channels of a DSO are used to capture the falling voltage across the SRM winding
998
IEEE TRANSACTIONS ON INSTRUMENTATION AND MEASUREMENT, VOL. 48, NO. 5, OCTOBER 1999
Fig. 3. Experimental setup to obtain saturation curves of SRM.
Fig. 5. Scaled voltage and current waveforms. Fig. 4. Sensed voltage and current of SRM winding on DSO.
and rising current . The captured transients are downloaded to PC through RS232C connector and the equivalent integer values of voltage and current transient are available for postexperimental data processing. In one recording of voltage and current waveform, sufficient number of data points are available for intermediate values of current thereby avoiding the repetition of experiment for different values of current at a given position. This considerably reduces the efforts involved in experimentation without affecting the accuracy of the results. The recordings are taken only for different rotor positions from unaligned to aligned position with rotor angular resolution of 2.0 degree mechanical. For a 8/6 pole SRM, the rotor pole pitch is 30 and hence the test is conducted only for fifteen discrete rotor positions. For a 4 kW SRM under test, two 12 V batteries connected in series are used to excite the SRM winding having a dc resistance of 0.72 . This combination gives a peak current of approximately 28.0 A under blocked rotor test condition. The sensed voltage and current transient at a particular rotor position is shown in Fig. 4. V. DATA PROCESSING
AND
TEST RESULTS
With one voltage and one current recording at one rotor position, there are total thirty data files to handle the fifteen rotor positions at which flux-linkage characteristic is desired. Each data file consists of more than 1000 samples out of which initial 25% data is discarded, as explained above. Remaining
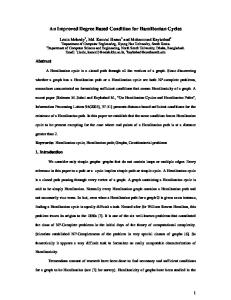
75% data comprising approximately 765 data samples are then appropriately scaled and the resulting voltage and current pattern are shown in Fig. 5. The voltage drops from 24.0 V to 22.0 V as the current rises from zero to 28.0 A. This information is then used to perform the integration of to obtain the value of flux-linkage. The removal of initial 25% data removes the vertical offset observed by [6] in characteristic. A simple software for off-line data processing is developed to read the raw data of voltage and current, scale it to actual values and then perform the integration of numerically, being the sampling instant. Simultaneously, the coenergy is also determined using (5). This data processing is repeated for all the fifteen rotor position recordings. No data interpolation, curve fitting or data filtering is required in constructing the saturation curves from the raw data. The saturation curves of SRM, thus, obtained are shown in Fig. 6. The minimum flux-linkage in unaligned position is 410 mWb-turns (mV/s) and the maximum fluxlinkage in aligned position is 912 mWb-turns. The curves obtained closely match with the flux-linkage characteristics of 4 kW SR motor published in [1], [2], and [4], but by a considerably simplified procedure as reported here. These saturation curves are crowded near the aligned and unaligned position and uniformly distributed otherwise as expected from the theory of the SRM. Table I shows the comparison between some of the values of flux-linkage characteristics of Fig.6 with those of [4, Fig. 5]. The comparison of these discrete
SHARMA et al.: METHOD FOR THE DETERMINATION OF SATURATION CHARACTERISTICS
COMPARISON OF FLUX-LINKAGE VALUES OF SRM
Fig. 6. Flux-linkage (
999
TABLE I FOR DIFFERENT WINDING CURRENTS AND ROTOR POSITIONS
0 i) characteristics of SRM for different �.
values of flux-linkage, as evident from Table I, shows that the difference in measurement by this simplified procedure is not more than 5% which is fairly accurate determination of saturation characteristics of SRM. characteristics at 15 discrete The available data bank of rotor positions spanning 30 of angular movement of rotor from aligned to unaligned is used to obtain the flux-linkage-
Fig. 7. Flux-linkage (
0 �) characteristics of SRM for different I .
rotor displacement characteristic [2], [10] for different values of winding current. Since sufficient number of samples of intermediate values of winding currents are available in a curve for different rotor positions , single recording of characteristics are tabulated from data bank, the without repeating the measurements for intermediate values of excitation current. This characteristic is shown in Fig. 7 and is
1000
IEEE TRANSACTIONS ON INSTRUMENTATION AND MEASUREMENT, VOL. 48, NO. 5, OCTOBER 1999
used in nonlinear theory of the SRM for rapid computer aided design [10]. Hence, by this simplified and improved procedure and characteristics of a SRM are obtained the simultaneously from single set of experimental recording. VI. CONCLUSIONS The test results of the proposed method, carried out on a 4 kW, 4 phase, 8/6 pole Oulton, TASC, SRM illustrate the accurate determination of saturation curves from the measured values of terminal quantities of voltage and current. The improved method is quite effective in the determination of saturation characteristics of the SRM. It eliminates most of the electrical/electronics problems associated in the measurement and instrumentation procedures reported earlier. The excitation source and power circuit requirements are simplified with overall reduction in cost of measurement setup. The problems of hardware circuit, RLC oscillations, noise, poor voltage regulation and high power rating of source, repetition of measurements, effect of improper integration constants are eliminated. The experimental procedure is therefore shown to be considerably simplified with reduced efforts of experimentation and data processing. The system is user friendly for any researcher to emulate. The data processing is simple and straight forward without any digital filtering, interpolation techniques or curve fitting requirements. Fairly accurate results are obtained as compared to the previously published results. The simplicity of the overall procedure outlined is quite attractive and is effectively used for accurate experimental determination of flux-linkage characteristics of the SRM. REFERENCES [1] A. Ferrero and A. Raciti, “A digital method for the determination of magnetic characteristics of variable reluctance motors,” IEEE Trans. Instrum. Meas., vol. 39, pp. 604–608, Aug. 1990. [2] A. Ferrero, A. Raciti and C. Urzi, “An indirect test method for the characterization of variable reluctance motors,” IEEE Trans. Instrum. Meas., vol. 42, pp. 1020–1025, Aug. 1993. [3] R. Krishnan and P. Materu, “Measurement and instrumentation of a switched reluctance motor,” in Proc. IEEE IAS Annu. Meeting, 1989, pp. 116–121. [4] V. Ramanarayanan, L. Venkatesha and D. Panda, “Flux linkage characteristics of switched reluctance motors,” in Proc. IEEE Conf. PEDES’96, New Delhi, India, Jan. 1996, pp. 281–285. [5] V. Ramanarayanan, L. Venkatesha and D. Panda, “Flux linkage characteristics of switched reluctance motors,” in Proc. IEEE Conf. PEDES’96, New Delhi, India, Jan. 1996, pp. 281–285. [6] C. Cossar and T.J.E. Miller, “Electromagnetic testing of switched reluctance motor,” in Proc. ICEM’92, Sept. 1992, vol. 2, pp. 470–474. [7] H.C. Lovatt and J.M. Stephenson, “Measurement of magnetic characteristics of switched reluctance motors,” in Proc. ICEM’92, Sept. 1992, vol. 2, pp. 465–469. [8] W.F. Ray and F. Erfan, “A new method of flux or inductance measurement for switched reluctance motors,” in Proc. IEE Conf. Power Electronics Variable Speed Drives, Oct. 1994, pp. 137–140. [9] J. M. Stephenson and J. Corda, “Computation of torque and current in doubly salient reluctance motors from nonlinear magnetization data,” Proc. Inst. Elect. Eng., vol. 126, pp. 393–396, May 1979. [10] T.J.E. Miller and McGilp, “Non-linear theory of the switched reluctance motor for rapid computer-aided design,” Proc. Inst. Elect. Eng., vol. 137, pp. 337–347, Nov. 1990.
Virendra Kumar Sharma was born in Agra, India, in 1961. He received the B.E. degree from Karnataka Regional Engineering College, Surathkal, India, and the M.Tech. degree from the Indian Institute of Technology (IIT), Delhi, in 1984 and 1993, respectively. During his B.E. and M.Tech. program he served as Electrical Supervisor with a Class A government approved contractor, Lecturer at College of Engineering, Pravaranagar, and Jamia Millia Islamia, New Delhi. From 1994 to 1998, he was registered as a sponsored candidate for pursuing research work at IIT. Currently he is serving as a Reader in Jamia Millia Islamia. He has a few research papers to his credit in the field of analysis, design, and control of electrical machines. Mr. Sharma is a member of the Institution of Engineers (India) and Institution of Electronics and Telecommunication Engineers (India).
S. S. Murthy (SM’87) was born in Karnataka, India, in 1946. He received the B.E. and M.Tech. degrees in 1969 from Indian Institute of Technology (IIT), Bombay, and the Ph.D. degree in 1974 from IIT, Delhi. He has been with IIT since 1970 and is presently the Chairman of the Department of Electrical Engineering. He has published more than 150 research papers in refereed journals and conferences. He has guided more than 40 B.Tech., M.Tech., and Ph.D., theses and dissertations. He holds patents on the self excited induction generator and a novel braking scheme. He has also transferred technology on self excited and grid connected induction generators to industry for low- and medium-power generation and standalone or grid connected mode using energy sources such as wind, wave, small hydro, bio mass, and fossil fuels. He has completed several industry sponsored research and consultancy projects dealing with electrical machines, drives, and energy systems. Recently, he was instrumental in establishing state-of-the-art energy audit and energy conservation facilities at IIT under World Bank funding. His areas of interest include electric machines, drives, special machines, power electronic applications, renewable energy systems, energy efficiency and conservation. Dr. Murthy was the recipient of the President of India prize for 1976 for Best Paper published in the Journal of Institution of Engineers. He has made significant contributions to professional societies, including being General Chair of the 1st IEEE International Conference on Power Electronics, Drive, and Energy Systems for Industrial Growth (PEDES’96) for Asia Pacific region during January 1996 in New Delhi. He is a Life Fellow of the Institution of Engineers, India, and Life Member of ISTE.
Bhim Singh was born in Rahamapur, India, in 1956. He received the B.E. degree from the University of Roorkee, India, and the M.Tech. and Ph.D. degrees from the Indian Institute of Technology (IIT), New Delhi, in 1977, 1979, and 1983 respectively. In 1983, he became a Lecturer and then Reader with the Department of Electrical Engineering, University of Roorkee. In 1990, he joined IIT, where he is now a Professor in the Department of Electrical Engineering. He has over 200 research papers to his credit in the field of power electronics, CAD and analysis of electrical machines, active power filters, self-excited induction generators, industrial electronics, static VAR compensation, analysis and digital control of electric drives. Dr. Singh is a fellow of the Institution of Engineers, India and the Institution of Electronics and Telecommunication Engineers and life member of the Indian Society for Technical Education, System Society of India, and National Institute of Quality and Reliability.