An Experimental Study on Non-Linear Vibration Analysis of Thin Elastic Plates M. K. Nayak and R. K. Mitra, P. G. Students, G. Pohit and K. N. Saha, Faculty members Department Of Mechanical Engineering, Jadavpur University, Kolkata-700032. ABSTRACT Many engineering structures need stronger design and higher service life associated with saving in weight. These requirements are fulfilled by thin walled structures, which undergo large deformations under transverse load. Large deformation load-displacement relationships are nonlinear and they are not readily amenable to theoretical analysis. Further, theoretical analysis for non-linear dynamic behaviour of the plate is more critical. The experimental verifications of large deflection behaviour of thin plates are scarce, especially in the case of its dynamic behaviour. This has prompted the present work in which the effect of geometric non-linearity on the natural frequencies of a square clamped plate under uniformly distributed and concentrated loads at the center is obtained. The theoretical results of the linear analysis are found to be in good agreement with the starting points of the experimental backbone curve. INTRODUCTION Engineering structures such as containers, ships, aeroplanes etc. are basically made from plate like structures. Such structures need stronger design and higher service life associated with saving in weight. Due to these requirements, thin plates are preferred for design consideration. These thin walled structures may undergo large deformations when subjected to external loading. Large deflection analysis of plates provides solution to such weight conscious design. At large deflection level, membrane stresses are produced which give additional stiffness to the structure. The resulting load-displacement relationship becomes non-linear in this case. Also the principle of superposition does not hold in this case and this is not readily amenable to theoretical analysis. In linear analysis of plate, the load applied is proportional to the deflection produced, which corresponds to small deflection analysis in actual practice. But it is observed experimentally that the behaviour of plate deflection under higher load is a nonlinear one. Also beyond a certain limit the deflection increase at a rate lower than the rate of increase of load especially for a metallic structure. This leads to a non-linear behaviour of the plate, similar to that of the characteristics of a hard spring. Looking back into the earlier work done on rectangular plates, one can find that a host of research work has been carried towards analytical and numerical solution of the problem. Sathyamoorthy (1987) has reviewed the recent developments in the non-linear vibration analysis of plates. It is observed that experimental study is relatively scarce. Singhal et al. (1992) have done the experimental verification of analytical solution for free vibration of rectangular plates with classical edge conditions. However, their study is focused for the case of linear vibration only. Kadiri and
Benamar (1999) carried out experiment on nonlinear free vibration of fully clamped rectangular plates for various plate aspect ratios. Jensen et al. (2000) conducted experiment to determine the stiffening effects of high frequency excitation and for an axially loaded beam. Kumar (1999) has made an experimental study on large deflection behaviour of plates under uniform transverse loading with clamped edges which is limited to static analysis only. Raju (2000) has also made a theoretical and experimental study on free vibration analysis of square clamped plate subjected to transverse loading with clamped edges. In a recent study Saha et al. (2001) presented theoretical backbone curves in dimensionless deflection-amplitude vs. frequency plane. The literature survey reveals that large deflection behaviour of thin plates has not been amply verified experimentally, especially in the case of its dynamic behaviour. This has necessitated to undertake the present work. The objective of this experimental study is determining the effect of geometric non-linearity on the natural frequencies of a square clamped plate under uniformly distributed and concentrated loads at the center. The static load-deflection relationship of the plate under the loading conditions has been obtained as well. EXPERIMENTAL SET-UP AND PROCEDURE An experimental set-up is developed for determining the vibration frequencies of a square clamped plate. Forced vibration analysis is carried out under uniformly distributed load and free vibration study is done for concentrated loads. Here, the free vibration refers to the vibration of a concentrated loaded plate. In both cases, the experiment is carried out on same specimen. Figure 1 (a, b and c) shows the experimental set-up as a schematic arrangement drawing, where set-ups for free and forced vibration study and a circuit diagram for instrumentation are shown separately. The specimen under study is clamped in a rectangular frame made up of ISMC 75 channels. The bottom surface of the frame is closed by a 3.15 mm thick M.S plate. Thus a closed chamber is formed with a provision for applying compressed air in it. The clamped boundary condition for the test plate is obtained by bolting it in-between the channel frame and an ISFB 40 x 6 mating flange with gasket. M10 bolts at approximately 35 mm pitch are used as the clamping bolts. In case of free vibration study, the concentrated load is applied in the form of dead weights on the specimen through a steel rod arrangement at the plate center (Fig. 1a). Concentrated load is applied from top, keeping the chamber open to atmosphere. The steel rod contains a weight pan, fixed at suitable position through a collate mechanism, to support the dead weights. Free vibration frequencies are observed by striking the loaded plate at specified positions. Subsequently, the load is increased by adding known quantity of weight on the weight pan and the above operation is repeated. The experiments for forced vibration conditions are carried out with the same plate under uniformly distributed load, as shown in Fig. 1b. The uniform loading condition is achieved by supplying pressurised air in to the channel enclosure. A compressor of 45-liter tank capacity at a maximum
2
pressure of 100 psi is used for the purpose. The pressure is regulated by isolation and control valves. Once the enclosure pressure exceeds the desired value, supply is cut off by the isolation valve and the desired pressure is obtained by fine turning the control valve. Pressure is measured by a U-tube mercury manometer. For each pressure setting, forced vibration is imparted by an exciter at the bottom of the plate. The specimen is vibrated through the vibration of the enclosed air in the channel enclosure. Now the frequency of vibration of the exciter is increased till resonance occurs. At this point the excitation frequency and natural frequency is noted down. Now the pressure is increased and same procedure is followed. The details of the instruments used in the experiments are shown in Fig. 1c along with the circuit diagram. The diagram is shown for forced vibration study. The free vibration experiment is identical with the only exception that the exciter section is not required. However, a separate circuit diagram is not shown for brevity. The accelerometer, used for the purpose of forced vibration study is of type 8728A500 miniature K-shear accelerometer, Kistler make whereas in free vibration study accelerometer is of type 4391, Bruel and Kjaer make. They are placed on the top of the plate at some prescribed positions through wax and magnetic base, respectively. Natural frequencies are obtained by placing the accelerometer at different positions (0.25,0.25), (0.25,0.5), (0.5,0.5) of the plate. The co-ordinates of these positions are in non-dimensional representation of the axes (ξ=x/a, η=y/b). In free vibration study, initial disturbance is imparted by hitting it with a rubber hammer. It is to be noted that the striking positions are not arbitrary; rather the same prescribed positions for the accelerometer are used. The accelerometer output signal is fed to the oscilloscope (Type TDS 210,Tekronix make) through an intermediate charge amplifier. The oscilloscope shows these signals in the form of FFT graphs and the corresponding natural frequencies of vibration of the plate are measured from the FFT graphs. In case of forced vibration analysis, the excitation comes from a sweep function generator (APLAB-make, model FG2M) as shown in Fig. 1c. The signal is fed to the exciter (SYSCON-make, Model SI 230) through a power amplifier. This excitation signal is also fed to the oscilloscope. The RS232 output port of the oscilloscope is connected with a computer (PIII, 500 MHz, HP make) and the FFT plots of the oscilloscope have been captured by using ‘wavestar’ software. These FFT plots are saved in graphics and data files through this Software. Large deflection static analysis is carried for concentrated load only. The arrangement for this experimental set-up is same to that of the dynamic one. In this static analysis, the deflection is measured through dial gauge (range 25 mm, accuracy 0.01 mm) corresponding to the same loads at which the dynamic experiments are carried out. Here a movable suspension bridge, made from slotted angles, is also used for fixing the dial gauge. The load at the center is increased by adding known quantity of weight on the weight pan, as in the case of dynamic study. For each increased load, the deflection produced in the plate is measured by the dial gauge.
3
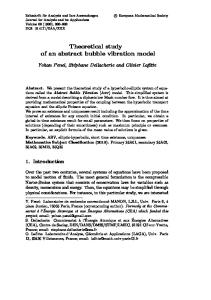
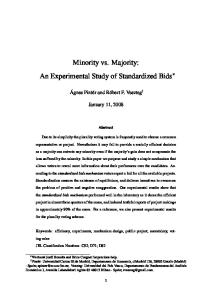
RESULTS & DISCUSSIONS The experiment is carried out to determine the effect of geometric non-linearity on vibration frequency of a square clamped plate. Both free and forced vibration study is carried out. In addition an effort is made to capture the load–displacement characteristics of the clamped plate subjected to a concentrated load at the center. The specimen for the experiment is a 400 x 400 mm square commercial mild steel plate with thickness 0.73 mm. The concentrated load applied ranges from 0 to 50 N while the range of uniform pressure is 0-120 mm of Hg. In this experimental work, attention is focused on the first three natural frequencies. Theoretical values of these frequencies are estimated (Saha et al., 2001) and are used as the basis to control the settings of the instruments. It is observed that the accelerometer positions and strike positions have significant effect on the modes of vibration to be excited during an experiment. Accordingly, adequate care has been taken to account them. Experimentally natural frequencies of the loaded plate are obtained from the FFT graphs of the oscilloscope. It is observed that with change in load natural frequencies of the system is changing. The FFT plots, corresponding to a particular load, have been captured in the computer by using ‘wavestar’ software. Samples of these FFT diagrams are shown in Fig. 2 for both types of loadings. As the accelerometer and striking positions depend on the type of loading, they are also mentioned in each figure. These plots, corresponding to different load steps, are saved in data files through ‘wavestar’ software as a two-dimensional array representing amplitude and frequency. A programme in FORTRAN is developed to combine these data files into one, thus producing a three-dimensional array, the third column of the array representing the load. The changes in natural frequencies with loads have been observed from the FFT diagrams. But it could be more meaningfully visualised through a three dimensional plot as waterfall diagram. This waterfall diagram is produced through the application software MATLAB by using the data file obtained from the output of the FORTRAN programme. Figures 3a and 3b represent the waterfall diagrams of the clamped plate under two types of loading; one corresponding to the results of the free vibration study and the other one to that of the forced vibration study. They are obtained in the form of 3D plots by combining different FFT plots obtained through experiment. The contour plots (Fig. 4) obtained from these waterfall diagrams are equivalent to the backbone curves of the theoretical analysis. In contour plots y-axes represents the number of data files, each of which again corresponds to a particular load. Experimental backbone curve (deflection-amplitude vs. frequency plot) may be obtained from the contour plots if the load deflection behaviour of the plate is known a priory. Using the procedure described earlier, deflection vs. load characteristics of the plate is determined experimentally for the case of concentrated loading. The result of the experiment is shown in table 1. Subsequently, experimental backbone curve is obtained by associating the appropriate experimental data (deflection) with the corresponding number of the data file. This experimental backbone curve, thus developed, is shown in Fig. 5(i) in concentrated
4
load vs. frequency plane as experimental backbone curve. The relevant portion of the figure is traced and shown once again in Fig. 5(ii) for clarity. In this diagram, the theoretical results of the linear analysis (Saha et al., 2001) are also marked for the first three vibration modes, which are found to be in good agreement with the starting points of the experimental backbone curves CONCLUSION In the present work an experimental study is carried out to investigate the large deflection dynamic behaviour of a thin clamped plate under concentrated and uniform load. It is found that the set-up developed in the study is quite suitable for the purpose. As a part of the present work, the static behaviour of the plate is also obtained. The static analysis provides the load-deflection relationship necessary to establish the experimental backbone curve. It is observed that the specimen has a pronounced membrane effect. The results of this experimental work may be used by other researchers to validate theoretical results. Further experimental results would help to establish the validation on a stronger foot. It is felt that the actual clamped boundary condition could be ascertained more accurately by welding all sides of the plate specimen with the mating flange. ACKNOWLEDGEMENT The experimental part of the work has been carried out under the financial support of AICTE, Ref: R&D project, File No. 8019/RDII/R&D/COM(167)/2000-01 dated 20.12.2000. REFERENCES 1. Sathyamoorthy, M., 1987, ”Non linear vibration analysis of plates”, Applied Mechanics Review, Vol. 40, pp. 1533-1561. 2. Singhal, R.K., Gorman, D.J. and Forgues, S.A., 1992, ”The comprehensive analytical solution for vibration of rectangular plates with classical edge conditions: Experimental verification”, Experimental Mechanics, Vol.32, pp. 21-23. 3. Kadiri, M.El, Benamar, R., 1999, ”Non linear free vibration of fully clamped rectangular plates for various plate aspect ratios”, Journal of Sound and Vibration, Vol. 228, pp. 333-358. 4. Jensen, J.S., Tcherniak, D.M. and Thosen, J.J., 2000, ”Stiffening effects of high frequency excitation “, ASME, Journal of Applied Mechanics, Vol.67, pp. 397-401. 5. Kumar, A.P., 1999, ”Large deflection behaviour of plates under uniform transverse loading with clamped edges”. P.G. Thesis, Jadavpur University, India. 6. Raju, M.V.S., 2000, ”Free vibration analysis of square clamped plate subjected to transverse loading with clamped edges”. P.G. Thesis, Jadavpur University, India. 7. Saha, K.N., Misra, D., Pohit, G. and Ghosal, S., 2001, “Large amplitude free vibration study of square plates under different boundary conditions through a static analysis”, Paper communicated to Computers & Structures.
5
(i) Load =10 N, strike pos=(0.75,0.25), Acc. Pos=(0.25,0.25), ω3=117 Hz
(i). Uniform pressure=100 mm Hg. ωexcitation=135HZ.
(ii) Load= 0 N, strike pos=(0.25,0.5), Acc. Pos=(0.5,0.25), ω2=78 Hz
(ii) Uniform pressure =120 mm Hg ωexcitation=135HZ.
(a) Free vibration under Concentrated load
(b) Forced vibration under uniform load
Fig. 2 Sample FFT plots obtained from oscilloscope.
(a) Free vibration under Concentrated load
(b) Forced vibration under uniform load
Fig. 3 Waterfall diagrams
6
(i) Forced vibration under uniform load
(ii) Free vibration under concentrated load
Fig. 4 Contour plots of waterfall diagram.
4000
T heoretical values
C oncentrated load in N
5000
3000
2000
1000
0
50
100
N atural frequencies in H z.
(i) Contour plot in frequency-load plane
(ii) Backbone curves from previous figure
Fig. 5 Experimental backbone curve for concentrated loading
Table 1: Experimental results for large deflection static behaviour of the specimen Run no. 1 2 3 4 5 6 7 8
Load in N 6.4 8.4 11.4 13.4 15.4 16.4 18.4 21.4
Deflection (mm) 0.35 0.36 0.43 0.45 0.95 0.97 1.51 2.01
Run no. 9 10 11 12 13 14 15 16
7
Load in N 23.4 26.4 28.4 31.4 36.4 41.4 46.4 51.4
Deflection (mm) 2.60 3.50 3.90 3.90 4.80 6.10 6.40 7.30
150