An Experimental and Numerical Study of a Laminar Triple Flame TOBIAS PLESSING,* PETER TERHOEVEN, and NORBERT PETERS Institut fu ¨r Technische Mechanik, RWTH-Aachen, D-52056 Aachen, Germany
MOHY S. MANSOUR
Department of Mechanical Power Engineering, University of Cairo, Egypt A lifted laminar axisymmetric diffusion flame is stabilized in the downstream region of a diluted methane jet that is surrounded by a lean methane-air co-flow and an outer co-flow of air. The flame shows a distinct triple flame structure in the stabilization region. It is investigated experimentally by PIV for the velocity field, OH-LIPF imaging, C2Hx -LIF imaging, and a 1D-Raman technique for major species concentrations, combined with a Rayleigh technique for temperature. This is complemented by numerical simulations solving the two-dimensional axisymmetric Navier-Stokes equations in the zero Mach number limit on an adapted mesh, coupled with balance equations for temperature and species. A simplified model for molecular transport properties was used with constant, but non-unity, Lewis numbers for all species. Chemistry is represented by a ten-step reduced mechanism for methane oxidation, which was derived starting from a 61-step elementary mechanism that includes the C1 and C2 chains. The agreement between the measured and the predicted flow field is very satisfactory. Owing to gas expansion, the velocity decreases immediately ahead of the flame and increases strongly at the flame front. Further downstream acceleration due to buoyancy is dominant and is predicted accurately. There is a good agreement between measurements and computations for flame shape and flame length. The measured OH-LIPF image and the computed OH concentrations indicate that OH is concentrated in the vicinity of stoichiometric mixture. The results from a newly developed C2Hx -LIF method are also supported by calculations. While these measurements were only qualitative, the temperature and mole fractions of the major species could be measured quantitatively with the combined Raman-/Rayleigh technique along a line and were found to agree well with the numerical predictions. It is found that the structure is a triple flame and is influenced essentially by two external parameters: heat exchange between the branches and heat loss at the curved flame front near the triple point. © 1998 by The Combustion Institute
INTRODUCTION In many technically important applications combustion occurs under partially premixed conditions. In a partially premixed mixture field a flame propagates preferentially along surfaces of stoichiometric mixture. At the leading edge of this propagating flame a two-dimensional structure is observed that consists of a diffusion flame embedded within a fuel-lean and a fuelrich premixed flame. Such flames have first been described by Phillips [1]. They have later been called in theoretical studies tribrachial [2] or triple flames [3–5]. The region where the three reaction zones meet is located at the leading edge of the flame is called the triple point. It has been found theoretically that flame propagation of triple flames depends on several parameters. Buckmaster and Matalon [2] studied Lewis number effects, Dold [3] and Hartley and Dold *Corresponding author. COMBUSTION AND FLAME 115:335–353 (1998) © 1998 by The Combustion Institute Published by Elsevier Science Inc.
[4] studied the effect of mixture fraction gradients in the region of the triple point, Kioni et al. [5] studied the effect of self induced strain, and Ruetsch et al. [6] studied the effect of heat release. In direct numerical calculations Domingo and Vervisch [7] found triple flames during the autoignition of turbulent nonpremixed mixtures. In a recent study, Echekki and Chen [8] used detailed chemistry to calculate the structure and propagation of methanol-air triple flames. Several experimental configurations of laminar triple flames are reported in the literature [5–9]. Kioni et al. [5] used a rectangular burner to stabilize a triple flame in a mixing layer. Their burner is able to generate variable mixture fraction gradients ahead of the flame. Extensive studies on the flame propagation of laminar lifted diffusion flames from round nozzles have been reported by Chung and Lee [9]. Triple flames are of fundamental interest for the understanding of the stabilization mechanisms in lifted diffusion flames. Different 0010-2180/98/$19.00 PII S0010-2180(98)00013-3
336
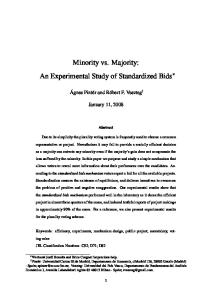
T. PLESSING ET AL. burner with a central diluted fuel jet and a surrounding fuel lean co-flow is chosen to generate a lifted laminar diffusion flame, which is shown in Fig. 1. The inner luminous zone corresponds to the rich premixed flame, the outer thin zone to the lean premixed flame, while the broad luminous zone in-between these premixed flames is the trailing diffusion flame. A complete numerical and experimental analysis of this laminar triple flame gives a detailed insight into the triple flame structure and shows how useful modern experimental and numerical tools can be for a thorough investigation.
EXPERIMENTAL TOOLS Burner Design and Flame
Fig. 1. (a) Photograph of laminar triple flame and (b) schematic diagram of triple flame burner.
concepts about lift-off mechanisms and blowout criteria are reviewed in [10 –13]. Both flamelet quenching and turbulent flame propagation are important in the stabilization region. This has been verified by calculations of lifted turbulent diffusion flames of Mu ¨ller et al. [14]. In the present study an axisymmetric co-flow
A photograph of the triple flame and a schematic diagram of the burner are shown in Fig. 1. The burner consists of a central nozzle with a diameter of 2 mm surrounded by a tube with a diameter of 20 mm and a potential nozzle with an exit diameter of 150 mm. Three streams flow through the nozzle, the tube, and the potential nozzle. The first stream through the nozzle is a diluted methane jet with nitrogen, while the second stream through the outer tube is lean methane-air mixture. This configuration has been experimentally selected in order to provide a stable flame with an inner rich premixed reaction zone, an outer lean premixed reaction zone, and a diffusion flame in-between as shown in Fig. 1a. Thus, the flame is called a “triple flame.” The outer potential nozzle provides a uniform air co-flow as the third stream. This protects the flame from external disturbances and provides well-established boundary conditions. The exit velocities and mass fractions of the three streams are given in Table 1. The
TABLE 1 Mean Inlet Velocities and Compositions for the 3-Feed Burner
Mean inlet velocity u# [m/s] Mass fraction Y CH4 Mixed with
Diluted fuel stream
Lean methane-air co-flow stream
Outer air coflow stream
1.178 0.679 N2
0.650 0.0149 Air
0.634 0 Air
LAMINAR TRIPLE FLAME
Fig. 2. Measured and calculated radial profiles of axial velocity 4 mm above burner exit.
outer air co-flow has nearly the same velocity as the lean methane-air co-flow. Inside the tube of the lean methane-air co-flow a bundle of small tubes of 2 mm diameter, was introduced 300 mm upstream the nozzle exit. Figure 2 shows the velocity profile 4 mm above the burner exit for the investigated triple flame. This profile shows the velocity distribution of the central nozzle, the annular co-flow, and the nearly uniform velocity resulting from the potential nozzle. The Reynolds numbers, Re 5 u 0 d/ n , based on the mean exit velocities and the outer diameters for the diluted fuel stream and the lean co-flow are 44 and 369, respectively. These flow fields are thus laminar. The outer air co-flow is also laminar due to the design of the nozzle that provides a potential flow with a uniform exit velocity profile. This has been tested experimentally. The Froude number, Fr 5 u 20 /gd, based on the mean velocity and the outer diameter of the lean co-flow is 2.1. This indicates that buoyancy has a significant effect on the flow field. Flow Visualization and PIV Techniques For the visualization of the flow field a particle tracking (PT) technique was used. The velocity field was measured using particle image velocimetry (PIV) technique. The flow was seeded for both techniques with monosphere SiO2-particles. Very small particles with a diameter of 800 nm were chosen in order to allow the particles
337 to follow the relatively small flow velocities. An Argon Ion Laser (Coherent Innova 300) was used in multiline mode for PT and a double pulsed Nd:YAG-laser (Quanta Ray GCR-4) second harmonic (532 nm) for PIV-measurements. The pulse width of the Nd:YAG is 8 ns and the pulse-to-pulse period of the double pulse mode was set to 100 ms, enough to resolve the expected velocities. A conventional reflex camera was used for imaging the mie scattered light perpendicular to the laser sheet. The arrangement is shown in Fig. 3. The data were evaluated with an autocorrelation algorithm developed by Breuer [15]. OH-LIPF and C2Hx-LIF A schematic diagram of the arrangement for the Laser Induced Predissociation Fluorescence, LIPF, of OH and Laser Induced Fluorescence, LIF, of C2Hx techniques is shown together with that for a combined UV line Raman-Rayleigh technique in Fig. 4. For OH-LIPF and C2Hx LIF only camera 1 was used. The OH-radical and C2Hx -molecules are excited with a tunable pulsed KrF-excimer laser (Lambda Physics EMG 150 TMSC). The laser wavelength can be tuned between 247.9 nm and 248.9 nm with a linewidth of ;0.0001 nm. The beam shape is rectangular, 22 mm 3 4 mm. One cylindrical lens (f 5 300 mm) has been used to form a laser sheet with a mean thickness of ;0.25 mm and 22 mm height. For OH-LIPF the P 2 (8)- line was chosen to excite from the A 2 s 4 (X) 2 P state, as reported in [16, 17]. A UG11-glass filter has been used to separate the OH-LIPF signal. However, the OH-LIPF images are corrected for broadband emissions by subtracting an image collected with the laser off the excitation line. The results are only qualitative. The excitation of C2Hx -molecules was performed at 248.415 nm to suppress possible interferences resulting from OH-LIPF. For C2Hx -Molecules, a WG385-longpass filter was used to select part of the broadband emissions reaching from the deep UV up to the visible range. The C2Hx -LIF is a mixture of laser induced fluorescence from the molecules themselves and fluorescence resulting from intermediates induced by photodissociation [18]. It shows a thin structure for stoichiometric flames, which becomes wider
338
T. PLESSING ET AL.
Fig. 3. Apparatus for flow visualization with particle tracking (PT) and velocity measurements with particle image velocimetry (PIV).
with increase in equivalence ratio. The camera 1 system consists of an 18 mm diameter DEP image intensifier with 30 lp/mm, a tandem lens coupling, and a 384 3 576 pixel Photometrics Star 1, 12 bit CCD camera. A UV-lens system is used to image an area of 20 3 13 mm2. The exposure time was 400 ns in order to suppress natural flame luminescence.
Combined UV Line Raman-Rayleigh Technique UV Raman spectroscopy along a line has been applied successfully for measurements in hydrogen flames [19, 20]. The feasibility of this technique in methane flames was recently reported [21] and is refined in these measurements. The
Fig. 4. Apparatus for Laser induced predissociative fluorescence of OH radical (OH-LIPF), Laser induced fluorescence of C2Hx molecules (C2Hx LIF), and combined Raman-/Rayleigh Technique.
LAMINAR TRIPLE FLAME technique allows iterative calculation of the major species concentration of CO2, O2, N2, CH4, H2O, and H2 from the Raman signal and the temperature from the Rayleigh signal. A schematic diagram of the apparatus is also shown in Fig. 4. In this experiment the excimer laser beam is focused to a line of approximately 300 mm diameter. Camera 1 collects the Rayleigh signal which was separated by an interference filter. Two plano convex fused silica lenses are used together with an astigmatism-corrected spectrometer (Chromex 500, f 5 6.9) and a second ICCD camera system, identical to camera 1, for the collection of the Raman lines. In front of the spectrograph a longpass mirror is positioned at an angle of 45° to reflect the signal at the excitation wavelength 248 nm in order to minimize the background noise. The entrance slit is opened 0.7 mm to cover the beam height and any possible beam steering. The Raman image is 21.5 nm in the wavelength direction and 8 mm in the radial direction. Each Raman image is reduced in wavelength direction to 11 windows for seven species and four correction lines of interfering fluorescences. It is further blocked in the radial direction in order to enhance the signal-to-noise ratio. The final spectral and spatial resolutions of these measurements are 0.223 nm and 0.26 mm, respectively. The exposure time of the image intensified cameras is set to 400 ns. An iterative algorithm is used to calculate the temperature from the Rayleigh images and the major species concentrations from the Raman images. The Rayleigh temperature is calculated as follows [22]: T 5 C Rays m/I Ray, where I Ray is the Rayleigh signal normalized by the laser energy I l, and C Ray is the Rayleigh calibration factor that includes parameters such as solid angle of optics and their collection efficiency. The Rayleigh cross sectional value is sm and is equal to ¥X i s i where X i is the mole fraction of species i and s i is its Rayleigh cross section. C Ray is obtained from the average of multiple ambient air images. The vibrational Raman signal I Ram is related to its number density [N i ] by [21]:
339
I Ram 5
I l@N i# . C i~T!
Here C i (T) is a temperature-dependent calibration factor based on Raman cross-sections that includes the solid angle of optics and collection efficiency, as well as spectral broadening of the lines. Interferences caused by OH- and O2Fluorescence, temperature-dependent spectral broadening of adjacent vibrational Raman lines and interferences caused by rotational Raman lines at higher temperatures needed to be corrected. We used a correction algorithm proposed by Dibble et al. [23]: I9Ram 5 I Ram 3 A I 3 A f, where I9Ram denotes the measured vibrational Raman intensity and I Ram the corrected Raman intensity. A I is an array with temperature-dependent interference factors derived from extensive calibration measurements in pure gases in a temperature range from 300 K up to 1200 K, which were extrapolated up to 2200 K. A f corrects interferences caused by O2 and OHfluorescence, which were calibrated in flames at different stoichiometries. Broadband emissions from higher hydrocarbons in the rich environment could not be corrected. By comparing the measured total number density with theoretical calculations from the perfect gas law and allowing a maximum total relative error of 15%, the regions of broadband emissions could be identified. A determination of CO concentration with reasonable accuracy was not possible due to the strong spectral overlap of 60% with the N2 Raman line. Typical error limits in mole fractions are DX 5 3.5% for CO2, DX 5 3.0% for O2, DX 5 4% for N2, DX 5 1% for CH4, and DX 5 2.5% for O2. The error in temperature is less than 3%. Images were collected every mm along the vertical direction in a single shot mode. Twenty images were averaged at each position. A detailed further description of the technique is given in [24]. The mixture fraction, Z, is calculated as follows:
340
T. PLESSING ET AL.
Z5 $~2Y C/W c! 1 ~.5Y H/W H! 1 @~Y O,O 2 Y O!/W O]} [(2YC,F/W C 1 ~.5Y H,F/W H! 1 ~Y O,O/W O! where Y C is the mass fraction of the total carbon atoms, Y H is the mass fraction of the total hydrogen atoms, and Y O is the mass fraction of the total oxygen atoms. Y C,F and Y H,F are the mass fractions for the carbon and hydrogen atoms in pure CH4, and Y O,O 5 0.233 is that for the oxygen atom in the oxidant, which is pure air. The stoichiometric mixture fraction of the nitrogen diluted jet is 0.0789.
¹ z ~rvv! 5 ¹ z
1¹
(1)
where u denotes the axial and v the radial velocity component. The stream function was computed from a Poisson type equation
D
1 ¹C 5 v . rr
(2)
u v 2 . r x
(4)
I m 5 22
S
~¹u z ¹ 'm ! 1 ~¹v z ¹ 'm ! x r
SD
D
v z ¹ 'm , r
¹5
(5)
x 2/r , and ¹ 5 S S / /r D / x D '
(3)
The axisymmetrical vorticity transport equation for non-constant density reads
(6)
have been used. The transport equations for temperature and species mass fractions are written as
S
D
Po cv l ¹ z ~ r vrT! 5 ¹ z ¹~Tr! 2 ¹ z ~vr! r r r
O c rD ¹T z ¹Y 2 Oum ˙ 1Oq 1
v,i
i
i
i
i
i
i
and
R,i
(7)
i
S
D
1 rDi ¹ z ~ r vrY i! 5 ¹ z ¹~rY i! 1 m ˙ i. r r
(8)
Here P o denotes the thermodynamic pressure, l the heat conductivity, Di the mass diffusivity, and m ˙ i the chemical production rate of species i. The radiant heat loss term ¥i qR,i is computed using a thin gas emission approximation where only CO2 and H2O emission are considered
Oq
R,i
F SD SD G
5 22 s Sr 5T 5 a P,CO2
i
The vorticity v is defined as
v5
u2 1 v2 z ¹ 'r 2 g z ¹ 'r 2
where the definitions
To investigate the structure of the laminar triple flame the solution of two two-dimensional axisymmetric Navier-Stokes equations for the flow field and balance equations for temperature and chemical species concentrations are required. The temperature and species equations contain chemical source terms which are strongly dependent on temperature and concentrations and need to be solved accurately. The numerical results presented in this study were obtained using a modified version of a computer program for the two-dimensional direct numerical simulation of laminar diffusion flames [25]. The code solves the full NavierStokes equations in the zero Mach number limit in a stream function/vorticity formulation. The stream function C is defined as
S
S
where g denotes the vector of gravity and m the kinematic viscosity. I m comprises the additional viscous terms
1¹
Governing Equations
¹z
D D
1 ¹~ mv r! r
1 I m,
NUMERICAL SIMULATION
C C 5 r ur, 5 2r vr, r x
S
1 a P,H2O
Y M
Y M
.
CO2
(9)
H 2O
Here s S 5 5.671 3 10 28 W/(m2 K4) is the Stefan-Boltzmann-constant and aP,CO2 and
LAMINAR TRIPLE FLAME
341 TABLE 2
Lewis Numbers for the Species Used in the Numerical Computation O2
H
OH
H2
H2O
O
CO
CO2
CH3
CH4
C2H2
C2H4
C2H6
N2
NO
0.98
0.17
0.65
0.3
0.84
0.64
0.95
1.25
0.88
0.95
1.1
1.0
1.1
1.0
1.0
aP,H2O are Planck’s radiation coefficients empirically determined as [14] aP,CO2 5 46.241 exp ~28.888 3 1024 T!, a P,H2O 5 22.6 exp ~21.546 3 10
23
T!.
(10)
w I 5 2w 34 1 ~w 38,f 2 w 38,b! 1 w 39 1 ~w 40,f 2 w 40,b!, w II 5 ~w 33,f 2 w 33,b! 2 w 53 1 2w 56 1 2w 61,
(11)
w III 5 ~w 18,f 2 w 18,b! 1 w 19 1 w 27 1 2w 28
In this computation simplified transport models have been employed for the kinematic viscosity m, the heat conductivity l, and the species mass diffusivities D i . Following [26], the heat conductivity for fuel-air mixtures is computed from
2 ~w 33,f 2 w 33,b! 2 ~w 43,f 2 w 43,b!
S D F G
l T 5 2.58 3 10 24 cp 298K
0.7
kg . ms
m 5 0.76 l /c p
w IV 5 ~w 1,f 2 w 1,b! 1 w 6 1 w 9 2 ~w 12,f 2 w 12,b! 1 w 13 2 w 17 1 w 19
(12)
The mixture heat capacity is computed from the species heat capacities c p,i , which are in evaluated using NASA polynomials [27]. A constant Prandtl number approximation Pr 5
2 w 45,
(13)
is used to evaluate the viscosity from the heat conductivity. The species diffusivities are evaluated using a constant but non-unity Lewis numbers for each species. The Lewis numbers used for this computation are shown in Table 2. Reduced Mechanism For the description of the chemical processes involved in the oxidation of methane a ten-step mechanism with 13 stable species is used (see Table 3). It is based on a starting mechanism derived from the first 61 reactions of the mechanism given in [28]. The stable species are O2, H, OH, H2, H2O, O, CO, CO2, CH3, CH4, C2H2, C2H4, and C2H6. Steady-state assumption is used for the species HO2, H2O2, CH, CHO, CH2, CH2O, CHCO, C2H3, and C2H5. The global rates for the reduced mechanism are
1 w 27 1 w 28 2 w 45 2 w 46 2 w 53 1 w 56 1 w 61, w V 5 ~w 2,f 2 w 2,b! 2 ~w 4,f 2 w 4,b! 1 w 6 1 w 10 2 ~w 12,f 2 w 12,b! 1 w 13 1 w 17 1 w 27 1 w 28 1 w 30 1 w 39 2 ~w 43,f 2 w 43,b! 1 w 46 1 w 56 1 w 61, w VI 5 ~w 3,f 2 w 3,b! 1 ~w 4,f 2 w 4,b! 1 w 5 2 w 6 2 w 7 2 w 10 1 2~w 12,f 2 w 12,b! 2 w 13 1 w 16 1 w 22 2 w 29 2 w 30 1 ~w 40,f 2 w 40,b! 1 w 50 1 ~w 54,f 2 w 54,b! 1 w 61, w VII 5 w 5 1 ~w 12,f 2 w 12,b! 1 w 15 1 w 16 1 w 17 1 w21 1 w22 1 w34 1 w49 1 w50 2 w56 , w VIII 5 2w 36 1 w 61, wIX 5 w53 1 ~w54,f 2 w54,b ! 1 w55 2 w56 2 w61 , w X 5 w 45 1 w 46 1 w 53 2 w 56 2 w 61. The concentrations for the steady-state species are computed from the following relations:
342
T. PLESSING ET AL.
C H 2O 2 5
~k 12,fC OHC OHM! , ~k 12,bM 1 k 13C H 1 k 14C OH!
C CH2O 5 C C 2H 3 5 C C 2H 5 5 C HO2 5
~k 35C CH3C O 1 k 37C CH3C O2! ~k 29C H 1 k 30C O 1 k 31C OH!
,
~k 51,bC C2H2C H 1 k 52,fC C2H4C H 1 k 54,fC C2H4C OH! ~k 49C H 1 k 50C O2 1 k 51,f 1 k 52,bC H2 1 k 54,bC H2O)
,
~k 56C CH3C CH3 1 k 58,bC C2H4C H 1 k 59C C2H6C H 1 k 61 C C2H6C OH! ~k 58,f ! ~k 5C O2C HM 1 k 14C H2O2C OH 1 k 50C C2H3C O2! ~k 6C H 1 k 7C H 1 k 8C OH 1 k 9C H 1 k 10C O!
,
.
The algebraic equation for the species concentrations of CHCO, CHO, CH2, and CH form a linear system
C CH2 5
bf 1 g , 1 2 af 2 eh
C CHCO 5 aC CH2 1 b,
C CH 5
bfh 1 gh , 1 2 af 2 eh
C CHO 5 cC CH 1 d, C CH2 5 eC CH 1 fC CHCO 1 g,
with a5
C CH 5 hC CH2,
k 43,bC CO , ~k 43,fC H 1 k 44C O!
which has the solution ag 1 b~1 2 eh! C CHCO 5 , 1 2 af 2 eh bcfh 1 cgh C CHO 5 d 1 , 1 2 af 2 eh d5
e5 f5 g5
h5
b5
c5
k 46C C2H2C O ~k 43,fC H 1 k 44C O!
~k 19C O2 1 k 20C CO2! ~k 21C H 1 k 22C OH 1 k 24, f M!
~k 24,bC COC HM 1 ~k 29C H 1 k 30C O 1 k 31C OH!C CH2O! ~k 21C H 1 k 22C OH 1 k 24,fM! k 25,bC H2 ~k 25,fC H 1 k 27C O2 1 k 28C O2 1 k 33,bC H2 1 k 43,bC CO!
,
k 43,fC H , ~k 25,fC H 1 k 27C O2 1 k 28C O2 1 k 33,bC H2 1 k 43,bC CO! ~k 33,fC CH3C H 1 k 45C C2H2C O! ~k 25,fC H 1 k 27C O2 1 k 28C O2 1 k 33,bC H2 1 k 43,bC CO! k 25,fC H ~k 19C O2 1 k 20C CO2 1 k 25,bC H2).
,
,
,
,
LAMINAR TRIPLE FLAME TABLE 3 Ten-Step Reduced Mechanism for CH4 Oxidation I: II: III: IV: V: VI: VII: VIII: IX: X: NI:
CH4 1 H 5 H2 1 CH3 CH3 1 OH 5 2H2 1 CO CO 1 OH 5 CO2 1 H O2 1 H 5 OH 1 O H2 1 O 5 H 1 OH H2 1 OH 5 H2O 1 H 2H 1 M 5 H2 1 M C2H6 5 2CH3 C2H4 5 H2 1 C2H2 C2H2 1 O2 5 H2 1 2CO. N2 1 O2 5 2NO.
The performance of this mechanism was evaluated by computing a library of unstretched premixed flames using the fuel-air-equivalence ratio as a parameter. Figure 5 shows that the prediction of the burning velocity from the ten-step reduced mechanism matches almost exactly the results obtained with the starting mechanism for lean mixtures and is satisfactory for rich mixtures. The agreement with experimental data in [29] is very good. Also plotted in Fig. 5 is a sevenstep mechanism that has previously been used for diffusion flames, which yields higher burning velocities for very rich flames as compared with the ten-step mechanism. When this seven-step mechanism was used, the experimentally observed flame shape could not be reproduced. In particular, the shape of the rich premixed flame showed a much smaller penetration of unburnt gas into the flame body
Fig. 5. Burning velocity vs fuel-air equivalence ratio for reduced ten-step and reduced seven-step mechanism and comparison with starting mechanism and experimental data.
343 close to the centerline of the jet. This was due to the higher predicted burning velocities for rich mixtures. On the other hand the ten-step mechanism provided accurate burning velocities, in agreement with the experiment. Numerical Method A pseudo-time iteration was employed to compute the steady-state solution. An operator splitting approach for the convective/diffusive terms and the chemical source terms allowed separate space and time integration. The spatial derivatives in the transport equations were discretized in space using implicit second order finite differences. The resulting large linear system was solved using an iterative conjugate gradient based method for sparse systems. The chemical source terms were integrated using adaptive time integration with error control [30]. Boundary Conditions The temperature in the inlet section was set to Tu 5 300 K. Species concentrations were computed from the mixture compositions given in Table 1. For the fuel flow and the lean co-flow velocity profiles, corresponding to a laminar, fully developed tube flow and an annular flow, respectively, were assumed, the outer co-flow velocity profile was computed from the mean flow rate to match the experimental data. At the line of symmetry the radial velocity was set to zero, and a zero gradient was assumed for the axial velocity, temperature, and species concentrations. At the outlet section a zero curvature condition for the stream function, 2C/ x2 5 o, was used. For temperature and species concentrations a zero gradient condition was employed. The location of the open boundary in the outer co-flow was chosen far away from the flame at a radius of 35 mm, where no bending of the streamlines due to thermal expansion was observed experimentally. The open boundary was implemented as a slip line, zero radial velocity and a zero gradient condition for the axial velocity, the temperature and the species concentrations.
344
Fig. 6. Extinction characteristics of triple flame burner for diluted fuel flow (Y CH4 5 0.665) at different velocities of (3) 1.06 m/s, (e) 1.24 m/s, (E) 1.42 m/s, and (F) 1.6 m/s. Solid lines represent extinction start limit of flame, dashed lines represent attached end limit. Lifted triple flames exist between these limits.
RESULTS Extinction and Flame Characteristics The burner was tested at various velocities of the fuel flow and various air/fuel mixtures in the lean methane-air co-flow. Figure 6 shows the extinction characteristics of the triple flame burner. Above the solid lines, at the different diluted fuel flow velocities, a lifted diffusion flame is blown off, while below the dashed lines the flame is attached to the burner and becomes a stable diffusion flame. The lifted triple flame exists between the solid and dashed lines. At some fuel velocities it was possible to stabilize either a lifted diffusion flame with a triple flame structure or a burner attached flame. These two possibilities for stabilization of diffusion flames in laminar mixing layers have been discussed in detail by Lin ˜´an [31]. To obtain the lifted flame condition the flames were ignited in the free flow above the wake of the nozzle. The mixture fraction gradient at the leading edge of the triple flame could be decreased by either enlarging the fuel mass fraction in the co-flow or increasing the fuel flow velocity. It can be seen in Fig. 6 that triple flames stabilize at higher co-flow velocities with increasing mass fractions of methane in the co-flow. Converseley triple flames stabilize at lower co-flow velocities with increasing fuel flow velocities. It could be ob-
T. PLESSING ET AL.
Fig. 7. Lift-off height of triple flames with variations of co-flow and fuel velocity at which other flow has been kept constant.
served from natural luminescence that by increasing mixture fraction gradients the premixed wings of the triple flame become shorter and that the flame develops into a lifted diffusion flame. These results agree well with the theoretical analysis of Ruetsch et al. [6] and measurements of Kioni [5], who found this dependence between the mixture fraction gradient and the local flame speed. For a lifted diffusion flame with a distinct triple flame structure a certain mixing length is necessary to develop a mixture fraction gradient ahead of the flame that is low enough to form the premixed branches. In Fig. 7 two types of velocity variations and their influence on the lift-off height are shown. For the variation of the co-flow velocity the fuel flow velocity has been kept constant and for the variation of the fuel flow the co-flow velocity has been kept constant at the conditions defined in Table 1. The influence of the fuel flow velocity on the lift-off height is much smaller than is the co-flow velocity, since the fuel flow velocity influences the mixing between oxidizer and fuel, whereas the co-flow velocity determines the entire velocity field surrounding the flame. Increasing the fuel flow velocity results in larger mixture fraction gradients at the leading edge of the triple flame and hence in higher lift-off heights, where the local flow velocity is lower. For the analysis of the diffusion flame length, which is the characteristic length for a lifted triple flame, the fuel mass fraction in the co-flow
LAMINAR TRIPLE FLAME
345
Fig. 8. Diffusion flame length of lifted triple flames and lift-off height as a function of fuel mass-fraction in the co-flow Y CH4.
has been varied. Figure 8 shows that the length of the diffusion flame increases linearly with the mass fraction of methane in the co-flow YCH4, whereas the lift-off height decreases linearly. With increasing mass fraction the mixture fraction gradient ahead of the triple flame will decrease and triple flames stabilize at lower lift-off heights, at which the flow velocities are higher. For the detailed study, which is described subsequently, a flame was chosen with a distinct triple flame structure at the leading edge and a low lift-off height to allow a high spatial accuracy in the simulation. The flow parameters for this flame are given in Table 1. A comparison between experimental and numerical profiles of the velocity and mixture fraction at the stabili-
Fig. 10. Calculated and visualized streamlines.
zation height h 5 38 mm of this flame is shown in Fig. 9. The stoichiometric mixture fraction Z st 5 0.0789 for the diluted methane-air mixture is found in the region around the radius of 3 mm where the axial velocity is a minimum. At this minimum velocity the leading edge of the triple flame, the triple point, stabilizes. The velocity at this position from the numerical calculation is 39 cm/s and in the PIV measurements due to averaging effects slightly higher. It is therefore almost equal to the laminar burning velocity of a stoichiometric premixed methane flame. Velocity Field
Fig. 9. Measured, symbols, and calculated, solid lines, radial profiles of axial velocity, u, and mixture fraction, Z, at stabilization height of triple flame.
In Fig. 10 the computed stream function is shown together with visualized stream lines from the experiments. Ahead of the flame a divergence
346
T. PLESSING ET AL. Temperature and Stable Species Distributions
Fig. 11. Axial velocity profiles at r 5 3.2 mm: comparison between experimental data from PIV measurements, symbols, and numerical simulation, solid lines (numerical data are shifted by 7.5 mm to match stabilization height).
of the flow field due to thermal expansion can be observed. Behind the flame front the streamlines are redirected towards the centerline due to air entrainment by the fast acceleration of the flow resulting from buoyancy forces. Velocities from the numerical simulation are compared with experimental data from PIV measurements. Figure 11 shows the numerical and experimental profiles of the axial velocity at the radial position of the triple point. When the flow was seeded with particles for the PIVmeasurements, the flame stabilized further downstream and the appearance of the flame changed to a yellow color, as in sooting flames, while it was blue without seeding. We assume that the particles did not affect the flow field but increased the radiative heat loss, which resulted in a lower burning velocity. Since the stabilization height of the flame was 7.5 mm higher than in the numerical simulation, the numerical data are plotted in Fig. 11 with an axial coordinate shift of 7.5 mm to obtain the same flame location. With the coordinate shift applied, the agreement between the measured and numerically simulated profiles at the stabilization height and in the unburnt gas is quite good. Both velocity profiles share the same acceleration of the burnt gas further downstream, which is due to buoyancy. The burnt gas velocities show some differences, which stem from the moderate flow instabilities at the outer edge of the flame.
The most characteristic scalar field of a flame is that of temperature, which is shown in Fig. 12. The highest temperatures is to be found in regions of stoichiometric mixture, where the maximum temperature is 2032K. The stabilization height is 37.5 mm above the burner in the simulation and 38.5 mm in the experiment. The comparison between the measurements and the simulation shows good agreement of the temperature distribution and flame shape. In the upper region of the flame the experimental results show lower temperatures than the simulation. One reason for this could be an underprediction of the radiative heat loss. Figure 13 shows the comparison for the fuel mole fraction. The fuel is consumed at the flame front. The calculations show that on the line of symmetry at a height of 50 mm above the burner only 1% fuel is left and at 60 mm only 1 ppm. Some fuel from the lean co-flow is transported outward away from the flame and is not burned at all. The agreement with the experiment is very good especially in the cold part. In the experiment it was not possible to calculate species concentrations in the rich part of the flame since broadband emissions from higher hydrocarbons influenced significantly most of the vibrational Raman lines. This part is masked with black. In the premixed rich part the excess methane is oxidized to H2 and CO, which burn in the diffusion flame with the excess oxygen that penetrates through the outer lean premixed flame. The equivalence ratio in the rich premixed flame is F 5 1.7 on the centerline, at which a homogeneous premixed mixture is beyond the flammability limit. In the triple flame heat conduction from the diffusion flame sustains combustion under these very rich conditions. This effect is of practical importance since it also occurs in stratified charge or diesel engines. In Fig. 14 the oxygen concentration is shown. In the rich premixed flame oxygen is consumed entirely, whereas in the lean premixed flame 10% of the oxygen is left behind and subsequently consumed in the diffusion flame. Figures 15 and 16 show the distributions of the mole fractions of CO2 and H2O, respec-
LAMINAR TRIPLE FLAME
347
Fig. 12. Calculated and measured temperature distribution.
Fig. 13. Calculated and measured mole fraction of methane.
Fig. 14. Calculated and measured mole fraction of O2.
Fig. 15. Calculated and measured mole fraction of CO2.
348
Fig. 16. Calculated and measured mole fraction of H2O.
Fig. 18. Calculated sum from mole fraction of C2Hx and C2Hx -LIF signal in arbitrary units (a.u.).
T. PLESSING ET AL.
Fig. 17. Calculated mole fraction of OH and OH-LIPF signal in arbitrary units (a.u.).
Fig. 19. Calculated heat release rate. Left side illustrates original data, right side illustrates data multiplied by 10 in order to show structure at small values.
LAMINAR TRIPLE FLAME tively. Most of the H2O is formed in the rich flame, whereas CO2 peaks in the diffusion flame. This effect can be observed in both experiment and simulation. Fluctuations in the experimental data are due to the relatively small signal-to-noise ratio in the hottest part of the flame since the Raman signal correlates directly with number density.
INTERMEDIATE SPECIES DISTRIBUTIONS Figure 17 shows the computed OH concentration and the OH-LIPF signal in arbitrary units (a.u.) from the experiments. The OH radical is found mainly in the diffusion flame part of the triple flame. The numerical and experimental OH distributions agree quite well. The experimental data show a somewhat thicker region of high OH concentration as well as a larger diameter of the high OH concentration region, but since the OH-LIPF intensity does not scale linearly with mole fraction, this disagreement is not relevant. The numerically predicted flame length is longer than in the experimental data. This matches well with the temperature distribution (Fig. 12), which showed lower temperatures in the measurements at higher positions. Finally, Fig. 18 shows the sum of C2Hx intermediates. The experiment shows a shorter rich premixed flame, which results in a shorter diffusion flame, as can be also seen from the OH-Radical distribution in Fig. 17. It can be concluded regarding the measurements of intermediate species, that no radical measured in this study shows the distinct triple flame structure. The lean reaction zone is particularly difficult to visualize. A recent publication of Najm et al. [32] on the adequacy of certain experimental observables as a measurement of the flame burning rate shows HCO to be a possible marker for the visualization of the triple flame structure. Unfortunately, imaging of HCO-laser-induced fluorescence needs more improvement for application, since the fluorescence yield is very low.
349 Heat Release, and Vorticity Field In Fig. 19, the numerically calculated distribution of the heat release rate is shown. The original data are presented at the left while the right side illustrates the same data multiplied by 10 in order to show the structure of small values. Here, the triple flame structure of this flame can clearly be identified. The heat release rate peaks at the triple point, which correlates well with the high OH-radical level at this position (Fig. 17). Figure 20 shows the computed vorticity field. The vorticity peaks behind the lean as well as the rich premixed flames close to the triple point, because it is generated by thermal expansion when the flame front is inclined with respect to the flow direction. Further downstream vorticity fluctuations at the lean branch of the flame are observed; these are believed to stem from the convex tip of the diffusion flame. Generally, the outer edge of the flame shows weak oscillations due to an unstable layering of the gas. Those fluctuations are also observed in the experiments. Flame Structure There is a similarity between partially premixed counterflow flames and the radial structure of triple flames. At low strain rates, the partially premixed counterflow flame exhibits three distinct reaction zones, which correspond to those of a diffusion flame placed between a rich premixed and a lean premixed flame. At increasing strain rates the premixed flames merge into the diffusion flame forming one single layer [33]. A very similar structure can be found in radial profiles in the two-dimensional simulation of the triple flame where the strain rate decreases with downstream distance. Figures 21–24 show radial profiles of temperature and heat release rates at different heights above the burner, plotted as a function of mixture fraction. Figures 21 and 22 show these profiles at a height of 36.6 mm and 37 mm above the burner, which is the stabilization region of the flame. At 36.6 mm, both fuel and oxydizer are not consumed completely and the temperature is still fairly low. The heat release rate has a single
350
T. PLESSING ET AL.
Fig. 22. Radial profiles of temperature and heat release in mixture fraction space 37 mm above burner.
Fig. 20. Calculated vorticity distribution.
ture fraction space, and three reaction zones can be distinguished: at Z 5 0.04 the lean premixed flame, at Z 5 0.09 the diffusion flame, and at Z 5 0.11 the rich premixed flame. In Fig. 24 the profiles at 44 mm above the burner are shown. The flame has again become wider in mixture fraction space. The heat release rate shows three clearly separated peaks corresponding to the reaction zones, the diffusion flame peak now being the highest.
peak around the stoichiometric mixture. At 37 mm all the fuel and most of the oxygen is already consumed and the temperature is close to its maximum. The heat release rate has now two distinct peaks: one is due to the lean premixed flame, and the other, stronger one, is due to the rich premixed flame. At 40 mm above the burner, as shown in Fig. 23, the temperature profile is broader in mix-
Derivation of a Burning Law
Fig. 21. Radial profiles of temperature and heat release in mixture fraction space 36.6 mm above burner.
Fig. 23. Radial profiles of temperature and heat release in mixture fraction space 40 mm above burner.
A very interesting property of a triple flame is its burning velocity relative to the unburnt gas, as a function of mixture fraction and strain rate, which may be expressed by the scalar dissipation rate
x 5 2D~¹Z! 2.
LAMINAR TRIPLE FLAME
Fig. 24. Radial profiles of temperature and heat release in mixture fraction space at 44 mm above burner.
To compute this burning velocity, first a flame contour for the rich and the lean premixed flame branches has to be defined. By starting from a temperature contour of T 5 1200K and searching for the first local maximum of the heat release rate in normal direction towards the burnt gas (see Fig. 25) a premixed flame contour is found. On this flame contour the normal velocity component was evaluated and multiplied by the local density, thus defining the local flow rate through the flame contour. The flow rate through the contour is plotted in Fig. 26 vs Z, together with the corresponding local scalar dissipation rate and the flow rate
351
Fig. 26. Flow rate through triple flame contour (r s) compared to flow rate of burning law (r u s 0L ) together with local scalar dissipation rate (x) along flame contour.
that was calculated from a simple burning law. This was derived by fitting the burning velocity for premixed flames as shown in Fig. 5 to the ansatz
S
~ r s!~Z! 5 ~ r us oL!~Z! 1 2 a
D
x ~Z! . xq
The scalar dissipation rate at quenching is calculated as x q 5 30 s21 for this diluted methane diffusion flame [34]. The parameter a was evaluated as 0.96. In Fig. 26 the scalar dissipation rate rises from low values to about 6 s21 for stoichiometric mixtures, and increases up to 9.5 s21 for rich mixtures. For very lean and very rich conditions the actual flow rate is higher than in the burning law. This is due to the preheating from the diffusion flame. For close-to stoichiometric mixtures, the flow rate is considerably lower, which probably is due to increased heat loss resulting from flame front curvature in this region. It can be concluded that for a precise prediction of triple flame propagation, effects of preheating and heat loss need to be considered and a simple burning law expression may not be sufficient. CONCLUSIONS
Fig. 25. Definition of premixed flame contour.
A laminar lifted diffusion flame with a distinct triple flame structure was investigated experimentally and has been simulated numerically. The simulation provides detailed information
352 about intermediate species and radicals and their rates of formation and consumption, as well as the temperature and flow field. It has been shown that the reduced chemical mechanism needed to be optimized to correctly predict the burning velocity at large equivalence ratios since rich premixed flames stabilize up to an equivalence ratio of F 5 1.7 due to heat conduction from the diffusion flames. The different experimental methods were able to measure the velocities, temperature, and most of the major and some minor species concentrations. Comparison between measured and calculated velocities shows very good agreement, although, due to particle seeding, the lift-off height is lower in the simulation than in the experiment. The comparison between simulation and measurements of temperature and intermediate species distributions show the same flame shape and structure. Only in the rich premixed flames, where thermal decomposition of methane occurs, is faster chemical conversion observed behind the reaction zone than is numerically predicted. Stable species show good agreement between simulation and experiment within experimental accuracy. There is no intermediate nor stable specie that alone clearly shows the distinct triple flame structure. It is, however, clearly shown by the numerically calculated heat release rate. A comparison of heat release rate and temperature in mixture fraction space between the triple flame and partially premixed counterflow flames show a similarity, both exhibiting three distinct reaction zones due to the rich premixed, the diffusion, and the lean premixed flame. The spatial structure of the triple flame with the merging of the three flame branches, as one moves upstream, corresponds to the merging of the three reaction zones in a partially premixed counter flow flame as the strain rate increases. Finally, a simple burning law for triple flames is formulated with an ansatz based on the burning velocity for premixed flames. A correction term based on the scalar dissipation was introduced taking the influence of mixture fraction gradients into account. It is found that the structure of a triple flame is influenced essentially by two external parameters: heat exchange between the branches and heat loss at the curved flame front near the triple point.
T. PLESSING ET AL. We thank S. Breuer for the data evaluation of the PIV-measurements. This work has been supported by the Deutsche Forschungsgemeinschaft Gemeinschaft (DFG) under contract Pe-241/ 14-1.
REFERENCES 1. Phillips H. (1965). In 10th Symposium (Int.) on Combustion, The Combustion Institute, Pittsburgh, pp. 1277–1283. 2. Buckmaster J. and Matalon M. (1988). In 22nd Symposium (Int.) on Combustion, The Combustion Institute, Pittsburgh, pp. 1527–1535. 3. Dold J. W. Combust. Flame, 76:71– 88 (1989). 4. Hartley L. J. and Dold J. W., Flame Propagation in a Nonuniform Mixture: Analysis of a Propagating Triple Flame, Comust. Sci. Technol. 80:23– 46 (1991). 5. Kioni P. N., Rogg B., Bray K. N. C., and Lin ˜´an A., Combust. Flame, 95:276 –290 (1993). 6. Veynante D., Vervisch L., Lin ˜´an A., and Ruetsch G. R. (1994). Proc. of Summer Prog. 1994, Center of Turbulence Research, Stanford University, CA. 7. Domingo P. and Vervisch L. (1996). 26th Symposium (Int.) on Combustion, The Combustion Institute, Pittsburgh, pp. 233. 8. Echekki T. and Chen H., Combust. Flame, 114: 231–245, 1997. 9. Chung S. H. and Lee B. J., Combust. Flame, 86:62–72 (1991). 10. Cha M. S. and Chung S. H., Characteristics of Lifted Flames in Nonpremixed Turbulent Confined Jets, In 26th Symposium (Int.) on Combustion, pages 121–128, The Combustion Institute, 1996. 11. Lee B. J., Kim J. S. and Chung S. H., Effect of Dilution on the Liftoff of Non-Premixed Jet Flames, In 25th Symposium (Int.) on Combustion, pages 1175–1181, The Combustion Institute, 1994. 12. Pitts, W. M. (1988). 22nd Symposium (Int.) on Combustion, The Combustion Institute, Pittsburgh, pp. 809 – 816. 13. Dahm, W. J. A. and Dibble R. W. (1988). 22nd Symposium (Int.) on Combustion, The Combustion Institute, Pittsburgh, pp. 801– 808. 14. Mu ¨ller C. M., Breitbach H., and Peters N. (1994). 25th Symposium (Int.) on Combustion, The Combustion Institute, Pittsburgh, pp. 1099 –1106. 15. Breuer S. and Peters N. (1996). Kolloqium des SFB 224 an der RWTH-Aachen-Motorische Verbrennung, RWTHAachen. 16. Andresen P., Bath A., Gro ¨ger W., Lu ¨lf H. W., Meijer G., and ter Meulen J. J., Applied Optics, 27:365–378 (1988). 17. Andresen P., Meijer G., Schlu ¨ter H., et al., Applied Optics, 29:2392–2404 (1990). 18. Andresen P., Universita¨t Bielefeld, private communication with the corresponding author, April 1997.
LAMINAR TRIPLE FLAME 19. Brockhinke A., Andresen P., and Kohse Ho ¨inghaus K., Applied Physics B, 61:533–545 (1995). 20. Cheng T. S., Wehrmeyer J. A., and Pitz R. W., Combust. Flame, 91:323–345 (1992). 21. Mansour M. S. and Chen Y. C., Applied Optics, 35: 4252– 4260 (1996). 22. Dibble R. W. and Hollenbach R. E. (1981). 18th Symposium (Int.) on Combustion, The Combustion Institute, Pittsburgh, pp. 1489 –1499. 23. Dibble R. W., Sta˙rner S. H., Masri A. R., and Barlow R. S., Applied Physics B 51:39 – 43 (1990). 24. Plessing T. and Mansour M. S., Appl. Optics., in press. 25. Go ¨ttgens J. (1994). Ph.D. thesis, RWTH Aachen. 26. Smooke M. D. and Giovangigli V., in Reduced Kinetic Mechanisms and Asymptotic Approximations for Methane-Air Flames (M. D. Smooke, Ed.), Lecture Notes in Physics 384, Springer Verlag, New York, 1991. 27. Burcat A., in Combustion Chemistry (W. C. Gardiner, Ed.), Springer Verlag, New York, 1984. 28. Peters N. and Rogg B., Eds., Reduced Kinetic Mecha-
353
29. 30.
31.
32. 33.
34.
nisms for Applications in Combustion Systems, Lecture Notes in Physics m15, Springer Verlag, New York, 1993. Law C. K., A Compilation of Experimental Data on Laminar Burning Velocities, in [28]. Brenan K. E., Campbell S. L., and Paetzold L. R., Numerical Solution of Initial-Value Problems in Differential-Algebraic Systems, North-Holland, New York, 1989. Lin ˜´an A., in Combustion in High Speed Flows (J. Buckmaster, T. L. Jackson, and A. Kumar, Eds.), Kluwer Academic Publishers, Boston, p. 461, 1994. Najm, H. N., Paul P. H., Mueller C. J., Wyckhoff P. S., Combust. Flam, in press. Peters N. (1984). 20th International Symposium on Combustion/The Combustion Institute, Pittsburgh, pp. 353–360. Pitsch H., private communication, Aachen, 1997.
Received 22 July 1997; revised 12 January 1998; accepted 18 January 1998