Evolutionary Ecology Research, 2004, 6: 579–593
Adaptive latitudinal shifts in the thermal physiology of a terrestrial isopod Luis E. Castañeda,1,2 Marco A. Lardies2* and Francisco Bozinovic2 1
Instituto de Ecología y Evolucíon, Facultad de Ciencias, Universidad Austral de Chile, Casilla 567, Valdivia and 2Center for Advanced Studies in Ecology & Biodiversity, Departamento de Ecología, Facultad de Ciencias Biológicas, Pontificia Universidad Católica de Chile, Santiago, CP 6513677, Chile
ABSTRACT Temperature is the most important abiotic factor affecting physiology, ecology and evolution in ectotherms. Do organisms broadly distributed along a latitudinal gradient adapt to local differences in temperature? In ectotherms this question has played a central role in evolutionary physiology. By means of an extensive field study and laboratory experiments, we tested the existence of local adaptations in thermal traits along 10⬚ of latitude in northern-central Chile. We studied behavioural and thermal traits that have been directly connected with the thermal physiology of ectotherms, along the latitudinal gradient. Using three populations of the common woodlouse (terrestrial isopod), Porcellio laevis, we examined changes in thermal physiology traits (i.e. thermal tolerance, thermal performance) and behavioural traits (i.e. thermoregulation in the field and the laboratory). Performance (i.e. righting response speed) reached a maximum value at intermediate temperatures, and was highest for the northern population. Chill-coma temperature showed an increase towards high latitude, while heat-coma temperature did not vary between populations. On the other hand, optimum temperature was negatively correlated with latitude. Thus, southern woodlice appear to have evolved towards becoming low-temperature specialists, whereas woodlice from warm regions demonstrate low cold tolerance as well as a higher optimum temperature. Our results demonstrate that P. laevis woodlice from different parts of the distribution range show patterns in thermal physiology that covary with the thermal environment (i.e. latitude); thus, P. laevis adapts to local environments to increase its performance. Keywords: ectotherm, thermal sensitivity, thermal tolerance, latitudinal gradient, local adaptation, temperature.
INTRODUCTION Temperature is perhaps the most important abiotic factor affecting physiology, ecology and evolution in endotherms and ectotherms (Cossins and Bowler, 1987; Huey and Kingsolver, 1993). Because environmental temperature varies in time and space at different scales, organisms are continually challenged to maintain homeostasis (Johnston and Bennett, * Author to whom all correspondence should be addressed. e-mail:
[email protected] Consult the copyright statement on the inside front cover for non-commercial copying policies. © 2004 Marco A. Lardies
580
Castañeda et al.
1996). Thus, thermal physiology may be a significant factor underlying the ecological and evolutionary success of organisms (Gilchrist, 1995; Pörtner, 2002). This is particularly true for ectotherms, because nearly all physiological and behavioural traits are sensitive to ambient temperature. Populations are expected to evolve adaptations to local conditions in heterogeneous thermal environments (Huey, 1982). Responses to environmental variation have been characterized in a quite consistent relationship in ectotherms, which relates performance and environmental temperature (Carrière and Boivin, 1997, 2001; Wilson and Franklin, 2000; Huey and Berrigan, 2001; van der Have, 2002). This relationship is a right-shifted function, where performance gradually increases with temperature, until reaching an optimum value, and then decreases abruptly towards higher temperatures (Huey and Stevenson, 1979; Huey and Berrigan, 1996). This function is the consequence of biochemical, physiological, morphological and/or behavioural traits and strategies that allow ectotherms to maintain thermal homeostasis within a wide range of temperatures (Angilletta et al., 2002; Neargarder et al., 2003). Environmental gradients are common-place in nature and are recognized to exert a major effect on patterns of intraspecific variation (Mizera and Meszéna, 2003). This fact, coupled with natural selection in the long term, produces conspicuous differences between populations, which are finally translated into local adaptations (Olsson and Uller, 2003). In this sense, adaptive shifts in the performance function can result from biological processes that occur over long time-scales (Angilletta et al., 2002). An important approximation for the study of adaptive shifts is to carry out comparisons at a geographical level, especially along latitudinal gradients, since mean annual environmental temperature decreases towards high latitudes. Many studies have used latitude as a natural source of variation, to study the physiological traits of many different organisms (Stillman and Somero, 2000; Gibert and Huey, 2001), and the strategies and mechanism that allow thermal tolerance (Addo-Bediako et al., 2000; Rasmussen and Holmstrup, 2002). However, latitudinal variation in traits closely related to fitness, such as sprint speed (van Berkum, 1988), growth rate (Lonsdale and Levinton, 1985) and mortality rate (Wilson, 1991), have received scant attention. Studies in evolutionary ecological physiology usually emphasize the analysis of species as a unit. Despite its importance, they pay little attention to physiological variability within a population or between populations of the same species inhabiting different habitats within a region or within individuals through time. In addition, most studies have not controlled for the phylogenetic relationships among species, which may lead to misleading conclusions about adaptation (Garland and Adolph, 1994). It is broadly accepted that to evaluate evolutionary changes, one must compare populations within species (intraspecific, population level) as well as individuals within breeding populations. In summary, little attention has been paid to interpopulation variation despite its potential use as an approach to study changes in performance between local environments (Angilletta et al., 2002). Since arthropods inhabit vastly different environments and have a wide range of distribution, they are good models for studying the effect of temperature on physiological performance (Willott, 1997; Sinclair et al., 2003). An especially interesting group are the terrestrial isopods, because they are one of the taxa least adapted to warm conditions (Warburg, 1987, 1993; Carefoot, 1993). We hypothesize that terrestrial isopods should present physiological and behavioural variation in their thermal physiology following exposure to low or high ambient temperatures.
Thermal physiology of Porcellio laevis
581
We predict that these organisms will exhibit thermal physiological responses that are closely matched to their habitat’s conditions – that is, local adaptation to thermal climate. Hence, in low-latitude populations thermal tolerances should be shifted to better correspond with their warmer environment (i.e. the curve should be shifted to the right) compared with high-latitude populations, where the curve should be shifted to the left. We used the terrestrial isopod Porcellio laevis (Crustacea: Oniscidea) as a study model. This species is widely distributed in Chile, as well as elsewhere around the world (Leistikow and Wägele, 1999). The thermal physiology of P. laevis has been poorly described and there are few existing studies about lethal temperatures and genetic polymorphisms for this species (Edney, 1964; McCluskey et al., 1993). The aim of this study was to determine the thermal physiology of this species to provide insight into adaptations to local thermal conditions. MATERIALS AND METHODS Animals, study site and maintenance We collected P. laevis individuals from three populations in north and central Chile, spanning a latitudinal range of nearly 10⬚. The localities were: Antofagasta (23⬚38⬘S), La Serena (29⬚55⬘S) and Santiago (33⬚23⬘S) (Table 1). All specimens collected were placed in plastic containers and transferred to the laboratory in the Department of Ecology of the Pontificia Universidad Católica de Chile. To remove possible confounding effects of sex we used only males. Males from all three populations were maintained under the same conditions – that is, acclimated at 21 ± 1⬚C; Table 1. Summary description of climatological variables for the three localities studied Antofagasta
La Serena
Santiago
Latitude Longitude Altitude (m) Mean annual temperature (⬚C) Mean minimum annual temperature (⬚C) Mean maximum annual temperature (⬚C) Total rainfall (mm)
23⬚38⬘S 70⬚26⬘W Sea level 17.0
29⬚55⬘S 71⬚15⬘W Sea level 14.9
33⬚23⬘S 70⬚42⬘W 420 13.9
13.3
11.2
7.7
20.1
18.9
22.1
FAO (1985); di Castri and Hajek (1976)
2.2
127.4
356.2
Total radiation (cal · cm−2 · day−1) Relative humidity (%)
423
340
310
72
80
75
Desert
Semi-arid
Mediterranean
FAO (1985); di Castri and Hajek (1976) FAO (1985); di Castri and Hajek (1976) FAO (1985); di Castri and Hajek (1976) di Castri and Hajek (1976)
Climate
Source
FAO (1985) FAO (1985); di Castri and Hajek (1976) FAO (1985); di Castri and Hajek (1976)
582
Castañeda et al.
photoperiod 14 : 10 light : dark; and fed ad libitum with dry spinach. They were kept in plastic cages with a wet layer of plaster of Paris covering the bottom of each cage. Plaster of Paris is an inert material that preserves humidity and also provides a source of calcium carbonate, which is needed for exoskeleton synthesis.
Field body temperature measurements To test for local adaptation in body temperature (Tb), we measured individual Tb and ambient temperature (Ta) for each locality during the austral summer of 2003. We manipulated the woodlice using latex gloves for a period of 5 s or less; during this time we inserted the thermocouple into the body of each individual. Ambient temperature was simultaneously measured with a thermocouple placed 1 cm over the site occupied by the isopod. Both body temperature and ambient temperature were measured using thin Cu-Constantan thermocouples and Cole-Parmer digital thermometers. We calculated the differential temperature between Tb and Ta (dT = Tb − Ta). This index indicates the increase of Tb over Ta, as a measurement of thermoregulatory capacity.
Thermal sensitivity and thermal tolerances We used righting response speed or rollover speed (i.e. the speed for an individual to change from an inverse position to an upright position) as a measure of the thermal sensitivity to different temperatures. Rollover speed was measured between 0⬚ and 41⬚C. Specifically, we measured this trait every 1⬚C in the extremes of each population’s tolerance range (0⬚ to 10⬚C and 36⬚ to 41⬚C), and every 2⬚C inside the range 12⬚ to 34⬚C. Rollover speed was considered as a measure of performance (Lutterschmidt and Hutchison, 1997). We estimated the physiological performance in each population, and then compared several indices of this performance among populations (i.e. optimum temperature, breadth temperature and maximum rollover speed). At extreme temperatures, some individuals had performance equal to zero. Those woodlice that exhibited a complete loss of righting response under extreme temperatures were considered to be in thermal coma (Lutterschmidt and Hutchison, 1997). This measurement is non-lethal and is useful for a large sample size (Huey et al., 1992). To determine rollover speed, we used the following experimental protocol. At each temperature treatment (0⬚ to 41⬚C), 25 individuals were placed in a plastic chamber (100 × 100 × 20 mm) with 25 subdivisions (20 × 20 × 20 mm) to separate individuals. The plastic chamber was then placed inside an incubator and maintained at the experimental temperature (held constant (± 0.5⬚C) using a water bath). After 30 min, we evaluated rollover speed for 10 min (i.e. a measure of righting response). If an individual was unable to right itself after this time, it was considered to be in thermal coma. Tolerance and performance curves were population measures, thus each woodlouse was used for only one experimental temperature. Animals that died during this measurement were excluded from the experiment. Body mass (mb) was recorded before all measurements using an analytical balance (CHYO JK-180, with precision ± 0.01 mg). After obtaining rollover speeds, we calculated the means for each experimental temperature. We observed that the means of each population followed a normal distribution along a wide range of temperatures (see Results). To calculate the optimum temperature for
Thermal physiology of Porcellio laevis
583
performance of each population, we fitted this mean to a Gaussian function. From this fit, we obtained the populational optimum temperature (Topt) ± 1 standard error. Using the mean values of rollover speed for each temperature, we calculated breadth of temperature (Tbr) for each population (Gilchrist, 1996): Tbr =
ui(Ti − Topt) umax
冪 Σ冤
2
冥
where ui is mean rollover speed at temperature Ti, and umax is the maximum rollover speed for each population. Thermal preference in the laboratory We built a thermal gradient in the laboratory using a 500 × 300 × 3 mm metal plate, covered with a 4 mm layer of plaster of Paris. The plate was divided into three separate runways (each 480 mm long and 90 mm wide) using opaque walls 80 mm high. The corners of the runways were rounded to avoid any corner effect (Warburg, 1993). To establish the thermal gradient, we heated one end of the metal plate with three infrared bulbs (250 W) and cooled the other end with a chilled water bath (−5⬚C) directly below the floor. The surface temperature in the gradient ranged from 5⬚ to 35⬚C and did not change during the course of each trial. We placed a cold light source at the cold end to avoid the formation of a luminous gradient. The experiment was performed at night, since these organisms are nocturnal. The thermal gradient was established for 30 min before the trials. Woodlice were removed from their cages, weighed in an analytical balance (CHYO JK-180, with precision ± 0.01 mg) and placed individually in separate runways at a random position within the thermal gradient. Then, individuals were allowed to acclimate for 30 min before we began testing. At the onset of the experiment we recorded Tb (initial Tpref) using an infrared thermometer with precision of ± 0.5⬚C (TempTest IR, Oakton®). Then, we recorded Tb every 30 min for both sets of experiments (i.e. middle Tpref and final Tpref, respectively). At the end of the experiments woodlice were returned to their cages. Statistical analysis For all cases we tested for a correlation between body mass (mb) and the thermal traits. Whenever this correlation was significant, we incorporated mb as a covariate in an analysis of covariance (ANCOVA). To test for differences in field Tb, we performed a linear correlation between Tb and Ta, and a linear regression between Tb and Ta and between the range of field body temperature (Tf) and maximum Tf. Also, to determine differences in dT among populations, we performed a mixed-model two-way analysis of variance (ANOVA). Locality was designated as a random factor (since we selected three populations from an infinite number of localities along a latitudinal gradient), and time of day was designated as a fixed factor (only two possible levels: day and night). Interaction between the two factors was considered random. Performance and thermal tolerance were analysed using a variety of methods. First, we used an ANOVA to test for differences in umax and heat coma among populations (random factor). Furthermore, we performed a correlation between Topt and
584
Castañeda et al.
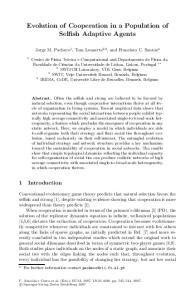
latitude and between Topt and mean annual temperature for each locality. To compare Topt among populations, we computed t-tests, with populational means and standard errors obtained from the fits to the Gaussian function, for all three populations (see above). To correct for type I errors, we performed sequential Bonferroni corrections (Rice, 1989). To calculate the populational Tbr, we utilized equation (1); then, we examined the correlation between this index and latitude, mean annual temperature and umax separately. Finally, to evaluate differences in chill-coma temperature, we used a separate-slopes ANCOVA model with locality as the random factor and mb as a covariate (Statistica 6.0). To evaluate differences in Tpref among localities, we performed a repeated-measures ANOVA, where the repeated measure was the Tpref of an individual during the three experiments. To compare the field body temperature and laboratory body temperature to each population (Tf and Tpref final, respectively), we used a t-test with sequential Bonferroni corrections. Before all analyses, we tested the data for normality and homoscedasticity (Kolgomorov-Smirnov and Cochran C tests, respectively). When necessary to meet assumptions, the data were log10transformed. When differences in the means were significant at the P < 0.05 level, they were also tested with an a posteriori Tukey test (HSD). All statistical analyses were conducted using Statistica 6.0 software (Statsoft Inc., Tulsa, OK). RESULTS Field body temperature Body temperature was strongly and positively correlated with Ta (β = 0.901 ± 0.02, t500 = 46.33, P < 0.0001), and Ta explained 81% of the variation in Tb (r2 = 0.81, F1,500 = 2146.3, P < 0.0001). In general, Tb was higher than Ta in this species (Fig. 1). We observed that Tf increased with latitude in P. laevis (Table 2). The Tf range (i.e. maximum minus minimum Tf recorded in the field) also increased towards high latitudes. This increment in the range was positively correlated with maximum Tf (r = 0.997, P < 0.05). We found that dT was highest in Antofagasta and lowest in La Serena (Table 3). At night, dT was higher than during the day (Fig. 2). However, both day and night dT varied along
Fig. 1. Relationship between body temperature (⬚C) and ambient temperature (⬚C) for each population of P. laevis. The solid line indicates a slope equal to 1 (Tb = Ta). 䊉, Antofagasta; 䊊, La Serena; 䉲, Santiago.
Thermal physiology of Porcellio laevis
585
Table 2. Distribution of field body temperature (Tf) of woodlice populations
Population
Latitude
Mean (⬚C)
SE (⬚C)
N
Minimum Tf (⬚C)
Maximum Tf (⬚C)
Range Tf (⬚C)
Antofagasta La Serena Santiago
23⬚38⬘S 29⬚55⬘S 33⬚23⬘S
18.7 19.1 20.4
0.13 0.16 0.36
180 146 176
15.1 15.7 12
23.1 23.9 31.2
8 8.2 19.2
Table 3. Results for morphological, physiological and behavioural traits for Porcellio laevis populations from Antofagasta, La Serena and Santiago (mean ± standard error)
Traits
Antofagasta 23⬚38⬘S
La Serena 29⬚55⬘S
Santiago 33⬚23⬘S
Body mass (mg) Topt (⬚C) Tbr (⬚C) umax (s−1) Initial Tpref (⬚C) Middle Tpref (⬚C) Final Tpref (⬚C) Tf (⬚C) dT (⬚C)
79.50 ± 1.51 24.69 ± 0.54 8.75 2.22 ± 0.28 11.07 ± 1.09 12.72 ± 1.31 14.68 ± 1.12 18.70 ± 0.13 2.34 ± 0.11
102.10 ± 1.52 20.94 ± 0.22 11.73 1.18 ± 0.17 12.58 ± 1.09 14.27 ± 1.21 16.72 ± 1.12 19.10 ± 0.16 1.29 ± 0.12
87.20 ± 1.53 21.12 ± 0.65 12.27 2.04 ± 0.30 9.40 ± 1.11 13.45 ± 1.34 12.02 ± 1.14 20.40 ± 0.36 2.11 ± 0.11
Note: Traits are abbreviated as follows: optimum temperature (Topt), temperature breadth (Tbr), maximum rollover speed (umax), preferred temperature (Tpref), field body temperature (Tf), temperature differential (dT = body temperature minus ambient temperature).
Fig. 2. Temperature differential (dT = Tb − Ta, ⬚C) in the field for three sites arranged along a latitudinal gradient. Open boxes represent the daytime differential and the solid boxes indicate the night-time differential. Middle points represent the mean value, the box indicates ±1 standard error, and the whiskers represent the mean ± 95% confidence interval.
586
Castañeda et al.
the latitudinal gradient, and was marginally significant among populations (Table 4). Antofagasta was the only population with statistically different dT between day and night, when compared with the other populations (a posteriori Tukey’s HSD test). Thermal sensitivity and thermal tolerances Rollover speed tended to increase with temperature in all populations, with maximum performance being reached at intermediate temperatures and then decreasing at higher temperatures (Fig. 3). Maximum rollover speed (umax) was highest in Antofagasta and lowest in La Serena (Table 3) with significant differences (one-way ANOVA: F2,70 = 4.98, P < 0.01). In each population, umax was attained at different optimum temperatures (Topt); again, the highest values were observed in Antofagasta and the lowest in La Serena (Table 3). We found significant differences between Antofagasta and La Serena (a posteriori Tukey’s HSD test). Differences in Topt between populations were statistically significant for comparisons of Antofagasta versus La Serena (t56 = 8.37, P < 0.0001), and Antofagasta versus Santiago (t56 = −16.07, P < 0.0001). The comparison between La Serena and Santiago was not significantly different (t56 = 0.42, P = 0.68). Populational Tbr increased towards high latitudes (Table 3). This index is positively correlated with latitude and negatively correlated with mean annual temperature, but both tendencies were not significant (r = 0.97, P = 0.15 and r = −0.98, P = 0.11, respectively). Table 4. Results of the mixed-model two-way ANOVA testing for the effects of locality (random factor) and time of day (fixed factor) on thermal differential, dT (⬚C) Factor Locality Time of day Locality × time of day Error
SS
d.f.
MS
F
P-value
57.14 13.01 1.85 693.03
2 1 2 486
28.57 13.01 0.93 1.43
19.98 13.99 0.65
< 0.001** 0.06 0.52
***P < 0.001; *P < 0.05.
Fig. 3. Thermal-sensitivity functions for rollover speed (s−1) in the three studied populations arranged along a latitudinal gradient. See text for details. 䊉, Antofagasta; 䊊, La Serena; 䉲, Santiago.
Thermal physiology of Porcellio laevis
587
The critical thermal minimum (CTm), represented by the chill-coma temperature (Tcc), was significantly different among populations (Table 5). There was latitudinal variation in Tcc (r = −0.997, P = 0.05). An a posteriori Tukey’s HSD test revealed significant differences between all populations (Fig. 4). There were no significant differences observed in the critical thermal maximum (CTM), represented by the heat-coma temperature (Thc), among populations (one-way ANOVA: F2,236 = 1.48, P = 0.23). Laboratory thermal preferences Tpref increased among experimental replicates; however, Santiago was the only population that exhibited a lower final Tpref than middle Tpref (Table 3). We found that Tpref varied between measurements, and among populations (Table 6). Comparisons among populations showed a mean Tpref higher in La Serena than Antofagasta and Santiago. We also compared Tpref between individuals in the laboratory and in the field. We compared final Tpref in the laboratory with nocturnal Tb in the field (Tf) within each population. We found significant differences between Tpref and Tf for populations from Antofagasta and Santiago (t118 = 4.77, P < 0.001 and t98 = 7.15, P < 0.001, respectively), but not in La Serena where Tf was higher than Tpref (t67 = 0.81, P = 0.42; see Table 2). Table 5. Results of the separate slopes model ANCOVA testing for the effect of locality on chill-coma temperature (⬚C), with body mass (mb) as a covariate Factor Locality Locality × mb Error
SS
d.f.
MS
F
P-value
7.20 8.52 149.41
2 3 349
3.6 2.84 0.46
7.83 6.17
< 0.001*** < 0.001***
***P < 0.001; *P < 0.05.
Fig. 4. Chill-coma temperature (䊉) and heat-coma temperature (䊊) of the three studied populations arranged along a latitudinal gradient. Bars represent ± standard error. See text for details.
588
Castañeda et al. Table 6. Results of the repeated-measures ANOVA testing for the effect of locality on preferred temperature, Tpref, along the three measures over time Factor Locality Error Tpref Locality × Tpref Error
SS
d.f.
MS
F
458.59 3967.44 492.74 17.49 2325.86
2 86 1 2 86
229.3 46.13 492.74 8.75 27.04
4.97 18.22 0.32
P-value < 0.01** < 0.001*** 0.72
***P < 0.001; **P < 0.01; *P < 0.05.
DISCUSSION How population differentiation affects thermal physiological ecology has been widely studied in different groups of ectotherms (see Parsons, 1993; Forsman, 1999; Angilletta et al., 2002; David et al., 2003). In this study, we documented intraspecific differences in organismal traits among populations of the terrestrial isopod, P. laevis, separated by 10⬚ of latitude. We found differences in thermal performance between populations both in the field and under laboratory conditions. This may indicate that thermal traits have diverged in response to local selective pressures (Johnston and Bennett, 1996). Field Tb measurements Porcellio laevis showed a low capacity for thermoregulation in the field, since Tb was observed to be highly dependent on Ta (Hertz et al., 1993). This was the case for almost all temperatures among the populations studied, with the exception of the highest Ta (see Fig. 1). Probably, behavioural mechanisms permitted isopods to avoid high temperatures; we also observed that Tb increased its mean, variation and range with latitude. These results support the classical latitudinal hypothesis, which predicts that low-latitude ectotherms should be adapted to a narrower range of temperatures, whereas mid-latitude ectotherms should be adapted to a broader range of temperatures (van Berkum, 1988). In addition, this pattern is supported by our climatological data, which show a higher temperature oscillation at high latitudes than low latitudes (see Table 1). When Tb was corrected for Ta, there was no consistent change with latitude (or mean annual temperature). This lack of pattern can be explained by differences in the use of thermal patches in animals’ microhabitats (Melville and Schulte, 2001), or by different thermoregulatory strategies that are not associated with thermal factors in the long term. However, we observed differences in dT between populations (when Tb was corrected for by Ta), which may imply the existence of different thermoregulatory mechanisms in each population. Soil-dwelling organisms (i.e. cryptozoic fauna), such as terrestrial isopods, inhabit terrestrial habitats with marked variations in abiotic conditions. Microclimatic conditions are defined as the specific environment experienced by an animal on the immediate spatial and temporal scale. Here we observed a difference of about 2⬚C in Tb (dT) between day and night. These differences may be due to the nocturnal activity of terrestrial isopods (Warburg et al., 1984), which also may increase their metabolic rate. The foraging behaviour and digestive processes associated with feeding result in a significant increase in metabolism. This process has been studied in
Thermal physiology of Porcellio laevis
589
individuals from a variety of taxonomic groups, including vertebrates, and appears to be quite a general phenomenon (McEvoy, 1984; Cortés et al., 1994; Spicer and Gaston, 1999; Kearney and Predavec, 2000; Willmer et al., 2000; Whiteley et al., 2001). An alternative hypothesis for the observed difference in temperature between day and night is that nocturnal temperatures have been behaviourally selected for in microhabitats where isopods are forced to perform some physiological processes (such as digestion or reproduction) that generally require warm temperatures (Steward, 1981). There is a significant lack of information regarding day–night patterns in the Tb of nocturnal invertebrates, and this paper is the first report on terrestrial isopods. Thermal sensitivity The performance function varied significantly between populations. We observed that maximum rollover speeds were reached under different thermal optima. Topt decreased with latitude. Hence, we can attribute the variation in Topt to local thermal conditions, but this factor does not explain all of the variation we observed for this trait. Furthermore, very little is known about variation in Topt on a latitudinal basis. Wilson (2001) reported that cool-temperate populations of the striped marsh frog showed a lower Topt than tropical populations. Other key parameters to characterize the thermal performance are Tbr and umax. These parameters can be measured at populational or individual levels and these could differ. Population performance could be determined by polymorphism in thermal traits, whereas individual performance could be influenced by genetic factors or phenotypic plasticity. We found that these indices, at the population level, increased and decreased with latitude, respectively. The correlation between these parameters will help us to determine potential trade-offs in population performance curves. This trade-off has been interpreted as an increment in maximum velocities and a reduction in Tbr, also known as the ‘jack-ofall-trades is a master of none’ hypothesis (Huey and Hertz, 1984; Huey and Kingsolver, 1989). We observed a negative correlation between population Tbr and population umax, but it was not significant (r = −0.52, P = 0.65). Thus, our results appear to support this hypothesis but more work is needed to confirm it for this species. A potential drawback of the study is that we included few populations (n = 3), which reduced the statistical power of our tests. Thermal tolerances Thermal tolerances varied with latitude only in the case of Tcc. The chill-coma temperature provides a good index of activity at low temperatures, and our results show that the measure of minimum critical temperature, CTm, decreases towards high latitudes. Hence, populations that experience low mean annual temperature in their habitats show a high tolerance for low temperatures (Table 1). Moreover, these traits exhibit clinal variation. This result is in line with the study of Gibert and Huey (2001), who found that Tcc was inversely related to latitude in Drosophila subobscura. Low-latitude populations showed less thermal tolerance than high-latitude populations. This suggests a potential adaptation to cold temperatures towards high latitudes. The heat-coma temperature did not vary between populations. Heat tolerance in P. laevis showed a rigid response along the latitudinal gradient studied. This agrees with Edney (1964), who reported that the upper lethal limit in P. laevis of California, North America,
590
Castañeda et al.
did not differ between populations. A similar trend was reported in the lizard Eleutherodactylus sp., which did not exhibit differences along an altitudinal gradient (Christian et al., 1988). On the other hand, in Littorina species, researchers have observed extensive variation in Thc between populations and species (Clarke et al., 2000; Sokolova and Pörtner, 2003). A macro-scale study proposed that geographical variation at the upper limits of an organism’s temperature tolerance range is less variable than the lower limit (Addo-Bediako et al., 2000). This rigidity has two possible explanations: (1) a biochemical limitation stemming from the fact that proteins lose stability at high temperatures and may be denatured (Tomanek and Somero, 2002); and (2) small terrestrial arthropods such as P. laevis live under stones, pieces of wood and soil litter, where ambient temperatures are not higher than Thc (see Table 2) across populations (Sutton and Holdich, 1984). For this reason, woodlice probably do not need differential adaptations to high temperatures between populations. Thermal preferences in the laboratory In the laboratory study, we observed significant temporal variation in Tpref within each population. Tpref increased sequentially, which indicates that woodlice tended to prefer progressively higher temperatures. This demonstrates how it can be misleading to use only one record of Tb to infer Tpref. It appears that individuals tend to shift among thermal patches for a period of time before selecting the final Tpref (i.e. ‘final preferendum’). Final temperature preferendum is defined as the temperature around which all individuals will ultimately congregate regardless of their thermal experience before being placed in the gradient. Thus, it is a process that is not influenced by acclimation factors (Reynolds and Casterlin, 1979). Our results for Tpref are different from those reported for other species from the same family, such as Armadillidium vulgare, whose Tpref is around 18–21⬚C (Refinetti, 1984). On a geographical scale, we did not observe a particular pattern of Tpref along the latitudinal gradient. Tpref decreased with latitude, indicating that populations from high latitudes preferred low temperatures in the laboratory. However, we cannot support our hypothesis of a clinal variation in these traits. Comparisons between Tpref and Tf were consistent and highly significant: Tf was always higher than Tpref. These differences may be generated by laboratory conditions, where animals are not experiencing the environmental constraints that influence thermoregulation in the field (Hertz et al., 1993). This limitation evokes the popular trade-off of precision versus realism: laboratory settings provide precision and an exact response to a specific controlled effect but may not apply in field conditions. However, there are many questions that are virtually impossible to address without laboratory experiments. The intraspecific differences that we observed among populations could result from different developmental conditions due to local conditions or from genetic differentiation. These differences in thermal traits could be the end-product of local adaptation to microhabitats. According to Olsson and Uller (2003), local adaptation in thermal limits can be achieved by selection on survival at low temperatures. Therefore, in terrestrial isopods, the minimum temperature during winter is probably a more important limitation to distribution than the maximum temperature during summer. This idea agrees with studies performed in the woodlouse, Hemilepistus reaumuri, of North Africa (see Coenen-Stass, 1984). In summary, we found that populations of a terrestrial isopod have diverged in their thermal traits in accordance with their micro-environmental conditions. We observed
Thermal physiology of Porcellio laevis
591
that physiological and behavioural differences persist following laboratory acclimation. Consequently, we conclude that differences in thermal physiology are the consequence of local adaptation rather than phenotypic plasticity. Thus, southern woodlice (i.e. the Santiago population) appear to have evolved towards low temperature tolerance, whereas northern woodlice (i.e. the Antofagasta population) appear to have a higher optimum temperature. ACKNOWLEDGEMENTS We thank R.F. Nespolo for comments on an earlier draft on the manuscript. G. Gilchrist contributed substantially to the improvement of the manuscript. We thank M. Rosenzweig for helpful comments on the presentation of the results and for discussion. Financial support was provided by a CONICYT doctoral thesis fellowship to M.A.L. and F.B. acknowledges a grant from FONDAP 1501–0001 (Program 1). We thank I. Cotoras for kindly assisting us in collecting individuals from Antofagasta.
REFERENCES Addo-Bediako, A., Chown, S.L. and Gaston, K.J. 2000. Thermal tolerance, climatic variability and latitude. Proc. R. Soc. Lond. B, 267: 739–745. Angilletta, M.J., Niewiarowski, P.H. and Navas, C.A. 2002. The evolution of thermal physiology in ectotherms. J. Thermal Biol., 27: 249–268. Carefoot, T.H. 1993. Physiology of terrestrial isopods. Comp. Biochem. Physiol. A, 106: 413–429. Carrière, Y. and Boivin, G. 1997. Evolution of thermal sensitivity of parasitization capacity in egg parasitoids. Evolution, 51: 2028–2032. Carrière, Y. and Boivin, G. 2001. Constraints on the evolution of thermal sensitivity of foraging in Trichogramma: genetic trade-offs and plasticity in maternal selection. Am. Nat., 157: 570–581. Christian, K.A., Nunez, F. and Diaz, L. 1988. Thermal relations of some tropical frog along an altitudinal gradient. Biotropica, 20: 236–239. Clarke, A.P., Mill, P.J. and Grahame, J. 2000. Biodiversity in Littorina species (Mollusca: Gastropoda): a physiological approach using heat-coma. Mar. Biol., 137: 559–565. Coenen-Stass, D. 1984. Observation on the distribution of the Desert woodlouse Hemilepistus reaumuri (Crustacea, Isopoda, Oniscoidea) in North Africa. In The Biology of Terrestrial Isopods, Zoological Society of London Symposia #53 (S.L. Sutton and D.M. Holdich, eds.), pp. 369–380. Oxford: Clarendon Press. Cortés, A., Báez, C., Rosenmann, M. and Pino, C. 1994. Body temperature, activity cycle and metabolic rate in a small nocturnal Chilean lizard, Garthia gaudichaudi (Sauria: Gekkonidae). Comp. Biochem. Physiol. A, 109: 967–973. Cossins, A.R. and Bowler, K. 1987. Temperature Biology of Animals. London: Chapman & Hall. David, J.R., Gibert, P., Moreteau, B., Gilchrist, G.W. and Huey, R.B. 2003. The fly that came in from the cold: recovery time from low-temperature exposure in Drosophila subobscura. Funct. Ecol., 17: 425–430. di Castri, F. and Hajek, E. 1976. Bioclimatología de Chile. Santiago, Chile: Pontificia Universidad Católica de Chile. Edney, E.B. 1964. Acclimation to temperature in terrestrial isopods I. Lethal temperatures. Physiol. Zool., 37: 364–377. FAO. 1985. Datos agroclimatológicos: América Latina y El Caribe. Rome: Food and Agriculture Organization of the United Nations. Forsman, A. 1999. Variation in thermal sensitivity of performance among colour morphs of a pygmy grasshopper. J. Evol. Biol., 12: 869–878. Garland, T., Jr. and Adolph, S.C. 1994. Why not do two-species comparative studies: limitations on inferring adaptation. Physiol. Zool., 67: 797–828.
592
Castañeda et al.
Gibert, P. and Huey, R.B. 2001. Chill-coma temperature in Drosophila: effects of developmental temperature, latitude, and phylogeny. Physiol. Biochem. Zool., 74: 429–434. Gilchrist, G.W. 1995. Specialist and generalist in changing environments. I. Fitness landscape of thermal sensitivity. Am. Nat., 146: 252–270. Gilchrist, G.W. 1996. A quantitative genetic analysis of thermal sensitivity in the locomotor performance curve of Aphidius ervi. Evolution, 50: 1560–1572. Hertz, P.E., Huey, R.B. and Stevenson, R.D. 1993. Evaluating temperature regulation by field-active ectotherms: the fallacy of the inappropriate question. Am. Nat., 142: 796–818. Huey, R.B. 1982. Temperature, physiology, and the ecology of reptiles. In Biology of the Reptilia (C. Gans and F.H. Pough, eds.), pp. 25–91. New York: Academic Press. Huey, R.B. and Berrigan, D. 1996. Testing evolutionary hypotheses of acclimation. In Animals and Temperature (A. Johnston and A.F. Bennett, eds.), pp. 205–238. Cambridge: Cambridge University Press. Huey, R.B. and Berrigan, D. 2001. Temperature, demography and ectotherm fitness. Am. Nat., 158: 204–210. Huey, R.B. and Hertz, P.E. 1984. Is a jack-of-all-temperatures a master of none? Evolution, 38: 441–444. Huey, R.B. and Kingsolver, J.G. 1989. Evolution of thermal sensitivity of ectotherm performance. Trends Ecol. Evol., 4: 131–135. Huey, R.B. and Kingsolver, J.G. 1993. Evolution of resistance to high temperature in ectotherms. Am. Nat., 142: s21–s46. Huey, R.B. and Stevenson, R.D. 1979. Integrating thermal physiology and ecology of ectotherms: a discussion of approaches. Am. Zool., 19: 357–366. Huey, R.B., Crill, W.D., Kingsolver, J.G. and Weber, K.E. 1992. A method for rapid measurement of heat or cold resistance of small insects. Funct. Ecol., 6: 489–494. Johnston, I.A. and Bennett, A.F. 1996. Animals and Temperature: Phenotypic and Evolutionary Adaptation. Cambridge: Cambridge University Press. Kearney, M. and Predavec, M. 2000. Do nocturnal ectotherms thermoregulate? A study of the temperate gecko Christinus marmoratus. Ecology, 81: 2984–2996. Leistikow, A. and Wägele, J.W. 1999. Checklist of the terrestrial isopods of the New World (Crustacea, Isopoda, Oniscidea). Revs. Brasilera Zool., 16: 1–72. Londsdale, D.J. and Levinton, J.S. 1985. Latitudinal differentiation in copepod growth: an adaptation to temperature. Ecology, 66: 1397–1407. Lutterschimdt, W.I. and Hutchison, V.H. 1997. The critical thermal maximum: history and critique. Can. J. Zool., 75: 1561–1574. McCluskey, S., Mather, P.B. and Hughes, J.M. 1993. The relationship between behavioral responses to temperature and genotype at a PGI locus in the terrestrial isopod Porcellio laevis. Biochem. Syst. Ecol., 21: 171–179. McEvoy, P.B. 1984. Increase in respiratory rate during feeding in larvae of the cinnabar moth Tyria jacobaeae. Physiol. Entomol., 9: 191–195. Melville, J. and Schulte, J.A. 2001. Correlates of active body temperatures and microhabitat occupation in nine species of central Australian agamid lizards. Austral. Ecol., 26: 660–669. Mizera, F. and Meszéna, G. 2003. Spatial niche packing, character displacement and adaptative selection along an environmental gradient. Evol. Ecol. Res., 5: 363–382. Neargarder, G., Dahlhoff, E.P. and Rank, N.E. 2003. Variation in thermal tolerance is linked to phosphoglucose isomerese genotype in a montane leaf beetle. Funct. Ecol., 17: 213–221. Olsson, M. and Uller, T. 2003. Thermal environment, survival and local adaptation in the common frog, Rana temporaria. Evol. Ecol. Res., 5: 431–437. Parsons, P.A. 1993. The importance and consequences of stress in living and fossil populations – from life-history variation to evolutionary change. Am. Nat., 142: S5–S20.
Thermal physiology of Porcellio laevis
593
Pörtner, H.O. 2002. Climate variation and physiology basis to temperature dependent biogeography: systemic to molecular hierarchy of thermal tolerance in animals. Comp. Biochem. Physiol. A, 132: 739–761. Rasmussen, L.M. and Holmstrup, M. 2002. Geographic variation of freeze-tolerance in the earthworm Dendrobaena octoedra. J. Comp. Physiol. B, 172: 691–698. Refinetti, R. 1984. Behavioral temperature regulation in pill bug, Armadillidium vulgare (Isopoda). Crustaceana, 47: 29–43. Reynolds, W.W. and Casterlin, M.E. 1979. Behavioral thermoregulation and the ‘final preferendum’ paradigm. Am. Zool., 19: 211–224. Rice, W.R. 1989. Analyzing tables of statistical tests. Evolution, 43: 223–225. Sinclair, B.J., Vernon, P., Klok, C.J. and Chown, S.L. 2003. Insects at low temperatures: an ecological perspective. Trends Ecol. Evol., 18: 257–262. Sokolova, I.M. and Pörtner, H.O. 2003. Metabolic plasticity and critical temperatures for aerobic scopes in a eurythermal marine invertebrate (Littorina saxatilis, Gastropoda: Littorinidae) from different latitudes. J. Exp. Biol., 206: 195–207. Spicer, J.I. and Gaston, K.J. 1999. Physiological Diversity and its Ecological Implications. Oxford: Blackwell Science. Steward, R.C. 1981. The temperature preferences and climatic adaptations of building-damaging dry-wood termites (Cryptotermes; Isoptera). J. Thermal Biol., 6: 153–160. Stillman, J.H. and Somero, G.N. 2000. A comparative analysis of the upper thermal tolerance limits of eastern Pacific porcelain crabs, genus Petrolisthes: influences of latitude, vertical zonation, acclimation, and phylogeny. Physiol. Biochem. Zool., 73: 200–208. Sutton, S.L. and Holdich, D.M., eds. 1984. The Biology of Terrestrial Isopods. Zoological Society of London Symposia #53. Oxford: Clarendon Press. Tomanek, L. and Somero, G.N. 2002. Interspecific- and acclimation-induced variation in levels of heat shock proteins 70 (hsp70) and 90 (hsp90) and heat-shock transcription factor-1 (HSF1) in congeneric marine snails (genus Tegula): implications for regulation of hsp gene expression. J. Exp. Biol., 205: 677–685. van Berkum, F.H. 1988. Latitudinal patterns of thermal sensitivity of sprint speed in lizards. Am. Nat., 132: 327–343. van der Have, T.M. 2002. A proximate model for thermal tolerance in ectotherms. Oikos, 98: 141–155. Warburg, M.R. 1987. Isopods and their terrestrial environment. Adv. Ecol. Res., 17: 187–242. Warburg, M.R. 1993. Evolutionary Biology of Land Isopods. Berlin: Springer-Verlag. Warburg, M.R., Linsenmair, K.E. and Bercovitz, K. 1984. The effect of climate on the distribution and abundance of isopods. In The Biology of Terrestrial Isopods (S.L. Sutton and D.M. Holdich, eds.), pp. 339–367. Oxford: Clarendon Press. Whiteley, N.M., Robertson, R.F., Meagor, J., El Haj, A.J. and Taylor, E.W. 2001. Protein synthesis and specific dynamic action in crustaceans: effects of temperature. Comp. Biochem. Physiol. A, 128: 593–604. Willmer, P., Stone, G. and Johnston, I. 2000. Environmental Physiology of Animals. Oxford: Blackwell Science. Willott, S.J. 1997. Thermoregulation in four species of British grasshoppers (Orthoptera: Acrididae). Funct. Ecol., 11: 705–713. Wilson, B.S. 1991. Latitudinal variation in activity season mortality rates of the lizard Uta stansburiana. Ecol. Monogr., 61: 393–414. Wilson, R.S. 2001. Geographic variation in thermal sensitivity of jumping performance in the frog Limnodynastes peronii. J. Exp. Biol., 204: 4227–4236. Wilson, R.S. and Franklin, C.E. 2000. Inability of adult Limnodynastes peronii (Amphibia: Anura) to thermally acclimate locomotor performance. Comp. Biochem. Physiol. A, 54: 21–28.