AdAlyze Redux: Post-Click and Post-Conversion Text Feature Attribution for Sponsored Search Ads Thomas Steiner
∗
Google Germany GmbH ABC Str. 19, 20354 Hamburg, Germany
[email protected] ABSTRACT
based on a combination of bid, expected click-through rate, keyword relevancy, and site quality. Advertisers optimize keywords and ads for maximum return on investment (ROI).
In this paper, we present our ongoing research on an ads quality testing tool that we call AdAlyze Redux. This tool allows advertisers to get individual best practice recommendations based on an expandable set of textual ads features, tailored to exactly the ads in an advertiser’s set of accounts. This lets them optimize their ad copies against the common online advertising key performance indicators clickthrough rate and, if available, conversion rate. We choose the Web as the tool’s platform and automatically generate the analyses as platform-independent HTML5 slides and full reports.
1.2
Categories and Subject Descriptors
1.3
H.3.5 [Online Information Services]: Web-based services
Sponsored search ads, clickthrough rate, conversion rate
INTRODUCTION
Modern Internet search engines like Yahoo, Bing, Yandex, Baidu, or Google draw a significant share of their revenue from sponsored search results; also called search ads, sponsored links, or paid search. Advertisers pay only when the searcher is interested enough to click an ad and learn more.
1.1
Conversion Rate
A conversion is a customer action that has value to an advertiser’s business, such as a purchase, downloading an app, visiting a website, filling out a form, or signing a contract. Online and offline actions are called conversions because a customer’s click converted to business. By tracking these conversions, advertisers can invest more wisely, and ultimately boost their ROI. The conversion rate (CR4 ) is the average number of conversions per ad click, shown as a percentage. Conversion rates are calculated by taking the number of conversions and dividing that by the number of total ad clicks that can be attributed to a conversion during the same time period (conversions/clicks = CR).
Keywords 1.
Clickthrough Rate
The clickthrough rate (CTR3 ) is the number of clicks that an ad receives divided by the number of times the ad is shown, expressed as a percentage (clicks/impressions = CT R). A high CTR for an ad is a good indication that users find that ad helpful and relevant, and also affects an advertiser’s overall costs and ad positions. Increasing the CTR of their ads is thus in advertisers’ best interest.
Google AdWords
1.4
Google’s online advertisement program is called AdWords 1 and allows advertisers to be included in the sponsored results of a search for selected keywords. Search ads are sold via realtime auctions, where advertisers bid on keywords based on setting a maximum price per keyword (max CPC,2 maximum cost-per-click). Google then ranks sponsored listings
General Search Ad Copy Best Practices
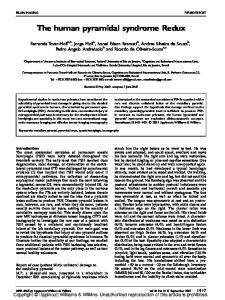
Text ads, the simplest version of the online ads AdWords offers, have three parts: a headline, a display URL, and two description lines. Figure 1 shows a sample text ad in the context of a search engine results page (SERP) with the different components annotated. General best practices for increasing both the CTR and the CR for search ad copies (or just ads) are covered in a white paper [6] published by Google. Search advertising today includes the full range of Internet-capable devices: desktop computers, tablets, and smart- or feature phones. Quoting from the introduction of the document: “Today’s consumers [. . . ] are constantly connected. Many of the screens these consumers use are mobile [. . . ]. Better creatives improve ad relevance and drive more qualified clicks.” A first best practice is to tie keywords back into ad creatives. Ads that contain phrases a user has searched for are
∗Second affiliation: CNRS, Universit´e de Lyon, LIRIS, UMR5205, Universit´e Lyon 1, France 1 Google AdWords: https://adwords.google.com/ 2 Cost-per-click bidding: https://support.google.com/ adwords/answer/2464960
Copyright is held by the International World Wide Web Conference Committee (IW3C2). IW3C2 reserves the right to provide a hyperlink to the author’s site if the Material is used in electronic media. International World Wide Web Conference 2015 Florence, Italy ACM 978-1-4503-3473-0/15/05. Include the http://DOI string/url which is specific for your submission and included in the ACM rightsreview confirmation email upon completing your IW3C2 form.
3
Clickthrough-rate:
https://support.google.com/
adwords/answer/2615875 4
Conversion
rate:
adwords/answer/2684489
1299
https://support.google.com/
In [12], Shaparenko et al. investigate the use of detailed word pair indicator features between the query and the ad for click prediction for ads with and without click history. In [10], Richardson et al. use textual features of an ad, the ad’s landing page, and statistics of related ads to build a model for the prediction of the future CTR of that ad. Scully et al. use textual features of ads to predict bounce rates of ad clicks [11], i.e., the fraction of users who click on an ad, but almost immediately move on to other tasks. In [2], Buscher et al. use eye tracking to examine how users interact with search engine results pages, including ads. During their experiments, they varied the ad quality randomly and detected that when good quality ads were displayed, participants paid twice as much attention to these ads and less attention to the organic results. As our tool’s results were shown to a heavily biased group of manually whitelisted advertisers, the findings cannot be simply generalized. In [8], Lambert and Pregibon investigate ways to deal with biased sampling where only manually selected advertisers are allowed for a new feature.
Figure 1: Sample AdWords ad on the right with different components: headline (blue), display URL (green), and description lines (gray)
more likely to resonate than those that do not. Based on internal Google data, tying keywords into headlines alone lifted ad CTRs on average 15%. Tying keywords into the display URLs alone lifted ad CTRs on average 8%. Ads that featured keywords in both the headline and first description line impacted CTR positively 68% of the time. Another set of best practice is to write simple, compelling ad copies that include specific calls to action like “download now!” and effective selling points including prices, discounts, product names, customizations, and offers such as free shipping. Users click more often when they see a brand they recognize. If brand terms are trademarked, adding ® or ™ after the brand name can make an even stronger impression.
1.5
3.
Contributions and Problem Statement
While some best practices like tying keywords into ads and measuring the impact at various locations of the ad copy is easily automatable at scale, other best practices turn out to be a lot more challenging. Brand terms vary for each advertiser and are ambiguous (e.g., “dell” may refer to a US computer technology company or an Italian grammatical article). Calls to action obviously are languagedependent (“t´el´echargez maintenant!” vs. “download now!”). Price labeling varies from country to country ($ 9, 999.99 vs. 9. 999,99 €), etc. Some best practices may, at times, in practice result in less clicks, for example, when using a brand term of an “underdog” brand when highlighting other aspects (like lower prices) would be more favorable. In this paper, we describe a language-independent approach that was implemented in a Google-internal tool called AdAlyze Redux for advertisers to quickly and iteratively test their ads based on a predetermined, yet arbitrarily expandable, set of text ad features in order to optimize the clickthrough rate and/or the conversion rate of their ads. While the tool itself was not shared with advertisers, reports generated by that tool were shared with a group of manually whitelisted large-scale advertisers.
2.
EXAMINED AD FEATURES
Overall, for each advertiser individually, we look at a predetermined set of 60 textual ad features that can be categorized into 11 groups and additionally an arbitrary set of custom ad features that each advertiser can tailor to their needs. We use terms as follows. For a general nomenclature of text ads, we refer the reader to Figure 1. Additionally, we use the term “ad text” that refers to the concatenated string of headline, description 1 and description 2. The example advertiser below is the company “Google”, which owns brand terms such as “Google”, “AdWords”, “Gmail”, etc. 1. Ad Character Length: This ad feature deals with the impact of string character length variations. We check the character lengths of the ad text, the headline, the description 1, the description 2, and the display URL. 2. Display URL: This ad feature deals with the impact of display URL variations. The display URL can be seen as a “vanity URL” that—within the rules of the display URL policy5 —does not need to exactly reflect the actual destination URL, making it a great optimization target. (a) Display URL has Path: Whether the display URL has a path like example.org/path. (b) Display URL has Path Refinement: Whether the display URL has a path refinement like example.org/ coarse/fine. (c) Display URL Starts With WWW: Whether the display URL starts with www. (d) Display URL has Subdomain: Whether the display URL has a subdomain like subdomain.example.org
RELATED WORK
(e) Display URL Starts With HTTP: Whether the display URL starts with http://.
Analyzing textual features of ads for various purposes like click prediction, online auction studies, or in our case ads quality estimation, among others, has received significant attention in recent years [3, 4]. Textual features of all parts of an ad contribute to the ad’s performance. Research by Jansen and Resnick [7] proposes that users consider each, the headline, description, and display URL of text ads during the decision process of whether to click through or not.
(f) Display URL Suggests Mobile Content: Whether the display URL suggests that the landing page is mobileoptimized like m.example.org or example.mobi. 5 Display URL policy: https://support.google.com/ adwordspolicy/bin/answer.py?answer=175906
1300
3. Brand Reference: This ad feature deals with the impact of using an advertiser’s brand terms at varying places and with varying frequencies. We check whether a brand term like “Gmail” is used in the ad text, the headline, the description 1, and the description 2. We further check how often a brand term is used in the ad text. 4. Keyword Insertion: This ad features deals with the impact of dynamic keyword insertion,6 an AdWords system functionality that—bound to given rules—dynamically inserts the search terms instead of a placeholder into the ad. We check for keyword insertion in the ad text, the headline, the description 1, the description 2, and the display URL. We further check how often keyword insertion occurs in the ad text. 5. Ad Parameters: This ad features deals with the impact of ad parameters.7 Ad parameters are an advanced programmatic AdWords feature that enables numerical information to be dynamically updated within an ad. The advantage of ad params compared to the similar feature keyword insertion is that they are updated programmatically via the AdWords API or scripts, allowing for dynamic “{{n}} items left” ads or similar when synchronized with an inventory control system We check for ad parameters in the ad text, the headline, the description 1, the description 2, and the display URL. We further check how often ad parameters occur in the ad text. 6. Ad Customizers Insertion: This ad feature deals with the impact of ad customizers.8 Ad customizers adapt text ads to the full context of a search or the webpage the user is viewing. They can insert a keyword, the time left before a sale ends (with a countdown function), and any other text that one defines. They work with tabular data that the user uploads to AdWords. We check for ad customizers in the ad text, the headline, the description 1, and the description 2. We further check how often ad customizers occur in the ad text.
8. Quantification: This ad feature deals with the impact of quantification of offers. Examples of qunatification can be “choose from 100s of items” or “only 10 rooms left”. We check for quantification in the ad text, the headline, the description 1, and the description 2. 9. Price: This ad feature deals with the impact of prices in ads that can take different forms regarding thousand separators and currency symbols like “$ 9, 999.99”, compared to “9. 999,99 €” or “9,99 EUR”. We check for prices in the headline, the description 1, and the description 2. 10. Price Reduction: This ad feature deals with the impact of price reductions like “50% off”. We check for price reductions in the headline, the description 1, and the description 2. 11. Ad Pixel Width: This ad feature deals with the impact of ad pixel width, i.e., the physical space an ad requires when it is rendered in the browser. While the string character lengths of ‘l’ and ‘m’ are the same (1), their pixel widths are quite different. This can be especially interesting in the context of mobile,10 where screen real estate is limited. We check the pixel width of the headline, the description 1, the description 2, and the display URL. 12. Custom Ad Features: This ad feature lets advertisers specify arbitrary custom ad features as plain text or regular expressions that they want to evaluate. Examples can be company slogans, synonyms, or variations like “5 star hotel” compared to “***** hotel”. Custom ad features can be tested at each part of the ad, i.e., headline, description 1 and 2, and display URL. (a) Contains: The ad feature must be contained in the specified part of the ad. (b) Contains Not: The ad feature must not be contained in the specified part of the ad. (c) Number Of: The number of times the ad feature is contained in the specified part of the ad.
7. Punctuation: This ad feature deals with the impact of punctuation. Punctuation in AdWords is bound to editorial guidelines,9 e.g., the headline may not contain an exclamation mark.
4.
The AdAlyze Redux tool was implemented as a Node.js JavaScript application. It uses only the advertisers’ own data, i.e., no other market or benchmark data, so sharing the information with the particular advertiser is not a problem and covered by the Google data sharing policy.
(a) Period: We check for periods at the end of the headline, the description 1, and the description 2. (b) Question Mark: We check for question marks at the end of the headline, the description 1, and the description 2.
4.1
(d) Colon: We check for colons at the end of the headline and the description 1. Keyword
insertion:
https://support.google.com/
adwords/answer/74992 7 Ad parameters: https://developers.google.com/ adwords/api/docs/guides/ad-parameters 8 Ad customizers: https://support.google.com/adwords/ answer/6072565 9 AdWords Editorial Guidelines: https://support. google.com/adwordspolicy/answer/6021546
Data Acquisition Phase
The required data is externally available for qualifying advertisers in form of the Ad Performance report11 that can be obtained via the AdWords API for a given date range for one or multiple of an advertiser’s accounts. Certain advertising campaigns or ad groups can be explicitly excluded or included, so that fine-grained reports are possible that, for example, only cover an advertiser’s brand campaigns. We access data from the Ad Performance report via Googleinternal means on behalf of customers and with their approval. The AdAlyze Redux tool makes use of the report fields that we list in continuation.
(c) Exclamation Mark: We check for exclamation marks at the end of the description 1 and the description 2.
6
IMPLEMENTATION DETAILS
10
Ads on mobile: http://adwords.blogspot.de/2014/09/ making-every-character-count.html 11 Ad Performance Report: https://developers.google. com/adwords/api/docs/appendix/reports#ad
1301
– – – – –
2.53%
4.5
2.07% 1.74%
0.765% 10
15
20
25
30 35 Length Description 1
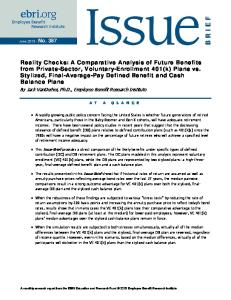
Example 2: multi-value ads feature “Length Description 2” and impact on CTRs for different treatment and control groups.
Statistical Significance
4.6
Correlation and Causation
We are well aware of the common phrase “correlation does not imply causation.” In the concrete case, however, we take a very pragmatic xkcd-#552-inspired [9] approach to the problem. As there are not any reasonably accessible post-click and/or post-conversion text attribution methods, we act along xkcd’s hidden mouseover text “but [correlation] does waggle its eyebrows suggestively and gesture furtively while mouthing ‘look over there’.” We encourage humans to interpret the automatically generated analyses with a grain of salt and a fair amount of common sense.
4.7
Results Presentation Phase
As the results of the AdAlyze Redux tool are not general market best practices (in contrast to the white paper [6]), but instead highly advertiser-specific recommendations, we opted for a two-fold dynamic output format that generates a full report and a pitch deck automatically each time the tool is run. The pitch deck is meant for the Google Sales teams to pitch recommended ad improvements to the advertiser, whereas the full report is meant to be left with the advertiser for detailed study after the presentation. We went for a fully Web-based solution in both cases, as it makes modifications easy and obviously is platformindependent. AdAlyze Redux automatically creates HTML5 slides [5] that work on desktops, tablets, and mobiles. We use Mike Bostock’s data visualization library D3.js [1] to create resolution-independent high quality scalable vector graphics (SVG) diagrams. The full report is a long, interlinked HTML document that makes jumping from one topic to the other very easy, (e.g., from “length of description 1” to “length of description 2” ). In the slides and the report,
http://xregexp.com/
plugins/#unicode 13
2.70%
In order to be included in the analysis, ads have to have obtained at least 1, 000 clicks. This fixed number was empirically determined by a prior Google-internal study, whose results were published in the white paper [6]. For each group, we require at least 5% of all ads to be included in that group, else, the group is not considered. We experimented with other values like 1%, 2.5% and 10% and 15%, but the results were comparable for values greater than 5% and weaker for values less than 5%. Advertisers should choose even ad rotation14 for their ads’ rotation settings. As the tool was tested exclusively with some of Google’s biggest advertisers with massive ad traffic, this simple methodology already yielded very promising results that allowed our advertisers to gain specific and highly individual insights.
Data Main Processing Phase
plugin:
3.10%
2.99%
Figure 2: Bi- and multipolar ad features with CTRs
Position Normalization
Unicode
3.0 2.8 2.6 2.4 2.2 2.0 1.8 1.6 1.4 1.2 1.0 0.8
yes Colon At End Of Description 1
Example 1: yes/no ads feature “Colon At End Of Description 1” and impact on CTRs for treatment and control group.
Data Pre-Processing Phase
XRegExp
2.9
no
There are two cases how the tool further processes the data. For bipolar ad features, i.e., yes/no ad features like “colon at end of headline”, the tool simply puts each ad in either the treatment or the control group and then calculates the average CPC and CR (if available) of both groups. For multipolar ad features, i.e., ad features that can take more than two values like “length description 1”, the tool puts each ad in exactly one of n equally sized buckets and then similarly to the first case calculates the average CPC and CR (if available) of all groups. See Figure 2 for examples of how bipolar and multipolar ad features are represented graphically when examining each group’s CTR. 12
3.0
2.6
One important aspect of the pre-processing phase is position normalization. As higher-ranked ads (i.e., ads with a higher average position) may typically earn better CTRs, we normalize CTRs to compensate for performance differences resulting from ad position. The exact details of this step are Google-internal, but—as a rough estimate—the reader can assume a specific factor that is applied for each ad position configuration.
4.4
3.1
2.7
Most of the ad feature processing is based on regular expressions. We make heavy use of the Unicode plugin12 for the XRegExp13 JavaScript library, both created by Steven Levithan. These regular expressions necessarily get very complex, as, for example, in order to recognize prices, we capture all globally known currency symbols like $ or € (and many more) as well as standard ISO 4217 currency codes like USD or EUR (and equally many more), together with different local ordering conventions (currency before or after the price, with or without space), local number formatting conventions (for both integers and floats), and finally taking care of the fact that some languages (like Chinese) do not separate characters with spaces.
4.3
3.2
2.8
As outlined in Subsection 1.2 and Subsection 1.3, the report fields clicks, impressions, and conversions allow us to calculate the CTR and CR of each ad.
4.2
3.26%
Click Through Rate (%)
Id Unique ID of ads Headline Headline of ads Description1 Description 1 of ads Description2 Description 2 of ads DisplayURL Display URL of ads CreativeDestinationURL Destination URL of ads Impressions Impressions of ads during given date range Clicks Clicks of ads during given date range AveragePosition Average position of ads during given date range Conversions Conversions of ads during given date range CampaignStatus Only consider enabled campaigns AdGroupStatus Only consider enabled ad groups Status Only consider enabled ads AdType Only consider text ads
Click Through Rate (%)
– – – – – – – – –
14
XRegExp library: http://xregexp.com/
Ad rotation settings:
adwords/answer/112876
1302
https://support.google.com/
Price—no (+0.403pp) Brand Reference—no (+0.389pp) Question Mark At End—no (+0.332pp) Length—35 (+0.341pp) Length—30 (+0.332pp) Brand Reference—yes (+0.167pp) Period At End—yes (+0.104pp) Exclamation Mark At End—no (+0.403pp) Length—35 (+0.185pp) Period At End—yes (+0.129pp)
recipe kit food delivery service. “The client was extremely surprised by the range of the data and has implemented it in their own ad builder tool to create better CTR and therefore more revenue”—their Google sales representative. “This can challenge what we thought was true”—Global car rental company. “They absolutely loved the report and want it for another account! This was a huge win since the agency never seems excited about anything! This project is saving the agency a ton of time since they were currently trying to do a similar analysis in house, but were having trouble figuring out how to do it”—Google sales representative for international airline. “[Customer] gained much efficiency by allowing the reports’ results to impact their A/B testing”—Google sales representative for global accommodation rental website. “[Customer] currently spends about $1.6M per quarter and would like to follow a position 1 strategy, but can’t because their CTR isn’t competitive. They blame their ads, but until now there was no way to deliver best practices”—Google
Price—no (+0.403pp) Brand Reference—yes (+0.195pp) Brand References Count—1 (+0.195pp)
Figure 3: Accumulated best practice recommendations for an advertiser for headline (1st line), display URL (2nd line), description 1 and description 2 (3rd and 4th line) and the overall ad (5th line)
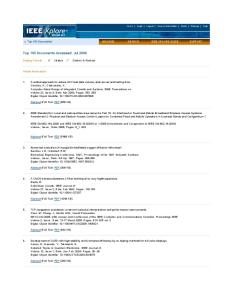
the different examined ad features from Section 3 are ordered by decreasing order of impact based on the differences in CTR or CR measured in percentage points (pp) from the winning group or bucket to the next best group or bucket, according to the methodology outlined in Subsection 4.4. Each time, we also include overall best and worst practice recommendations on a general level, i.e., things advertisers should do or avoid in each part of their ads. Figure 3 shows an example of best practices for an advertiser. In continuation, the tool generates sections for each ad feature for that statistically significant data was detected and shows each time clicks, impressions, and CTR or clicks, conversions, and CR respectively, together with a random set of ads that show the ad feature. Figure 4 shows exemplary output for a test account. While due to the sensitive nature of the involved advertiser data we cannot share real examples, with http://bit.ly/adalyze-report and http://bit.ly/adalyze-slides we share an actual pitch deck and full report (with real, however, statistically nonsignificant data due to low traffic) for one of our test accounts that were fully generated by the AdAlyze Redux tool.
4.8
sales representative for German price comparison website.
5.2
While the full details of the actual impact cannot be disclosed and vary for each advertiser, we can tell that the tool in all cases has had a positive impact on the CTR and— where conversions are being tracked—the CR. Advertisers tend to take the recommendations of the tool into account when they create new ads or tweak existing ones. Especially straight-forward things like punctuation-related recommendations quickly make their way into ads. Every customer also was eager to follow hints regarding their brands or slogans that for the latter were tested as custom ad features. Other aspects like display URL path recommendations are perceived as more disruptive and in general get tried out on a smaller subset of ads. More complex things that require investments on the technical side like ad parameters or ad customizers tend to get touched the least frequently. We will iteratively run the analyses again over the next months to see long-term trends and cater for seasonality effects.
Interaction Tracking
A critical aspect of analyses of customer data generated by tools like AdAlyze Redux is tracking their impact and attributing (hopefully) increased revenue back to the tool. Delivering the results in HTML—despite the advantages listed in Subsection 4.7—also allows us to embed rich user tracking using the Web analytics framework Google Analytics.15 By implementing the measurement protocol16 directly, this even works for static files as is the case with the full report and the pitch deck. This allows us to see what customer has looked at what version of the document (full report or pitch deck) for which of their accounts for how long, when, etc.
5.
6.
EVALUATION
Customer Satisfaction
The feedback for the tool was throughout positive. In the following, we list actual quotes from customers and Google sales representatives. “This is a very helpful tool and especially the clear statistical advantages for each attribute helped us a lot in understanding what works best for our ads”—international 15 16
FUTURE WORK AND CONCLUSIONS
Future work will mainly tackle the addition of even more ad features. Ad texts are very short and yet can be incredibly rich and expressive. Through natural language processing tasks like part-of-speech tagging or named entity recognition new insights are possible, especially when we recall that we operate in a language-independent environment of global, multilingual advertisement campaigns. We want to add language detection to the processing chain, so that advertisers do not have to separate their advertisements into different languages. In the mid-term, we want to make ad quality a more visible area of optimization for advertisers, who, in some cases and especially in certain verticals like Retail or Travel, tend to put massive effort into their keyword base (long-tail), but then often neglect their ad copies. More of a long-term objective is the automatic creation of ads based on existing samples. While ad customizers (see Section 3) are a great feature for template-like, similarly structured ads, truly creative ads oftentimes contain the unexpected that no one else bidding on the keyword has thought of. Summarizing, in this paper we have introduced our ads quality testing tool AdAlyze Redux. We have presented the examined ad features and looked at related work. Further, we have described the tool’s implementation details, its statistical constraints, the result presentation, and the tool’s
The AdAlyze Redux tool has been in Google-internal use for about a year with Google sales teams around the globe requesting individual analyses for their high-profile customers. We evaluate the tool based on customer satisfaction and its impact on CTR and CR.
5.1
Impact on CTR and CR
Google Analytics: http://www.google.com/analytics/ Google Analytics Measurement Protocol: https:
//developers.google.com/analytics/devguides/ collection/protocol/v1/reference
1303
3,008
309,114
Click Through Rate (%)
3,000 2,900 2,800 2,700 2,600 2,500 2,400 2,300 2,200 2,100 2,000 1,900 1,800
Impressions
Clicks
[#] Period At End Of Description 1 300,000 280,000 260,000 240,000
1.08% 1.07 1.06 1.05 1.04 1.03 1.02
220,000
1.01
200,000
1.00 0.99
180,000 1,791 no
166,246
yes Period At End Of Description 1
no
0.98
yes Period At End Of Description 1
0.973% no
yes Period At End Of Description 1
[#] Period At End Of Description 1—yes Based on 48 (50.0%) from Overall 96 Ads Crea tu blog hoy mismo
¿Aún no tienes favicon?
¿Aún no tienes favicon?
Crea tu favicon
54942739391
54942738671
54942739631
54942737591
thelittlecoccinelle.com/guia-blog ""Guía para dominar Blogger"". Instrucciones fáciles paso a paso.
thelittlecoccinelle.com/favicon Créalo en pocos minutos. Con un tutorial muy fácil de seguir
thelittlecoccinelle.com/favicon Créalo en pocos minutos. Con un tutorial muy fácil de seguir
thelittlecoccinelle.com/favicon De manera muy sencilla y fácil. Aprende a crearlo con tu estilo.
Impact: +0.104pp
Figure 4: Output for the ad feature “period at end of description 1” for a test account with charts for clicks, impressions, and CTR, followed by random sample ads and an impact estimation based on CTR differences tracking mechanisms. We have evaluated the tool based on customer satisfaction and regarding its impact on CTR and CR. Finally, we have provided an outlook on future work. Concluding, we have created a powerful and flexible ads quality testing tool that has become a solid pillar of a part of Google’s salesforce that deals with some of the company’s largest advertisers. Through its actionable and highly individual recommendations it helps advertisers address the problem of ads quality in a scalable and easily repeatable manner. For some advertisers, this tool was an enlightenment that challenged with hard numbers what they had believed to be true based on nothing but gut feeling. Most importantly, the tool’s results neither should be taken as the ultimate truth, but rather with a big grain of salt as something that “does waggle its eyebrows suggestively and gesture furtively while mouthing ‘look over there’.” [9].
7.
Wide Web, WWW ’08, pages 1269–1270, New York,
USA, 2008. ACM. [4] D. C. Fain and J. O. Pedersen. Sponsored Search: A Brief History. Bulletin of the American Society for Information Science and Technology, 32(2):12–13, 2006. [5] Google. HTML5 slide template for Google I/O 2012. https://code.google.com/p/io-2012-slides/. [6] Google. Creative That Clicks, Optimizing Search Ad Copy to Increase Relevance, SEM Best Practices Series. White Paper, 2014. http://services.google.com/fh/files/misc/ google-creative-that-clicks.pdf.
[7] B. J. Jansen. Examining Searcher Perceptions of and Interactions with Sponsored Results. In In Proceedings of the Workshop on Sponsored Search Auctions, 2005. [8] D. Lambert and D. Pregibon. More Bang for Their Bucks: Assessing New Features for Online Advertisers. In Proceedings of the 1st International Workshop on Data Mining and Audience Intelligence for Advertising, ADKDD, pages 7–15, New York, USA, 2007. ACM. [9] R. Munroe. xkcd: Correlation, Mar. 2009. http://xkcd.com/552/. [10] M. Richardson, E. Dominowska, and R. Ragno. Predicting Clicks: Estimating the Click-through Rate for New Ads. In Proceedings of the 16th International Conference on World Wide Web, WWW ’07, pages 521–530, New York, USA, 2007. ACM. [11] D. Sculley, R. G. Malkin, S. Basu, and R. J. Bayardo. Predicting Bounce Rates in Sponsored Search Advertisements. In Proceedings of the 15th ACM
ACKNOWLEDGEMENTS
We thank S. Fix-B¨ ahre, R. Tieben, J. Bock, J. Winterberg T. Kugler, and M. Loose for their work on an earlier version of the tool when it was just called AdAlyze (without the post-positive Redux). We also thank all Google sales representatives who helped with the tests. Finally, we thank L. Torrent Puig from the blog TheLittleCoccinelle.com for letting us use her site’s AdWords data in the sample reports.
8.
REFERENCES
[1] M. Bostock. D3.js, 2014. http://d3js.org/. [2] G. Buscher, S. T. Dumais, and E. Cutrell. The Good, the Bad, and the Random: An Eye-tracking Study of Ad Quality in Web Search. In Proceedings of the 33rd
SIGKDD International Conference on Knowledge Discovery and Data Mining, KDD ’09, pages 1325–1334,
New York, USA, 2009. ACM. [12] B. Shaparenko, O. Cetin, ¸ and R. Iyer. Data-driven Text Features for Sponsored Search Click Prediction. In Proceedings of the 3rd International Workshop on Data Mining and Audience Intelligence for Advertising, ADKDD, pages 46–54, New York, USA, 2009. ACM.
International ACM SIGIR Conference on Research and Development in Information Retrieval, SIGIR ’10, pages
42–49, New York, USA, 2010. ACM. [3] E. Dominowska and V. Josifovski. First Workshop on Targeting and Ranking for Online Advertising. In Proceedings of the 17th International Conference on World
1304