Exp Brain Res (2004) 156: 1–10 DOI 10.1007/s00221-003-1759-z
RESEARCH ARTICLES
N. Smyrnis . E. Kattoulas . I. Evdokimidis . N. C. Stefanis . D. Avramopoulos . G. Pantes . C. Theleritis . C. N. Stefanis
Active eye fixation performance in 940 young men: effects of IQ, schizotypy, anxiety and depression Received: 28 May 2003 / Accepted: 2 October 2003 / Published online: 19 December 2003 # Springer-Verlag 2003
Abstract A total of 940 young men performed a task in which they actively maintained fixation for 50 s in three conditions: a) on a visual target, b) on a visual target while distracting targets appeared briefly on the periphery and c) with no visual target present. The same individuals completed psychometric evaluation tests measuring IQ, schizotypy and current state-dependent psychopathology. The proportion of fixation time decreased and saccade frequency increased in condition b compared wih condition a, and sequentially in condition c compared with condition b. A trend towards a decrease in proportion of fixation time and increase in saccade frequency was found as the subjects maintained fixation during the task and this time-dependent deterioration of performance was again most pronounced in condition c, less so in condition b and absent in condition a. Psychometric test scores were significantly correlated with fixation performance in the population. Worse performance in all three fixation conditions was observed for individuals with lower IQ scores. A deterioration of fixation performance with time in condition b was correlated with disorganization characteristics of schizotypy, suggesting that these individuals had difficulty maintaining active fixation in the N. Smyrnis (*) Psychiatry Department, National University of Athens, Aeginition Hospital, 72 Vas. Sofias Ave., 11528 Athens, Greece e-mail:
[email protected] Tel.: +30-1-7293244 Fax: +30-1-7216424 N. Smyrnis . N. C. Stefanis . D. Avramopoulos . C. N. Stefanis University Mental Health Research Institute, National University of Athens, Athens, Greece e-mail:
[email protected] N. Smyrnis . E. Kattoulas . I. Evdokimidis . G. Pantes . C. Theleritis Cognition & Action Group, Neurology and Psychiatry Department, National University of Athens, Athens, Greece
presence of increased inhibitory load. A connection of such a difficulty with the frontal lobes and their role in the control of voluntary inhibitory functions is discussed. Keywords Ocular fixation . No-target fixation . General IQ . Sustained attention . Saccade inhibition . Schizotypy
Introduction Saccadic eye movements are used to bring the foveal area of high visual acuity on a visual stimulus, and then ocular fixation is used to hold the stimulus for image processing. During that time, saccade suppression is engaged to inhibit reflexive saccades. Saccade generation and saccade suppression are thought to involve a complex neural network that matures after the first few months of life (Johnson 1990). This neural network includes a large number of brain structures, extending from cerebral cortex to the pons. Neurons of the superior colliculus (SC) and their inter-connections are a key element of this network (Munoz and Istvan 1998). Neuronal recordings in cats and monkeys have shown that neurons in the caudal pole of the SC discharge when saccades are executed (Wurtz and Goldberg 1971, 1972). Moving rostrally on the SC, neurons discharge during active fixation and are inhibited during saccadic eye movements (Munoz and Wurtz 1993a, b). The existence of these “fixation” neurons in the superior colliculus signifies the importance of subcortical structures in the maintenance of active fixation. Although subcortical structures play a crucial role in fixation, other brain areas are also involved in the active process of maintaining fixation. One particular area of importance in the process of inhibiting saccades and maintaining fixation is the frontal lobe and in particular the dorsolateral prefrontal cortex (area 46). It has been proposed that this area acts as a “supervisory” area, which actively inhibits unwanted reflexive saccades when maintenance of fixation is required (Gooding 1999). In a recent study Pierrot-Deseilligny et al. (2003) showed that patients with lesions restricted to the dorsolateral prefron-
2
tal cortex showed a specific impairment in inhibiting unwanted reflexive saccades in the antisaccade task (a condition where subjects have to saccade in the opposite direction from that of a presented visual stimulus) and in maintaining the spatial coordinates of the target for a memorized saccade. Fixation in the absence of a visual stimulus was studied in the monkey SC. When the animals fixated a visual stimulus, the activity of rostral pole fixation neurons increased, indicating a retinal input that drives the neuronal activity. This activity decreased when this signal disappeared but maintained a level of tonic discharge, indicating the presence of an additional extra-retinal input that drives these neurons (Munoz and Wurtz 1993a). Thus, fixation with no visual stimulus might involve the same final pathway as visual fixation, namely the SC and a separate pathway related to the extra-retinal input to the SC. This extraretinal signal could be derived from other cortical areas that could maintain a “mental” representation of the fixation point. These areas could include the posterior parietal and prefrontal cortices that are known to participate in spatial memory processing (Goldman-Rakic 1988). The active fixation task has been proposed to measure “fixation instability” in schizophrenic patients. More specifically, it has been suggested that these patients have a deficit in suppressing unwanted saccades compared with healthy subjects in an active visual fixation task (Mialet and Pichot 1981; Amador et al. 1991, 1995) or in an active fixation task with increased inhibitory load, for example by adding distracting targets (Fukushima et al. 1990; Paus 1991; Curtis et al. 2001). Others have challenged these findings and proposed that the “gazeholding” apparatus functions normally in schizophrenics (Clementz et al. 1994; Kissler and Clementz 1998; Gooding et al. 2000). In one study of oculomotor functioning in individuals with schizophrenia spectrum personality disorders, it was reported that individuals with schizotypal, schizoid or paranoid personality disorders did not differ from controls in their ability to suppress saccades in a visual fixation task and in a task of fixation with no visual stimulus (Thaker et al. 1996). In a recent study Gooding et al. (2000) investigated the smooth eye pursuit and active visual fixation performance in psychosis-prone individuals identified with self-reported questionnaires that measured perceptual aberration, magical ideation and social anhedonia. These features are key elements of the schizotypal personality disorder. The authors found specific deficits in smooth pursuit in accordance with previous findings but no difference in fixation performance for these individuals compared with normal controls. In summary, at present there is no conclusive evidence for or against a dysfunction of the fixation system in schizophrenia spectrum disorders. For the purposes of a prospective study on psychosis proneness (Athens Study of Psychosis Proneness and Incidence of Schizophrenia, ASPIS), a battery of oculomotor tasks was administered along with different cognitive tests to a large sample of healthy young men in the
Greek Air Force. These tasks where chosen to investigate their role as predictors of proneness of schizophrenia spectrum disorders. In this report we present population data on the performance of active fixation in three conditions: visual fixation, visual fixation with the appearance of distracting targets (condition of increased inhibitory load) and fixation with no visual target present (probably requiring a memorized target location). Correlations of the performance in the fixation conditions with IQ, schizotypy and current state-dependent psychopathology are presented.
Materials and methods Participants and materials A sample of 2,130 young male subjects aged 18–24 years were recruited from the Greek Air Force. Of these, 2,075 individuals (97.4% of those approached) agreed to participate in the study after giving written informed consent. Each subject performed eyemovement tasks (smooth eye-pursuit, saccade, antisaccade, active fixation) and cognitive tasks (continuous performance task (CPTIP), verbal N-back test, spatial N-back test). We also administered 1,657 of these subjects (80% of participants) a battery of self-rated questionnaires assessing among other variables: a) the general IQ with the Raven progressive matrices test; b) schizotypy with the Perceptual Aberration Scale (PAS, Chapman et al. 1978) and the Schizotypal Personality Questionnaire (SPQ, Raine 1991); c) current psychopathology with the Symptom Checklist 90 revised scale (SCL90-R, Derogatis et al. 1974) translated and standardized in the Greek population (Ntonias et al. 1990); and d) personality characteristics with the Temperament and Character Inventory, revised scale (TCI-140-R, Cloninger et al. 1993). Confirmatory factor analysis revealed that a four-dimensional model of SPQ best fitted the observed data (Stefanis et al. 2003). The first factor loaded on the subscales of odd beliefs and odd perceptual experiences (F cognitive-perceptual, cog-per). The second factor loaded on suspiciousness, social anxiety, no close friends and constricted affect (F negative). The third factor loaded on odd behavior and odd speech (F disorganization) and the fourth factor loaded on social anxiety, suspiciousness and ideas of reference (F paranoid). A follow-up phase was initiated for all participants to record those that were admitted in the Neurology or Psychiatry services of the Air Force General Hospital during service time. During this phase of the study, 43 subjects with a neurological or psychiatric disorder were identified. Most of these individuals had a diagnosis before entering the service but they did not report it during the initial medical assessment of conscripts entering military service. This assessment is a standard interview-based procedure performed by a team of medical doctors of all specialties (military personnel). Among the 43, seven subjects were diagnosed with psychosis. These 43 individuals were not excluded from the population data set in the presentation that follows but their exclusion did not change any of the findings. The four validity items of the TCI-R questionnaire were used to exclude 307 subjects (18.53% of the 1,657) that responded incorrectly in at least one of these items, thus ensuring the collaboration of the responders in these self-report scales. These items were of the type “please answer this question by ticking box 4“ and a wrong answer would indicate that the individual was responding at random. A subtotal of 940 subjects (69.6% of the 1,350) completed the psychometric evaluation battery and complied with the criteria for successful performance of all three fixation conditions (see below for definition of these criteria). The analyses were performed on this subpopulation of valid responders (mean age = 20.9 years, SD = 1.9 years).
3 Apparatus
Indices of performance
The apparatus for eye movement recordings has been previously described in detail (Evdokimidis et al. 2002; Smyrnis et al. 2002, 2003). Briefly, we used PC’s for presenting stimuli and measuring the performance in the oculomotor tasks for five subjects simultaneously. The subject’s eye movements were recorded from the right eye only using the IRIS SCALAR infrared device. A 12-bit A/D converter was used for data acquisition (Advantech PC-lab Card 818L). The data were sampled at 600 Hz and stored in the PC hard disk for off-line data processing.
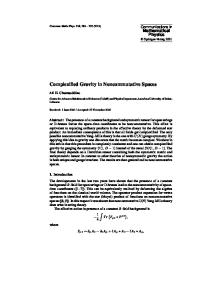
An interactive PC program (created using the Test-Point CEC Software) was used for analyzing the eye movement records. The program marked all saccades and eye blinks (Fig. 1). For detecting saccades the program used the following procedure. The first derivative of the position record was used to calculate the instantaneous velocity curve. This curve in turn was used to detect the onset of saccadic eye movements using the criterion that a number of five consecutive velocity values (8-ms duration at 600 Hz) were above a predefined noise level (the noise level was determined by taking the root mean square of the signal in 15 windows of 20 values each, covering the first 500 ms of the 1–2 s period of central fixation and then taking the median value of these 15 values). The end of the saccade was the return of the instantaneous velocity to the noise level. A criterion of change of velocity sign was used to detect eye blinks (that present as increases of velocity in one direction followed immediately by increases in the opposite direction). Finally, the program marked saccadic eye movements and blinks on the eye position record for inspection by a human observer. The blinks and artifacts were subtracted from the period of 50 s and the remainder time was the total time in the task. The program then calculated for each fixation condition record the following indices:
Procedure For each subject, three different fixation conditions of 50-s duration each were presented (in a random order for each individual). In the first condition (visual fixation undistracted) subjects were instructed to simply fixate a visual target on the center of the computer monitor (white cross 0.3×0.3 deg). In the second condition (visual fixation distracted) subjects were asked to fixate again a central target and ignore targets that might appear to the right or the left. For each trial we used four distracting targets (two small, 0.3×0.3 deg white crosses and two large, 1×1 deg white crosses), each presented for a duration of 500 ms at random intervals during the 50-s fixation period. The distracting targets could appear at a random distance of 2–9 deg and a random direction of left or right from the center. Finally, in the third condition (no target fixation) subjects were asked to keep their eyes fixating in the primary position (straight ahead) and avoid making eye movements. Before each active fixation task, a calibration procedure was performed that consisted of saccadic movements at targets located 10 and 5 deg to the right and left of a central fixation target.
Fig. 1A–C This figure presents the eye movement records of one subject in the three fixation conditions (A undistracted visual fixation, B distracted visual fixation, C no target fixation). The left side of the figure presents the traces for the whole task duration (50 s). The column in the middle presents magnified traces of the shaded area of 2 s. The upper right trace shows no eye movements for the undistracted fixation condition, the middle trace of distracted
A. Proportion of fixation time: the fixation time in the task was defined as: fixation time = total time−time spent in saccadic eye movements. The fixation time was divided by the total time to give the proportion of fixation time (a value of 1 indicates that the subject made no saccades and a value of 0 indicates that all time in the task was spent in saccades). A cutoff of 0.5 deg was used to include a record deflection as a saccadic eye movement, thus avoiding very small movements that were at the limits of the sensitivity of the measuring system. B. Frequency of saccades: the number of saccadic eye movements that were larger than 0.5 deg was divided by the total time in the task to give the saccade frequency (saccades per second). C. Fixation time modulation: this index measures the difference in the proportion of fixation time between the last 10 s and the first
fixation shows an eye blink and one saccade, and the lower trace of no target fixation shows three saccades in this period of 2 s. The right side figure (within the box) presents a magnification of the area in the box of the middle trace in row B. In this figure the position and velocity traces for one saccade are shown and the two vertical lines mark the onset and the end of the saccadic eye movement (see methods for definition of these two landmarks)
4 was compared with the remaining population using an analysis of covariance (ANCOVA) to control for the following variables: age, Raven test raw score, anxiety and depression. Due to the large number of separate analyses of variance, we used a conservative criterion of P<0.01 to reduce the probability of false positive results. All statistical analyses were performed using STATISTICA software (StatSoft, 1999).
10 s of task duration divided by the sum of these two proportions: (proportion of fixation time in last 10 s − proportion of fixation time in first 10 s) / (proportion of fixation time in last 10 s + proportion of fixation time in first 10 s). Negative values indicate a decrease in fixation time with time and positive values indicate an increase in fixation time with time. D. Saccade frequency modulation: this index measures the difference in saccade frequency (number of saccades per second) between the last 10 s and the first 10 s of task duration divided by the sum of these two frequencies: (saccade frequency in last 10 s − saccade frequency in first 10 s) / (saccade frequency in first 10 s + saccade frequency in last 10 s). Positive values indicate an increase in saccade frequency with time and negative values indicate a decrease in saccade frequency with time.
Results Population performance in the three fixation conditions The means and standard deviations for each one of the four fixation indices for each fixation condition are presented in Table 1. Significant differences among the three fixation conditions were observed using one-way ANOVA for proportion of fixation time (F(2,939)=61.8, P<0.0001), frequency of saccades (F(2,939)=107.5, P<0.0001), modulation of fixation time (F(2,939)=18.2, P<0.0001) and modulation of saccade frequency (F(2,939)=19.8, P<0.0001). Post-hoc comparisons of means confirmed that in the no target condition subjects had a significantly lower proportion of fixation time and higher saccade frequency than those observed in the undistracted (Tukey test, P<0.0001 for both comparisons) and distracted (Tukey test, P<0.0001 for both comparisons) visual fixation conditions. Also, the proportion of fixation time was significantly lower and the saccade frequency significantly higher in the distracted visual fixation condition compared with the undistracted visual fixation condition (Tukey test, P<0.0001 for both comparisons). Thus, fixation performance became worse in the distracted visual fixation compared with the simple undistracted fixation and was worst in the most demanding condition of fixation with no target. Figure 2A plots the mean proportion of fixation time for all subjects pooled together for the three fixation conditions. It can be seen that the proportion of fixation time decreases over time and this effect is most pronounced in the no target condition, less so in the distracted visual fixation condition and almost absent in the undistracted visual fixation condition. These effects of task progression were confirmed by the significant difference in the modulation of fixation time observed in the three conditions. Thus the modulation of fixation time was more negative in the no target task (−0.006) than in
Statistical analysis One-way analysis of variance was used to assess the condition effect on the four fixation indices. In order to analyze the data set as a whole and address the question of the relation between the psychometric variables on the one hand (Raven IQ, PAS, SPQ scores, SCL90 anxiety and depression scores) and the fixation performance indices on the other, we used a multivariate analysis, namely canonical correlation analysis. This analysis allows the comparison of two sets of correlated variables by comparing a weighted sum of the first set (a linear combination of the variables) with a weighted sum of the second set. Thus, from the original two sets of variables the analysis derives two weighted sums that are maximally correlated between them. These weighted sums are called canonical variates and the squared correlation of them is called canonical root. The process of canonical correlation analysis goes on to define more than one canonical root that can describe a complex relation between the two data sets. Each new root will explain an additional proportion of variance between the two sets that will be smaller and smaller with each new root. Actually the program computed as many roots as the number of variables in the first set of variables (defined arbitrarily). The significance of each new root is tested and only the significant roots are retained and interpreted. The meaning of each root is then evaluated by computing the canonical weights for each variable of each one of the two sets. In general, the larger the absolute value of the weight is, the larger the specific contribution of this variable to the root, and thus the larger the contribution of this variable to the inter-correlation of the two sets of variables. In our analysis these canonical weights are presented as z scores with a mean of zero and variance of one. Finally, a forward stepwise linear regression model analysis with an F to enter equal to 1 was used to assess the specific effects of the most important psychometric indices, as these were evaluated from their canonical weights (the indices with the highest canonical weights in absolute values) in the previous analysis on each of the most important fixation indices that were also selected based on their canonical weights in the canonical analysis. A high schizotypy group analysis was also performed. A cutoff point of 2 standard deviations above the population mean was used to form a high PAS score group (N=54 individuals), a high SPQ score group (N=27 individuals) and four high SPQ factor groups. Each group’s performance on each one of the 12 fixation indices Table 1 Fixation indices Task Visual fixation undistracted Visual fixation distracted No target fixation
Fix Tm 0.987 (0.016) 0.983 (0.018) 0.978 (0.021)
Sac Fr 0.282 (0.321) 0.380 (0.344) 0.516 (0.375)
Modfix −0.001 (0.015) −0.003 (0.018) −0.006 (0.018)
Modsac 0.069 (0.615) 0.149 (0.576) 0.231 (0.478)
Means and standard deviations in parentheses for all fixation indices in the three fixation conditions. Fix Tm proportion of fixation time, Sac Fr Saccade frequency, Modfix modulation of fixation time, Modsac modulation of saccade frequency
5
the distracted (−0.004) and undistracted (−0.001) visual fixation tasks (Tukey tests, P=0.001 and P<0.0001, respectively), indicating a larger decrease in proportion of fixation time as the no target condition task progressed in time (see methods). Also, the modulation of fixation time was more negative in the distracted fixation condition than the undistracted condition (Tukey test, P=0.03), indicating again a larger decrease in proportion of fixation time as the distracted condition task progressed in time. Figure 2B plots the saccade frequency as the task progressed in time for all subjects pooled together for the three fixation conditions. It can be seen that the saccade frequency increases over time and this effect is most pronounced in the no target condition, less so in the distracted visual fixation condition, and almost absent in the undistracted visual fixation condition. These effects of task progression were also confirmed by the significant difference in the modulation of saccade frequency observed in the three conditions. Thus, the modulation of saccade frequency was more positive in the no target condition (0.516) than in the distracted (0.380) and undistracted (0.282) visual fixation conditions (Tukey test, P=0.004 and P<0.0001, respectively), indicating a larger increase in saccade frequency as the no target condition task progressed in time (see methods). Also, the modulation of saccade frequency was more positive in the distracted fixation condition than the undistracted condition (Tukey test, P=0.005), indicating again a larger
increase in saccade frequency as the distracted condition task progressed in time. The analysis on fixation indices was also performed on the total sample of individuals without excluding the nonvalid responders in the validity items of the TCI140 questionnaire (N=307 subjects) and the results were almost identical. In conclusion, the population performance in the three fixation conditions was different. The subjects performed worst in the no target fixation condition, producing the largest numbers of unwanted saccades and maintaining fixation for a smaller proportion of task time. Also, there was a trend towards worse performance as task time progressed. The best performance was observed in the undistracted visual fixation condition where, also, there was no worsening of performance with time. The performance in the distracted fixation condition was intermediate between the no target and the undistracted visual fixation conditions. Effects of IQ, schizotypy, anxiety and depression Table 2 presents the correlation matrix for correlations among the psychometric indices. It can be seen that all these indices were inter-correlated and the highest correlations, as expected, were among the different schizotypy indices. The PAS scores in particular were correlated with the cognitive perceptual factor scores of the SPQ more than with the other factors, as expected. Also, anxiety and depression measures were highly intercorrelated. The canonical analysis showed a significant intercorrelation between the psychometric and the fixation indices of performance (Canonical R=0.24, X2(96)=142.4, P<0.01). The analysis of the significance of successive canonical roots confirmed that only the first root was significant, explaining all common variance between the two sets of variables. Table 3 presents the canonical Table 2 Correlations among psychometric indices PAS SPQ Cog Neg Dis PAS SPQ Cog Neg Dis Par Scl Anx Scl Dep
Fig. 2. A presents the proportion of fixation time (fixation time / (fixation time + time spent in saccades)) for each second of the task duration (50 s) averaged across all subjects. B presents the frequency of saccades for each second of the task duration averaged across all subjects (thin line: undistracted visual fixation, thick line: distracted visual fixation, dotted line: no target fixation)
0.65 0.72 0.48 0.61 0.52 0.36 0.34
0.84 0.79 0.96 0.83 0.45 0.46
0.49 0.80 0.78 0.42 0.41
0.72 0.41 0.32 0.35
Par
Scl Anx Scl Dep
0.81 0.42 0.38 0.43 0.39 0.76
-
Correlation matrix for the correlation among different schizotypy indices and their correlation with current state anxiety and depression. PAS perceptual aberration scale, SPQ schizotypy Personality Questionnaire total score, Cog cognitive perceptual factor of SPQ, Neg negative factor of SPQ, Dis disorganized factor of SPQ, Par paranoid factor of SPQ, Scl Anx SCL90R anxiety scale, Scl Dep SCL90R depression scale
6
weights for each variable for the set of fixation indices (right) and the set of psychometric indices (left). The highest contributing variables are marked with boldface. It can be observed that the distracted fixation condition had the largest number of significant contributing indices (three indices out of four) while the contribution of the other two tasks was smaller (two indices from the undistracted visual fixation task and one index from the no target fixation task). Also, regarding the psychometric variables, the IQ and the SPQ factors were the variables with the highest contribution to the correlation with the fixation indices of performance. The next step in our analysis was to test how well the set of the significant psychometric variables as identified in the canonical analysis (marked with boldface in Table 3) could predict the variation for each of the significant fixation indices (marked with boldface in Table 3). We thus performed six stepwise linear regressions for the five fixation indices of interest using the IQ score and the four SPQ factor variables as the independent factors. The results are shown in Table 4. The regression betas are shown only when the analysis of variance for the regression was significant and the model r2 was above 0.01, indicating that a subset of independent variables were indeed significant predictors of the particular fixation index and they explained at least 1% of the fixation index variance. Thus, for the undistracted visual fixation task only one regression model was significant. The IQ score was a significant predictor of the modulation of saccade frequency. Subjects with a lower IQ showed a larger increase
Table 3 Canonical weights Fixation Indices UVF Fix Tm UVF Sac Fr UVF Modfix UVF Modsac DVF Fix Tm DVF Sac Fr DVF Modfix DVF Modsac NTF Fix Tm NTF Sac Fr NTF Modfix NTF Modsac
Weights −0.07 −0.43 0.13 0.59 −0.41 −0.68 0.06 −0.48 0.05 0.86 −0.26 −0.03
Psychometric Indices IQ PAS Cog Neg Dis Par Scl Anx Scl Dep -
Weights −0.73 −0.11 0.78 0.42 −0.79 −0.43 −0.15 −0.10 -
Canonical weights for the two sets of fixation indices and psychometric scores, using the first root in the canonical analysis (see results). UVF undistracted visual fixation, DVF distracted visual fixation, NTF no target fixation, Fix Tm proportion of fixation time, Sac Fr Saccade frequency, Modsac modulation of saccade frequency, IQ Raven tast score,PAS perceptual aberration scale, Cog cognitive perceptual factor of schizotypy personality questionnaire (SPQ), Neg negative factor of SPQ, Dis disorganized factor of SPQ, Par paranoid factor of SPQ, Scl Anx SCL90R anxiety scale, Scl Dep SCL90R depression scale
Table 4 Regression models for fixation performance indices Rg. F
Rg r2
IQ
Undistracted Visual Fixation Sac Fr ns 0.001 Modsac 13** 0.013 Distracted Visual Fixation Fix Tm 3.6** 0.015 0.1 Sac Fr ns 0.006 Modsac 3.23* 0.014 ns No Target Fixation Sac Fr 3.3* 0.01 -
Cog
Neg
Dis
Par
ns
ns
ns
ns
ns −012*
ns ns
−0.17* 0.21**
ns ns
ns
ns
ns
−0.8*
Specific regression models for predicting fixation performance indices (Fix Tm proportion of fixation time, Sac Fr Saccade frequency, Modsac modulation of saccade frequency) using psychometric scores in schizotypy (Cog cognitive perceptual factor of SPQ, Neg negative factor of SPQ, Dis disorganized factor of SPQ, Par paranoid factor of SPQ) and IQ score (Raven). Rg. F F value for the ANOVA of the regression model. Rg. r2 square of the correlation coefficient for the regression model indicating the proportion of variance of the dependent variable that is explained by the independent factors in the model *significance at P<0.05,**significance at P<0.01, ns not significant at P<0.05
in the frequency of saccades as time progressed in the undistracted fixation condition. Two of the three distracted fixation condition indices were significantly predicted by the set of independent variables. The model for saccade frequency in this condition was not significant. A higher proportion of fixation time correlated with a higher IQ. Inversely, individuals with a lower proportion of fixation time scored higher on the disorganized factor of the SPQ. Finally an increase in saccade frequency with task progression was correlated with a lower score in cognitive-perceptual schizotypy (cog) and a higher score in disorganized schizotypy (dis). These results indicated that positive schizotypy and disorganized schizotypy had opposite effects on active fixation in this condition. Disorganized schizotypy resulted in more saccadic intrusions with time while positive schizotypy had an opposite effect. We further investigated these effects by performing separate analyses using the cognitive-perceptual (cog) SPQ factor or the negative factor (neg) or the disorganized (dis) SPQ factor in the regression model while excluding all other predictors. The regression model for the modulation of saccade frequency using only the cognitive-perceptual SPQ factor was non-significant (F=2.16, P=0.11). Using the disorganized factor of SPQ, the regression model for the saccade frequency modulation was significant (F=3.5, P<0.05) and the disorganized factor score was a significant predictor (beta=−0.065, t=−1.98, P<0.05). This analysis confirmed that the significant relation of schizotypy with modulation of saccade frequency is based on the increase of saccadic intrusions for individuals that score higher on the disorganized factor of schizotypy. This effect became more pronounced by excluding the effect of co variation of disorganized schizotypy with positive schizo-
7
typy. In summary, a very specific correlation of disorganized schizotypy with increasing saccadic intrusions over time was observed in the distracted visual fixation condition. Finally, in the model predicting the saccade frequency in the no target fixation condition, we observed a significant correlation with IQ. Thus, individuals with a lower IQ had a higher saccade frequency in this task. Also, we observed a significant correlation of saccade frequency with the paranoid factor of SPQ but this effect did not remain significant when we performed the regression analysis using only the paranoid factor from SPQ and excluding all other predictors. High schizotypy group analysis Table 5 shows the results of the ANCOVA analysis comparing the high PAS group (N=54) with the remaining population in all fixation indexes of performance and using as covariates the age, IQ (Raven raw score) and SCL90-R anxiety and depression scores. It can be seen that the high schizotypy group did not differ significantly from the population in any of the fixation performance indexes. The same table presents the results of the ANCOVA analysis for the high SPQ score group (N = 27). Again, no significant differences were observed in any of the fixation indices of performance. Also, no significant differences were observed when we used high schizotypy groups defined as high scores in each of the four factors of SPQ (data not shown).
Discussion In this study, the ability of apparently healthy young men to maintain active fixation and suppress saccades was tested in three different conditions: 1) with the presence of a visible fixation stimulus (undistracted condition); 2) with Table 5 Fixation performance of high schizotypy groups versus population The first three columns present the results of the ANCOVA analysis on the comparison of fixation performance (Fix Tm proportion of fixation time, Sac Fr Saccade frequency, Modfix modulation of fixation time, Modsac modulation of saccade frequency) between the high PAS group (N=54 subjects) and the remaining population using as covariates the age, IQ (Raven raw score) and SCL90-R anxiety and depression scores. The remaining three columns present the results of the same analysis using the high SPQ group (N=27 subjects)
P. mean
the presence of a fixating stimulus and the brief appearance of four peripheral distracting targets (distracted condition); and 3) without the presence of a visible fixation stimulus (no target condition). Fixation condition differences in performance We observed that fixation performance measured as proportion of fixation time and saccade frequency was worse in the no target condition, better in the distracted visual fixation condition and best in the undistracted visual fixation condition. Furthermore, the proportion of fixation time decreased and the saccade frequency increased as the fixation task progressed in time and this effect was most pronounced in the no target fixation condition, less so in the distracted visual fixation condition and absent in the undistracted visual fixation condition. It should be noted, though, that in general the performance of these young healthy adults in the fixation tasks was very good. Even in the most demanding task of fixating with no target present, the mean proportion of fixation time was 0.978, meaning that on average each subject spent 97.8% of his time maintaining active fixation (see Table 1) and performed on average one unwanted saccade every 2 s (saccade frequency 0.516). Considering that we asked our subjects to maintain fixation for almost a minute (50 s), this performance indicates that in general healthy adults are very efficient in the task of maintaining active fixation. The no target condition resulted in a significantly lower proportion of fixation time as well as higher saccade frequencies. Also, in this condition it was observed that performance deteriorated with time in the task and the difference between the final 10 s and the first 10 s was more pronounced than in the distracted visual fixation and the undistracted visual fixation conditions. These findings are in agreement with a previous experiment where it was shown that healthy adults had an increased difficulty to
High PAS
Visual fixation undistracted Fix time 0.987 Sac freq. 0.284 Mod fix −0.001 Mod sac 0.067 Visual fixation distracted Fix time 0.983 Sac freq. 0.382 Mod fix −0.003 Mod sac 0.146 No target fixation Fix time 0.978 Sac freq. 0.52 Mod fix −0.006 Mod sac 0.233
F (P)
P. mean
High SPQ
F (P)
0.986 0.231 −0.003 0.102
0.00 1.67 0.34 0.00
(0.97) (0.20) (0.55) (0.99)
0.987 0.283 −0.001 0.069
0.988 0.243 −0.002 0.079
0.11 0.63 1.85 0.00
(0.74) (0.43) (0.17) (0.97)
0.982 0.346 −0.004 0.195
0.19 2.13 0.22 0.40
(0.66) (0.15) (0.64) (0.53)
0.983 0.382 −0.003 0.150
0.984 0.311 −0.002 0.100
0.44 3.05 0.55 0.44
(0.51) (0.08) (0.46) (0.51)
0.977 0.44 −0.002 0.198
0.02 3.48 3.62 0.28
(0.90) (0.06) (0.06) (0.60)
0.978 0.519 −0.006 0.235
0.983 0.398 −0.003 0.103
1.74 3.06 1.06 2.46
(0.19) (0.08) (0.30) (0.12)
8
maintain active fixation without the presence of a visual fixation stimulus (Sansbury et al. 1973). Relation of fixation performance with IQ The canonical analysis revealed that a significant factor in the relation of fixation performance with the psychometric indices was the performance in the IQ test (Raven). Examining this relation more thoroughly, we found that in all three fixation conditions, a lower IQ score was related to worse fixation performance. In the visual fixation condition, lower IQ was correlated with an increase in saccade intrusion (increased saccade frequency during fixation) as the task progressed in time. In the no target fixation task, lower IQ was correlated with an overall increase in saccadic intrusion. Finally in the visual fixation task with distractors, lower IQ correlated with decreased time spent in fixation. This association of general IQ with active fixation performance would seem odd if one would consider the basic collicular mechanisms for fixation as these were presented in the introduction. One the other hand, if the maintenance of fixation for a long period of 50 s would be considered a more demanding task that would require the voluntary control of the saccadic system in order for the subjects to inhibit unwanted reflexive saccades during that time, then this task could involve higher order areas such as the dorsolateral prefrontal cortex (Gooding 1999). The relation then of IQ with fixation could be through higher cognitive mechanisms mediated by areas involved in executive functions such as the dorsolateral prefrontal cortex. Fixation performance and schizotypy, anxiety, depression The canonical analysis showed that the four factors of SPQ were significant in the correlation with fixation performance and the most significant factors were the positive and disorganized schizotypy. In contrast, current state symptomatology such as anxiety and depression did not have an effect on fixation performance. Examining the relation of the SPQ factors to fixation in more detail, we observed that individuals with higher disorganized schizotypy showed an increased saccadic intrusion with time only in the condition of visual fixation with distractors. It was also observed that individuals with a high score in positive schizotypy exhibited the opposite effect of decreasing saccadic intrusion with time in the same fixation condition. This opposite effect of positive schizotypy, though, did not survive when positive schizotypy was entered as a sole predication of fixation performance in the regression. Thus, we could interpret these results as showing a highly specific effect of disorganized schizotypal characteristics on the ability of subjects to maintain visual fixation in the presence of distracting stimuli over time.
In a previous study measuring fixation performance in a group of individuals with schizotypal personality characteristics and normal controls (Thaker et al. 1996), the authors reported that fixation performance in two fixation conditions, with and without a visual target present, did not discriminate among the different groups. No effect on fixation was observed even for individuals with a combination of spectrum personality disorders and a family history of schizophrenia (high genetic load). These results are in agreement with our results showing that the simple visual fixation and the no target conditions did not show a relation with schizotypy. More recently, Gooding et al. (2000) studied visual fixation in a group of schizotypes that were identified using self-reporting questionnaires (a combination of perceptual aberration, magical ideation scales and the social anhedonia scale). These authors also did not find any difference in performance between the schizotypes and normal controls. In agreement with their results, we did not find any difference in fixation performance from the population in a group of individuals with very high schizotypy as identified with the perceptual aberration scale. The differences between our study and the study of Gooding et al. (2000) were the sample size that allowed us to perform an additional parametric analysis examining the relation of schizotypy to fixation in the population, the use of two more fixation conditions and the use of the SPQ scale that can be decomposed to dimensions of schizotypy (Reynolds et al. 2000). We found evidence of a relation in the population of the disorganization dimension of schizotypy to a deterioration of fixation performance (increase in saccadic intrusions over time) only in the condition of increased inhibitory load. An interesting observation was that the canonical analysis showed a significant effect of schizotypy as measured with the SPQ dimensions on fixation performance while the group analysis did not show a significant difference in fixation performance between high schizotypy groups and the population. The SPQ questionnaire was based on the theoretical model of schizotypy as a continuum in the general population ranging from normal behavior to schizotypal characteristics with no apparent cut off points (Eysenck and Eysenck 1976). Thus, the SPQ is more amenable to a correlation analysis yielding more statistical power in detecting a significant relation of schizotypy with other variables. The other theoretical model of schizotypy ((Meehl 1989) suggests a clear dissociation of a particular group of individuals with these characteristics that does not belong to the general population. This approach is reflected in the use of questionnaires to identify a high schizotypy group and compare it with normal controls. It has been suggested that the Chapman scales (like PAS and the scales used in the Gooding et al. 2000 study) are valid tools for selecting such a particular group (Lenzenweger 1994). It could be argued then that different aspects within the general concept of schizotypy are reflected in these two types of questionnaires and these different aspects could be related to differences in the performance of specific oculomotor
9
tasks. Indeed, in a previous study we reported on antisaccade performance in the same population and observed that a group of individuals with very high scores in the PAS questionnaire (above 2SD from the population mean) had a significantly higher error rate than the population (suggesting a problem in inhibitory saccadic control) (Smyrnis et al. 2003). In the same study, the parametric analysis (canonical analysis) did not show a significant effect of schizotypy measured with PAS and the SPQ factors on antisaccade performance. The specific effect of disorganized schizotypy on fixation performance in the condition of increased inhibitory load is in agreement with previous studies of active fixation in schizophrenia (Fukushima et al. 1990; Paus 1991; Curtis et al. 2001). In particular, in the study of Curtis et al. (2001) the authors used two conditions, one of simple visual fixation and one of visual fixation in the presence of distractors. They observed that patients with schizophrenia and, to a lesser degree, their biological relatives had difficulty sustaining visual fixation only in the condition with distractors, while in the simple visual fixation condition schizophrenia patients and their relatives did not differ from controls. The authors concluded that a specific deficit in schizophrenia was the lack of inhibitory control over saccades. This inhibitory control of saccades could be related to the dorsolateral prefrontal cortical function. Our results extend these findings to schizotypes and in particular those schizotypes that have higher scores in disorganized schizotypy. Disorganization symptoms are characteristic of the deficit syndrome in schizophrenia (Carpenter et al. 1988). It is believed that this particular group of patients suffers from cognitive impairment involving, in particular, the dorsolateral prefrontal cortex (Weinberger 1988).
Conclusion We studied active fixation in a large population of healthy young men and showed that active fixation in the absence of a visual target and fixation with distracting stimuli are more demanding tasks than simple visual fixation. Worse performance in all fixation tasks was observed for individuals with lower IQ. A specific effect of schizotypy (disorganization cluster of schizotypy characteristics) was observed only in the fixation condition with distractors, indicating that saccadic inhibitory control might be specifically impaired in these individuals. Acknowledgments This work was supported by the grant “EKBAN 97” to Professor C.N. Stefanis from the General Secretariat of Research and Technology of the Greek Ministry of Development. The technical support for this project was provided by Intrasoft Co. We would like to thank the commanders in chief and the military personnel of the “124” Base for Basic Training of the Hellenic Air Force. A preliminary report on this work was presented in the Society for Neuroscience meeting 2000.
References Amador XF, Sackeim HA, Mukherjee S, Halperin R, Neeley P, Maclin E, Schnur D (1991) Specificity of smooth pursuit eye movement and visual fixation abnormalities in schizophrenia. Comparison to mania and normal controls. Schizophrenia Res 5:135–144 Amador XF, Malaspina D, Sackeim HA, Coleman EA, Kaufmann CA, Hasan A, Gorman JM (1995) Visual fixation and smooth pursuit eye movement abnormalities in patients with schizophrenia and their relatives. J Neuropsych Clin Neurosci 7:197– 206 Carpenter WT Jr, Heinrichs DW, Wagman AMI (1988) Deficit and non-deficit forms of schizophrenia: the concept. Am J Psychiatry 145:578–583 Chapman LJ, Chapman JP, Raulin ML (1978) Body image aberration in schizophrenia. J Abnorm Psychol 87:399–407 Clementz BA, McDowell JE, Zisook S (1994) Saccadic system functioning among schizophrenia patients and their first-degree biological relatives J Abnorm Psychol 103:277–287 Cloninger CR, Svrakic DM, Przybeck TR (1993) A psychobiological model of temperament and character. Arch Gen Psychiatry 50:975–990 Curtis CE, Calkins MA, Iacono WG (2001) Saccadic disinhibition in schizophrenia patients and their first-degree biological relatives. Aparametric study of the effects of increasing inhibitory load. Exp Brain Res 137:228–236 Derogatis LR, Lipman RS, Rickels K, Uhlenhuth EH, Covi, L (1974) The Hopkins Symptom Checklist (HSCL): a self-report symptom inventory. Beh Science 19:1–15 Evdokimidis I, Smyrnis N, Constantinidis TS, Stefanis NC, AvramopoulosD, Paximadis C, Theleritis C, Efstratiadis C, KastrinakisG, Stefanis CN (2002) The antisaccade task in a sample of 2,006 young males: I. Normal population characteristics. Exp Brain Res 147:45–52 Eysenck HJ, Eysenck SBG (1976) Psychoticism as a dimension of personality. Hodder & Stoughton, London Fukushima J, Fukushima K, Morita N, Yamashita I (1990) Further analysis of the control of voluntary saccadic eye movements in schizophrenic patients. Biol Psychiatry 28:943–958 Goldman-Rakic (1988) Topography of cognition:parallel distributed networks in primate association cortex. An Rev Neurosci 11:137–156 Gooding DC (1999) The role of executive control in saccade generation. Beh Brain Sci 22:686–687 Gooding DC, Grabowski JA, Henderhot CS (2000) FIxation stability in schizophrenia, bipolar, and control subjects. Psychiatry Res 97:119–128 Johnson MH (1990) Cortical maturation & development of visual attention in early infancy. J Cogn Neurosci 2:81–95 Kissler J, Clementz BA (1998) Fixation stability among schizophrenia patients. Neuropsychobiology 38:57–62 Lenzenweger MF (1994) Psychometric high-risk paradigm, perceptual aberrations and schizotypy: an update. Schizophrenia Bull 20:121–135 Mialet J, Pichot J (1981) Eye-tracking patterns in schizophrenia. An analysis based on the incidence of saccades. Arch Gen Psychiatry 38:183–186 Meehl PE (1989) Schizotaxia revisited. Arch Gen Psychiatry 46:935–944 Munoz D, Wurtz R (1993a) Fixation cells in monkey superior colliculus I.Characteristics of cell discharge. J Neurophysiol 70:559–575 Munoz D, Wurtz R (1993b) Fixation cells in monkey superior colliculus. II. Reversible activation and deactivation. J Neurophysiol 70:576–589 Munoz DP, Istvan PJ (1998) Lateral inhibitory interactions in the intermediate layers of the monkey superior colliculus. J Neurophysiol 79:1193–1209 Ntonias S, Karastergiou A, Manos N (1990) Standardization of the symptom checklist 90-R rating scale in a Greek population. Psychiatriki 2:42–48
10 Paus T (1991) Two modes of central gaze fixation maintenance and oculomotor distractibility in schizophrenics. Schizophrenia Res 5:145–152 Pierrot-Deseilligny C, Muri RM, Ploner CJ, Gaymard PB, Demeret S, Rivaud-Pechoux S (2003) Decisional role of the dorsolateral prefrontal cortex in ocular motor behavior. Brain 126:1460– 1473 Raine A (1991) The SPQ: a scale for the assessment of schizotypal personality in a non-clinical sample-the role of task demand. Schizophrenia Bull 17:555–564 Reynolds CA, Raine A, Mellingen K, Venables PH Mednick SA (2000) Three-factor model of schizotypal personality: invariance across culture, gender, religious affiliation, family adversity, and psychopathology. Schizophrenia Bull 26:603– 618 Sansbury RV, Skavenski AA, Haddad GM, Steinman RM (1973) Normal fixation of eccentric targets. J Opt Soc America 63:612–614 Smyrnis N, Evdokimidis I, Stefanis NC, Constantinidis TS, AvramopoulosD, Theleritis C, Paximadis C, Efstratiadis C, KastrinakisG, Stefanis CN (2002) The antisaccade TASK in a sample of 2006 young males: II. Effect of task parameters. Exp Brain Res 147:53–63
Smyrnis N, Evdokimidis I, Stefanis NC, Avramopoulos D, Constantinidis TS, Stavropoulos A, Stefanis CN (2003) Antisaccade performance of 1273 men: effects of schizotypy, anxiety and depression. J Abnorm Psychol 112:403–414 Stefanis NC, Smyrnis N, Avramopoulos D, Evdokimidis I, Tzoufras I, Stefanis CN (2003) Factorial composition of self rated schizotypal traits amongst young males undergoing military training. Schizophrenia Bull (in press) Thaker GK, Cassady S, Adami H, Moran M, Ross DE (1996) Eye movements in spectrum personality disorders: comparison of community subjects and relatives of schizophrenic patients. Am J Psychiatry 153:362–368 Weinberger DR (1988) Schizophrenia and the frontal lobe. Trends in Neurosci 11:367–370 Wurtz RH, Goldberg ME (1971) Superior colliculus cell responses related to eye movements in awake monkeys. Science 171:82– 84 Wurtz RH, Goldberg ME (1972) Activity of superior colliculus in behaving monkeys III. Cells discharging before eye movements. J Neurophysiol 35:575–586