Accurate Detection of Demosaicing Regularity from Output Images Hong Cao
Alex C. Kot
School of Electrical and Electronic Engineering Nanyang Technological University Singapore
[email protected]
School of Electrical and Electronic Engineering Nanyang Technological University Singapore
[email protected]
Abstract—Demosaicing regularity is an important processing regularity associated with the internal camera processing and its detection from output photos is useful for non-intrusive forensic engineering. In this paper, we propose a reverse grouping technique to improve the detection accuracy of our earlier proposed detection model based on second-order image derivatives. Comparison results based on syntactic images shows that the proposed technique significantly reduces the reprediction errors for some commonly used demosaicing algorithms. When applied to a real application, i.e. camera model identification, our demosaicing features in conjunction with probabilistic support vector machine classifier achieve excellent classification performance.
I.
INTRODUCTION
A camera is a trustworthy device and photos traditionally imply truth. Nowadays, this has been severely challenged. The advances of digital technology have given birth to numerous low-cost yet powerful tools which enable easy image creation, modification and distribution. Consequently, image forgery becomes commonplace in Internet and other mass media. This has brought up new challenges concerning authenticity and integrity of digital images. In recent years, passive image forensics has become a booming research area to mainly address photo-authentication related challenges such as image source identification, tampering discovery and steganalysis. Compared to active image forensic methods which require information hiding (e.g. watermarking and steganography), passive image forensics are based on detection of intrinsic image regularities or tell-tale artifacts leftover due to specific tampering operations. Since available digital images usually do not carry a watermark, much wider applications can be expected for passive image forensic approaches. In the past few years, past researchers have attempted to detect the image regularities in 4 categories: •
Optical regularities including illumination, lens distortion, chromatic aberrations, blurring etc., which are introduced in the optical domain;
978-1-4244-3828-0/09/$25.00 ©2009 IEEE
•
Sensor imperfections including sensor noise, dust characteristics and camera response function which are introduced when the light signals are converted to digital signals.
•
Processing regularities including demosaicing, white balancing, gamma correction, JPEG compression etc. which are introduced by the digital image processor;
•
Statistical regularities including natural image statistics and quality metrics.
Different regularities are associated with different origins and their detections are useful in different forensic applications. For instance, Johnson and Farid [1] employ an illumination model to expose lighting inconsistencies. Lucas et al. [2] extract the noise pattern caused by nonuniform sensor response to identify individual cameras. Swaminathan et al. [9] detect demosaicing regularity for nonintrusive forensic analysis of different camera models. Several other works [3-4] compute statistical features to classify photos and computer graphic images and to identify stego-images. The forensic performance depends on both the regularity type and goodness of the detection model. In this paper, we consider detection of demosaicing regularities for nonintrusive image forensic engineering. Fig. 1(a) shows a typical camera processing pipeline for singlesensor digital still cameras (DSCs). As both charge-coupled device (CCD) and CMOS sensors can only sense luminance, color filtering and demosaicing are the common steps in digital still cameras (DSC) to cost-effectively produce color. In color filtering, a color filter array (CFA) is used to remove the unwanted colors so that specific colors can be measured at each pixel. Spatial arrangement of these color filters depends on the CFA pattern and Bayer patterns in Fig. 1(b) and (c) are the most dominantly adopted CFAs [5]. As a result of color filtering, only one color is sampled at each pixel and two missing colors per pixel are populated through demosaicing. The demosaiced image may further go through processes like color calibration, edge enhancement, gamma correction, colorspace transformation and JPEG compression [12].
497
Since large number of demosaicing techniques are available and each method introduces unique correlation among neighboring pixels. Detection of such correlation is useful for image forensic applications. Several early works [68, 10] employ a simple intra-channel correlation model with an underlying assumption that each pixel is equally correlated with their neighboring pixels. Swaminathan et al. [9] propose an improved method, which heuristically divides the image into 3 regions based on edge characteristics. For each region, demosaicing regularity is separately estimated with the assumption that missing samples in each region are demosaiced with the same formula. This method also detects the applied CFA pattern and estimates the underlying demosaicing formulas. However, all above methods focus only on correlation within each color channel while state-ofart demosaicing algorithms frequently utilize cross-channel information to achieve better image quality. Our previous work [11] has demonstrated that demosaicing regularity can be better detected based on second-order image derivatives because both cross-channel and intra-channel correlation can be detected. In this paper, we further improve this detection model via a refined reverse grouping technique. A comparison with previous methods shows significant improvement in the detection accuracy.
the missing samples based on color channel and their relative position in 2×2 periodical CFA lattice in Fig. 1(b) and (c). Traditionally, bilinear and Bicubic are popular due to their simplicity in hardware implementation and low computational cost. However, these methods cause unpleasant blurring across the edges. Therefore, numerous edge-adaptive methods are proposed and demosaicing is along a direction where the content varies the slowest. These edge-adaptive methods are equivalent to advanced grouping strategies where missing samples are further divided according to the edge direction. After grouping, a demosaicing algorithm usually adopts the same reconstructive filter to demosaic the missing samples in one group. This reconstructive process can be carried out in various domains, e.g. spatial domain within each color channel, color difference domain and color ratio (or hue) domain. After the missing samples are fully populated, sophisticated demosaicing algorithms usually adopt a refinement or enhancement step to further improve the image quality. In summary, demosaicing techniques typically differ in the following aspects: •
Grouping strategy: non-adaptive or edge-directed, decision criteria of the demosaicing direction;
•
Reconstructive filters: parameters of the filters and the operational domain;
•
Refinement or enhancement III.
(a)
With an assumption that Bayer CFA is used, we can represent the demosaiced image Id and the RAW (sensor samples) S as
y x (b)
{r , G , B}11 I d = { R, g , B}21
(c)
Figure 1. (a) A Typical Processing Pipeline for Single-Sensor Cameras and (b) A Bayer Color Filter Array (CFA) (c) Three Shifted Bayer CFAs
The rest of paper is organized as follows. In section 2, we compare various existing demosaicing techniques and we single out their similarities and major differences. In section 3, we describe our demosaicing detection model based on refined grouping. The experimental results are presented in section 4 and section 5 concludes this paper. II.
PROPOSED DETECTION METHOD
{R, g , B}12 { R, G, b}22
… ,
r11 S = g 21
g12 … b22
where capital letters R, G and B denote the demosaiced samples. Our previous work [11] has shown that demosaicing a sample is equivalent to estimation of its second-order derivative along the demosaicing direction. Hence, demosaicing formula can be estimated based on image derivatives. For instance, suppose Gij is demosaiced along the x-axis, we can write an equation as
DEMOSAICING METHODS w2( gx) Si(−x1,) j−1 x Gij( ) = ∑w5( gx) Si(,xj)−2 w6( gx) Si(,xj)−1 w10( gx) Si(+x1,) j−1
Figure 2. General Steps in Demosaicing
Numerous demosaicing methods have been proposed in the literature and their general steps are shown in Fig. 2. In this framework, the missing color samples in RAW are firstly divided into several groups. Non-adaptive demosaicing algorithms such as bilinear, Bicubic, median filter and smooth hue equivalently employ a simple grouping strategy to divide
w1( gx) Si(−x2,) j ( gx) ( x)
( gx) ( x)
w7( gx) Si(−x1,) j
w8( gx) Si(,xj)+1
w3 Si−1, j w4 Si−1, j+1 w11( gx) Si(+x1,) j w12( gx) Si(+x1,) j+1 w13( gx) Si(+x2,) j
( gx) ( x) ( g) (1) w9 Si, j+2 +nij
where Gij( x ) = gi −1, j − 2Gij + gi +1, j and Sij( x ) = Si − 2, j − 2Sij + Si + 2, j are the x-directional derivatives computed from Id and S respectively. w ( gx ) = {wm( gx ) } for 1≤m≤13 are weights that characterize the reconstructive filter used in demosaicing and
498
nij(
g)
is the prediction error. Since {Sij( x ) } are computed from
sensor samples of all 3 colors, the correlation model simultaneously takes into account both cross-channel and intra-channel correlation. To estimate the underlying reconstructive formulas, we propose a reverse grouping scheme to uncover the original demosaicing grouping. Since different reconstructive formulas are used for different groups in a demosaicing technique, precise reverse grouping enables accurate estimation the underlying reconstructive formulas. In this paper, the reverse grouping consists of two steps. In the first step, we divide all demosaiced samples into several firstlevel groups based on their color channels and their relative positions in the 2×2 periodical CFA lattice. In the second step, we further partition the first-level groups which have several possible demosaicing directions. y u
x
(a)
v
(b)
(c)
(d)
Figure 3. Four Patterns of Nearest Sensor Samples for Bayer CFA, (“o”: sensor samples; “◊”: demosaiced samples); For Green Channel (a) Four Direct Neighbors; and for Red and Blue Channels (b) Four Corner Neighbors; (c) Two Vertical Neighbors and (d) Two Horizontal Neighbors
After the first step, we examine the possible demosaicing direction for each first-level group and the possible directions are closely associated with the pattern of the nearest surrounding sensor samples. Four possible patterns are illustrated in Fig. 3. For patterns (a) and (b), ambiguity arises as demosaicing can be done in either one of the two suggested directions or omnidirectionally, i.e. as an average of both directions. To resolve this ambiguity, we partition such a firstlevel group into 3 subgroups by using an expectation minimization (EM) algorithm below.
where {w k } is fixed. In the minimization step, we fix {vnk } , w k is computed as a regularized least square solution below
(
min Q k w k − z k
2
)
+ λ ⇒ w k = Q†k z k
(4)
where
v1k s1( k ) T v1k z1( k ) −1 T † Qk = , zk = , Q k = ( Q k Q k + λ L ) Q k , ( k )T (k ) vNk s N vNk z N
λ is a small regularization constant and L is an identity matrix. The EM steps are repeated until the total re-prediction error stabilizes to a low level. As both the E and M steps tend to reduce J, convergence is generally assured. As the outcomes, the original grouping adopted by the demosaicing technique can be largely recovered and the underlying demosaicing formulas can be accurately estimated. For patterns (c) and (d) in Fig. 3, the demosaicing directions are clear as the nearest 2 sensor samples are either vertically or horizontally arranged. The underlying demosaicing formulas for such groups can be directly computed as a similar regularized least square solution. IV.
EXPERIMENTAL RESULTS
A. Prediction Accuracy
Let {zn} for 1≤n≤N denote an ambiguous first-level group and assume the possible demosaicing directions be x, y and the average of both directions. Let { zn(1) } , { zn( 2) } and { zn( 3) } denote the corresponding x-, y-directional second-order derivatives and the average derivatives. Let {s(n1) } , {s(n2 ) } and {s(n3) } for 1≤n≤N be vectors of the corresponding neighboring derivatives computed from S for the different directions. The EM algorithm is proposed to minimize
(
J = ∑ n =1 ∑ k =1 vnk zn − w k s n N
3
(k )
T
(k )
)
2
(2)
where vnk ∈ {0,1} is the subgroup indicator and w k is the kth prediction weight vector for 1≤k≤3. We first initialize the weight vectors {wk} as zero vectors. In the expectation step, we set
(
1, if k = arg min z ( k ) − w T s( k ) n k n vnk = 0, otherwise
)
2
(3)
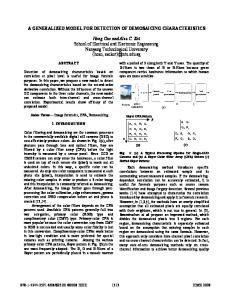
Figure 4. Comparison of Average Absolute Prediction Error for 10 Demosaicing Algorithms where IG Stands for Iterative Grouping
In this experiment, we create a syntactic image set containing 100 images of 512×512 to study the average reprediction accuracy for 10 reported demosaicing algorithms. We first sample the RAWs from the 100 images according to the Bayer CFA in Fig. 1(b) and then separately demosaic the RAWs with 10 conventional demosaicing algorithms. The proposed model is applied to compute both the prediction weights and errors for these demosaiced images. We compare our method with a traditional intra-channel method in terms of average absolute re-prediction error for green demosaiced samples. The results in Fig. 4 show that our model is more accurate in terms of re-estimation of the demosaiced samples from the sensor samples. Based on the same rough reverse grouping method in [8], our image derivative-based
499
correlation model is more accurate than [8] for demosaicing methods that utilize cross-channel information to reconstruct the green channel. If the proposed EM iterative grouping is applied, the average re-prediction errors drop to a very low level for all 10 demosaicing algorithms. In Fig. 5, we can see the iterative algorithm gradually reduces the re-prediction error to a low-level for two very different demosaicing algorithms. This suggests significant improvement in the detection accuracy.
(a)
Test image (b) Figure 5. Average Re-prediction Error Vs Iterations for (a) Hamilton and (b) Bicubic Demosaicing Methods
V.
CONCLUSIONS
In this paper, we significantly improve our earlier detection model of demosaicing regularity based on secondorder image derivative correlation. The new model incorporates a novel reverse grouping technique to accurately uncover the original grouping and the reconstructive formulas used in demosaicing. Our experiments on syntactic images show the proposed reverse grouping technique is highly effective in terms of improving the overall re-prediction accuracy for the demosaiced samples. By applying this model in camera identification, we achieve an average accuracy of 97.7% for 10-camera classification based on individual image blocks. This good performance shows efficacy of the proposed model in terms of accurately capturing the unique processing characteristics in commercial cameras. REFERENCES
B. Camera Model Identification
[1]
TABLE I. CONFUSION MATRIX (%) FOR 10-CAMERA MODEL CLASSIFICATION, WHERE EMPTY FIELD DENOTE SMALL VALUES < 1% Ave. rate = 97.7%
element denotes the probability of classifying an image block from the ith camera as the jth camera. The results show very good overall classification performance with an average accuracy of 97.7%. Since this result is achieved based on individual image blocks and practically a photo can be partitioned into many blocks, the accuracy can be further improved to near 100% by simply averaging the probabilistic scores for multiple blocks.
[2]
Predicted camera
Input camera
1 2 3 4 5 6 7 8 9 10 1 96 3 1 2 3 88 8 3 100 4 100 5 98 6 99 7 100 8 99 9 1 98 10 100 Camera models: 1. Canon IXUS I; 2. Canon Powershot A620; 3. Casio EX-Z60; 4. Lumix DMC-FX01; 5. Lumix DMC-FX2 ; 6. Olympus u300d ; 7. Olympus E500 ; 8. Sony DSC-P73 ; 9. Nikon D70 and 10. Fujifilm FinePix Z2
In this experiment, we classify 10 commercial camera models. We first select 100 photos from each camera in order to cover large scenery variations. All selected photos are direct camera outputs and they are all stored in the camera default JPEG formats. We then extract 12 image blocks of 512×512 from each photo at 12 fixed locations to form an image set of 12000 image blocks. The image set is further partitioned into 8000 training blocks and 4000 test blocks. For each block, we apply our detection model 4 times to cater for the 4 possible Bayer CFAs in Fig.1 (b) and (c) and the prediction weights are used as features for classification. After feature extraction, we build a probabilistic support vector machine (SVM) classifier with radial basis function (RBF) kernel [13] from the training feature set and test it with the test feature set. The results are presented in Table 1 in terms of confusion matrix, where (i, j)th
[3]
[4] [5] [6]
[7]
[8]
[9]
[10]
[11] [12]
[13]
500
M. K. Johnson and H. Farid, “Exposing Digital Forgeries by Detecting Inconsistencies in Lighting,” Proc. of ACM Multimedia Security Workshop, 2005 J. Lucas, J. Fridrich and M. Goljan, “Digital Camera Identification from Sensor Pattern Noise”, IEEE Trans. Information Forensics and Security, vol. 1-2, pp.205-214, 2006 I. Avcibas, N. Memon and B. Sankur, “Steganalysis Using Image Quality Metrics”, IEEE Trans. on Image Processing, vol. 12(2), pp. 221-229, 2003 S. Lyu, “Natural Image Statistics for Digital Image Forensics,” ph.D Thesis, Dartmouth College, 2005 Bayer Filter Array, Available: http://www.prophotowiki.com/w/index.php/CFA A. C. Popescu and H. Farid, “Exposing Digital Forgeries in Color Filter Array Interpolated Images”, IEEE Trans. on Signal Processing, vol. 53-10, pp. 3948-3959, 2005 S. Bayram, H. T. Sencar, N. Memon and I. Avcibas, “Source Camera Identification Based on CFA Interpolation,” In. Proc. of ICIP, vol. 3, pp. III-69-72, 2005 S. Bayram, H. T. Sencar and N. Memon, “Improvements on Source Camera-Model Identification Based on CFA Interpolation,” in Proc. WG 11.9 Int. Conf. on Digital Forensics, 2006 A. Swaminathan, M. Wu and K. J. R. Liu, “Nonintrusive Component Forensics of Visual Sensors Using Output Images,” IEEE Trans. on Information Forensics and Security, vol. 2-1, pp. 91-106, 2007 Y. Long and Y. Huang, “Image Based Source Camera Identification using Demosaicing,” In Proc. of IEEE 8th Workshop on Multimedia Signal Processing, pp. 419-424, 2006 H. Cao and Alex C. Kot, “A Generalized Model for Detection of Demosaicing Characteristics,” Proc. of ICME, pp. 1513-1516, 2008 R. Ramanath, W. E. Snyder, Y. Yoo and M. S. Drew, “Color Image Processing Pipeline”, IEEE Signal Processing Magazine, vol. 22-1, pp. 34-43, 2005 C.-C. Chang and C.-J. Lin, “LIBSVM: A Library for Support Vector Machines,” 2001