The 33rd Annual Conference of the IEEE Industrial Electronics Society (IECON) Nov. 5-8, 2007, Taipei, Taiwan
Abnormal Signal Detection in Gas Pipes Using Neural Networks Hwang-Ki Min, Chung-Yeol Lee, Jong-Seok Lee and Cheol Hoon Park School of Electrical Engineering and Computer Science Korea Advance Institute of Science and Technology Daejeon, 305-701, Korea
[email protected] Abstract- In this paper, we present a real-time system to detect abnormal events on gas pipes, based on the signals which are observed through the audio sensors attached on them. First, features are extracted from this signal so that they are robust to noise and invariant to the distance between a sensor and a spot at which an abnormal event like an attack on the gas pipes occurs. Then, a classifier is constructed to detect abnormal events using neural networks. It is a combination of two neural network models, a Gaussian mixture model and a multi-layer perceptron, for the reduction of miss and false alarms. The former works for miss alarm prevention and the latter for false alarm prevention. The experimental result with real data from the actual gas system shows that the propose system is effective in detecting the dangerous events in real-time having an accuracy of 92.9%.
I.
INTRODUCTION
Natural gas has been one of the most important energy resources in these days. Gas pipes are located under the ground and spread their branches to where people live. This gas distribution system makes us get an easy access to gas energy. It is, however, potentially dangerous because the gas pipes are placed closely to people. Once an accident, such as gas explosion, occurs on gas pipes, it causes casualties and material damage [1][2]. Therefore, many studies have been carried out on the safety of gas pipes [3][4]. The unintentional attack on a gas pipe by heavy things like hammer drills and breakers during the work such as digging the hole in the ground is one of the most dangerous situations that threaten the safety of the gas pipe. To prevent and cope with such events, a supervisor of the agency in charge of gas pipes is involved in the work having a possibility of contacting a gas pipe. Even though the presence of a supervisor can reduce the unintentional attacks to a certain amount, there can still exists a possibility of unnoticeable attacks. Therefore, we need an automatic system to monitor the distant gas pipes in real-time. For this work, we consider the gas pipe system which has the audio sensors every several kilometers to produce signals form gas pipes. In this paper, we concentrate on the attack event mentioned above and consider this event as an ‘abnormal’ one for the safety of gas pipes. Our goal is to detect abnormal events based on the signals which are observed through the sensors attached on the gas pipes in real-time. In the proposed system, the sensed signals are transferred to the central computing system
1-4244-0783-4/07/$20.00 ©2007 IEEE
continuously where features are extracted from the transferred signals and applied to the classifier to check whether abnormal event occurs or not in real-time. The difficulty of detecting the attack events is the existence of noise like background noise, car noise, nearby machine noise, etc. For feature extraction, we propose an algorithm to extract features which are noise-robust and invariant to the distance between the sensors and the location of the event. First, we use the filter bank to extract the frequency information from the signal. Then, in order for the compensation of the distortion due to the propagation of the signal through the pipe from the attack spot to the sensor, the cepstral mean subtraction method is applied. Finally, we incorporate the temporal properties of the event into the features by including the delta features. For classification, we propose a classifier combined with two complementary neural networks models to reduce the miss and false alarms together: One is the probability distribution model using a Gaussian mixture model (GMM) and the other a decision-making model using a multi-layer perceptron (MLP). The former learns the ordinary signals, i.e. normal states, and shows significantly low miss alarm rates. The latter learns the exact attack events, i.e. abnormal events, and shows low false alarm rates. These two neural network models work in a complementary way and their two results are combined together to make the final decision. In the following section, we summarize the overall system from the sensors on gas pipes to final decision. In Section III, we explain the algorithm for feature extraction. In Section IV, we illustrate the classifier design using two neural network models and the rule for the final decision. In Section V, simulation results show the effectiveness of the proposed system on the real data set from gas pipes. Conclusion is made in Section VI. II. THE OVERALL SYSTEM The procedure of detecting the attack event is described in Fig. 1. We divide the waveform transferred in real-time from the audio sensor on the gas pipe into small frames with a moving window which has a length of 2 seconds and proceeds 0.5 second at a time. For the real-time operation, the moving window is equivalent to a buffer which collects the incoming signals for two seconds. For each frame we extract a 26-
2503
gas pipe Sensor
Sensor
Moving window (0.5 sec at a time) Feature Extraction
GMM
26-dimensional features
Decision rule
final decision
MLP
abnormal event normal state
Fig. 1. Overall system from the sensor to the decision. The final decision is delivered to the supervisor of the gas pipe every 0.5 second if the abnormal event occurs.
Signal from audio sensor
Mean removal in time domain
Final feature
Concatenation with delta terms
Segmentation
Cepstral mean subtraction
Hamming window
Fourier transform
Log
Filter bank analysis
Fig. 2. Overall procedure for feature extraction.
dimensional feature vector. The feature vector is applied to both the probability distribution model by a GMM and a MLP which is trained to output +1 for attack events, i.e. abnormal events, and 0 for normal states. In order to make the final decision, we apply a heuristic rule to the results from two models. In the following sections, we explain the detailed methods for feature extraction, the classifier design and decision-making.
Therefore, our feature extraction method emphasizs low frequency components. The first step is the segmentation: a signal is divided into segments of 2 second duration by applying a window function proceeding by 0.5 second at a time. These parameters for the segmentation are determined based on the characteristics of the targets, i.e. attack events. Then, the Hamming window is applied to the segment to prevent the aliasing effect [5]. Next, for each segment, we perform discrete Fourier
III. FEATURE EXTRACTION
2500
2504
2000
Frequency (Hz)
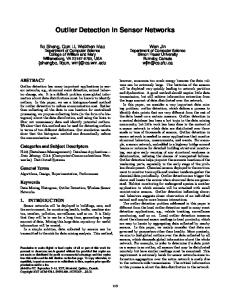
Extracting appropriate features is very important in classification to improve performance. The overall procedure for feature extraction is summarized in Fig. 2 where the signals are analyzed in the frequency domain. Before the frequency analysis, the bias term of each signal is removed by subtracting the mean value over time from the signal. For the training data the mean value is calculated over the whole time domain, while for the test data, it is calculated over the first 20 seconds for real-time operations. Fig. 3 shows the spectrogram of one of real signals used in our experiment. The intervals of the attack event are indicated by the double arrow between two vertical lines. The noticeable characteristics of the attack event are that the energy is concentrated on the relatively low frequency bands. Most of this energy is contained in the frequencies below 500 Hz.
1500
1000
500
0 10
15
20
25
30 Time (sec)
35
40
45
50
Fig. 3. Spectrogram of a signal from gas pipes: the attack event occurs from 22 second to 30 second.
2500
0.015 2000
M a g n itu d e
Frequency (Hz)
0.01
1500
(b) (c)
(a) 1000
0.005 500
0 0
200
400
600
800 1000 1200 1400 Frequency (Hz)
1600
1800 2000
0 10
Fig. 4. Configuration of the filter bank.
15
20
25
30
35 40 Time (sec)
45
50
55
60
Fig. 5. Spectrogram of a signal from gas pipes: (a) attack event; (b) noise from a nearby machine; (c) noise from cars.
transform (DFT) using a filter bank which is designed as follows: the bank has 9 triangular filters whose center frequencies are linearly spaced from 100 Hz to 900 Hz. And, for higher frequencies than 900 Hz, it has additional 4 triangular filters whose centers are spaced in the logarithmic scale [5] and the components over 2 kHz are suppressed. In other words, the center frequencies of the filter banks are given by 1≤i ≤ 9 100 × i, (1) fc (i) = i −9 900 × 1.17 , 10 ≤ i ≤ 13 which is shown in Fig. 4. Although noise shows similar characteristics of frequency energy to the attack signal below 500 Hz, some type of noise contain unnegligible energy in the band from 1 kHz to 2 kHz unlike an attack signal as shown in Fig. 5. Thus, the components in this frequency interval are extracted for features for improved discrimination of signals and noise. The attack event (Fig. 5(a)) occurs from 17 to 29 second, while some noise from a nearby machine (Fig. 5(b)) and car noise (Fig. 5(c)) appears from 38 to 43 second and from 44 to 49 second, respectively in Fig. 5. The cepstral features, known to be good for robust recognition [5], are extracted from the outputs of the filter bank and the cepstral mean subtraction (CMS) is performed to remove the channel distortion caused by different distances between the sensor and the attack point [6]. Let the cepstral feature vector obtained logarithmically from the filter bank be x0 (t ) . Then the feature vector after the CMS, x (t ), is written by 1 T x (t ) = x0 (t ) − ∑ x0 (t ) , (2) T t =1 where T is the number of frames for the calculation of the mean value. In other words, the mean value of the feature over time is subtracted from each feature vector. While the mean value can be calculated over the whole time domain for the training data, it is evaluated over first 20 seconds and used for the remaining frames in generalization test.
Together with the 13 static features, we use the delta features defined by [7] 2
∆x(t ) =
∑ ( x(t + k ) − x(t − k )) ⋅ k k =1
2
2⋅ ∑ k
.
(3)
2
k =1
Note that the interval of the window for the delta feature is determined as two based on the simulation results from many trials to obtain the best performance. This feature contains the temporal properties of the signals. The use of the delta features along with the static features improves recognition performance in this work. The final feature vector consists of the 13 static features and the 13 delta features for every 0.5 second. IV. CLASSIFIER AND DECISION-MAKING The classifier consists of the two complementary neural network models: a probability distribution model using a GMM and a recognition model using a MLP. The former learns normal states and the latter the abnormal events. These two models are combined as a classifier for the reduction of miss and false alarms. A. The Probability Distribution Model What we have done first is to construct the probability density function of normal states using a GMM because of a lack of experimental data [8][9]. We train the model using normal states of training signals to find the probability distribution. Given an input signal, we obtain its probability using this trained probability density function. If the probability is higher than a threshold, we make a decision that the event is normal. Otherwise, we conclude that the event may be abnormal. In order to prevent miss alarms, we use a slightly high threshold, which increases false alarms. The problem of false alarms can be solved by the following model.
2505
We define an evaluation function of frame i, d (i ) , for the final decision to be 1 i d (i ) = (4) ∑ ( g ( j ) + 2 m( j )), 15 j = i − 4 where g ( j ) and m( j ) are outputs of the probability distribution model and the MLP respectively: 0 means the normal state and +1 the attack event. In (4), we use 5 frames, i.e. 2 seconds, to make the decision for the current frame i, and the twice weight value for m( j ) of g ( j ) . These parameters were determined based on the simulation results from many trials to obtain the best performance. It is decided that frame i is abnormal if the evaluation of the frame, d (i) , is greater than 0.5. The result is shown in Fig. 6(c).
3000 2500
Frequency (H z)
2000 1500 1000 500 0 (a) (b) (c) 0
20
40 60 Time (sec)
V. EXPERIMENTS
80
Fig. 6. Recognition results of the classification step. Black line represents the actual abnormal event and gray lines represent the results from the classification. (a) The result from the probability distribution model shows the many false alarms. (b) The result from the MLP shows the sparse miss alarms. (c) The final decision is the combination of these two results through the decision rule.
B. The Recognition Model A MLP is used to recognize attack events [8]. It is trained by the supervised learning algorithm to produce 0 for the normal events and +1 for the attack events respectively. For generalization decision is made that the event is an attack when the output of the MLP is greater than 0 and otherwise, the event is normal. Compared to the probability distribution model, since the MLP learns the attack events directly, it prevents false alarms but has unexpected miss alarms. This problem is solved in the following subsection. C. Decision Rule As mentioned before, the two models have problems of the miss and false alarms, respectively. The probability distribution model seldom produces miss alarms but produces false alarms frequently (Fig. 6(a)). The MLP dose not produce false alarms frequently but miss alarms sparsely (Fig. 6(b)). Therefore, we propose a classifier consisting of the two models to reduce both miss and false alarms. In fact, we should note that the MLP does not miss the whole sequence of attack events. As in Fig. 6(b), it misses the attack events by detecting them sparsely over the period of attacks. Therefore, the past results of several seconds are included for the decision of the current event. For the reduction of false alarms, we concentrate on the decision results of the MLP more than the probability distribution model, because the decision of the attack events from the latter is more likely to be false than the former. Finally, these two models are combined together to make a final decision.
We use 8 data obtained from the actual gas pipe system for the experiments. Each of 8 data is from 60 seconds to 90 seconds long and contains the actual attack event which is about 10 seconds long. In our data set, attack events are generated from one source, the hammer drill attack on gas pipes. Each of data has various noises from the environment such as cars, machine related with gas pipes, and so on. In two of them, the distance between the sensor and the attack point is 13 km. And in the rest data, the distance is 6.5 km. TABLE I. The data configuration for the experiment Data Set
Train
Test
6.5 km
13 km
6.5 km
13 km
1
6*
0
0
2
2
0
2
6
0
3
3
1
3
1
* The number means the number of data used
We define three types of data set for experiments (Table I). In data set 1, we use 6 data whose distance, i.e. the distance between the sensor and attack point, is 6.5 km for the train and the rest for test. In data set 2, we use the 2 data where the distance is 13 km for the train and the rest for test. In data set 3, we use 4 data, 3 of which are from 13 km and the rest from 6.5 km, for the train and the other 4 data for test. GMMs are trained for the probability distribution with the 10 Gaussians and Expectation-Maximization (EM) algorithm [9]. Two-layer perceptrons having 13 hidden neurons are trained by the Levenberg-Marquardt algorithm to discriminate normal and attack events [8]. We check that average time for extracting the 26 dimensional feature vector from one frame is about 0.1 second and the decision time is less than the 0.5 second, which makes our system work in real-time.
2506
TABLE II. RECOGNITION RESULTS Data set
Test accuracy [%] Filter Banks Analysis (FBA)
FBA + CMS
FBA + CMS + Delta Feature
1
73.9 (92.7)
88.3 (96.6)
88.5 (94.0)
2
42.8 (54.1) 90.6 (97.4)
80.3 (91.9) 92.2 (96.8)
81.4 (88.2)
3
92.9 (97.7)
5000
5000
4000
4000 Frequency (Hz)
Frequency (Hz)
The number in the parentheses is the performance of the best case.
3000 2000
2000
1000
1000
0
0
0
20
40 60 Time (sec)
80
0
5000
5000
4000
4000 Frequency (Hz)
Frequency (Hz)
3000
3000 2000
0
0
20
30 40 Time (sec)
50
60
30 40 Time (sec)
50
60
2000 1000
10
20
3000
1000
0
10
0
20
40 60 Time (sec)
80
100
Fig. 7. Results of recognitions for the 4 test data in data set 3. Black line represents the actual abnormal event and gray line represents the recognition results.
Table II shows the recognition result for each data set and each method for feature extraction. They are the average result of 20, 20 and 200 simulations for the data set 1, 2 and 3, respectively. For all the cases, the recognition result for the training data is 100 percent.
Table II shows that the use of the CMS method in feature extraction results in the improvement of performance, especially in the cases of data set 1 and 2. The increases of test accuracies due to CMS are 14.4% and 37.5% in data set 1 and 2, respectively. This result is consistent with our expectation that we can extract the features which are the channel
2507
distortion-free, i.e. invariant to the distance between the sensor and the attack point, by using the CMS method. Besides, we observe that the use of the delta feature improve the performance by from 0.2% to 0.9% for the test accuracy of each data set. The performance of data set 3 is the best among three data sets. When we use the full feature vector including the delta feature, the test accuracy reaches 92.9%. The results of the detection for the 4 test data are shown in Fig. 7.
[9]
VI. CONCLUSION We have proposed the real-time monitoring system of gas pipes to determine whether an attack event which threatens the safety of gas pipes occurs on the pipes or not. We designed the robust feature extraction method from the signals recorded by a microphone attached on the pipe. We performed the frequency domain analysis using nonlinear scale filter bank analysis and CMS. Delta features were also used for improved recognition performance. To reduce the miss and false alarms together, the classifier is designed as the combination of two complementary neural network models: a probability distribution model and a MLP. Our experimental result shows that the best recognition accuracy was 100 % for training data and 92.9 % for test data. The developed method can be used in real-time operation, which is desirable for use in the real situation. ACKNOWLEDGEMENT We appreciate Mr. J. P. Koh, S. Y. Jang and S. S. Park at Korea Gas Corporation for their helpful discussion and providing experimental data. This work was supported by Brain Korea 21 Project, The School of Information Technology, KAIST in 2007. REFERENCES [1] http://en.wikipedia.org/wiki/Gas_explosion. [2] http://www.history.com/tdih.do?action=tdihArticleCategory&id=417. [3] S. G. Roh and H. R. Choi, “Differential-drive in-pipe robot for moving inside urban gas pipelines,” IEEE Trans. Robotics, vol. 21, no. 1, pp. 117, 2005. [4] K. Suzumori, S. Wakimoto, and M. Takata, “A miniature inspection robot negotiating pipes of widely varying diameter,” in Proc. IEEE Int. Conf. Robotics and Automation, vol. 2, pp. 2735-2740, 2003. [5] X. Huang, A. Acero, and H.-W. Hon, Spoken Language Processing: A Guide to Theory, Algorithm, and System Development, Prentice-Hall, 2001. [6] R. M. Stern, B. Raj, and P. J. Moreno, “Compensation for environmental degradation in automatic speech recognition,” in Proc. ESCA-NATO Tutorial and Research Workshop on Robust Speech Recognition using Unknown Communication Channels, pp. 33-42, Pont-à-Mousson, France, April, 1997. [7] T. H. Applebaum and B. A. Hanson, “Regression features for recognition of speech in quiet and in noise,” in Proc. Int. Conf. Acoustics, Speech, and Signal Processing (ICASSP), vol. 2, pp. 985-988, Toronto, Canada, April, 1991. [8] C. Bishop, Neural Networks for Pattern Recognition, Oxford: Oxford University Press, 1995.
2508
A. P. Dempster, N. M. Laird, and D. B. Rubin, “Maximum likelihood from incomplete data via the EM algorithm,” J. Roy. Statist. Soc. B, vol. 39, no. 1, pp. 1-38, 1977.