A Visual Interface Designed for Novice Users to find Research Patient Cohorts in a Large Biomedical Database Shawn N. Murphy, MD, Ph.D., Vivian Gainer, MS, and Henry C. Chueh, MD, M.S. Laboratory of Computer Science, Massachusetts General Hospital, Boston, MA. One of the more difficult tasks of informatics is allowing for the navigation of complex databases. At Partners Healthcare Inc. we have developed an analytical database to allow for searching clinical data to obtain cohorts of patients for research studies. The characteristics of the patients within the cohorts must often comply with complex inclusion and exclusion criteria. The users of the database are research clinicians, often with no prior database experience. To assist these clinicians in finding their patient cohorts, we constructed a Querytool that they use directly to find their desired populations. In order to understand if the Querytool could indeed be used successfully by novice users, we analyzed the first 10 queries of 219 users. This analysis was able show that novice users are able to achieve excellent success using the Querytool.
demographics, providers, clinical concepts (such as diagnoses or procedures), and visit characteristics. These groups of items were often constrained by dates and associated values.
INTRODUCTION
Metadata navigation would be the first challenge for our users. Metadata consists of data about the data, and is familiar to most of us as “vocabularies”. There are many national and international vocabularies, such as ICD9, CPT4, READ, SNOMED, NDC, and LOINC to only name a few. Each vocabulary has its own nuances, which must be respected while doing queries, such as ICD9 codes with categories that can
At Partners Healthcare Inc. (which includes the Massachusetts General Hospital and the Brigham and Women’s Hospital) we have an analytical database named the Research Patient Data Registry (RPDR) that allows for searching of clinical data. The RPDR contains diagnoses, medications, procedures, and laboratory studies from administrative and clinical databases. The patients are crossreferenced across institutions and their demographics provided by an Enterprise Master Patient Indexing service. Associated providers, dates, locations of service, and other visit-related information accompany the above items as they are fed into the system. The number of patients in the database exceeds 1.8 million. The number of patientconcept pairs, or clinical “facts” about the patients, exceeds 450 million. Tools for querying healthcare data have traditionally been text based (1), although graphical interfaces have been pursued (2). An analysis of the text based queries that found research cohorts from our old COSTAR system had revealed a construction pattern that could be satisfied with a simple visual interface (3). The pattern consisted of finding intersections of groups of items, where the items could be patient
Unfortunately, the training needed to use the COSTAR system prohibited a novice user from performing queries themselves; thus an expert was needed to perform every request. This approach could not scale to the entire Partners Healthcare Corporation, where we currently get 100-200 queries per week. Therefore, we set out to build a Querytool that did not require the researchers to become expert users of the system. The challenge was to allow a novice population of computer users to navigate the metadata and formulate the queries without our intervention.
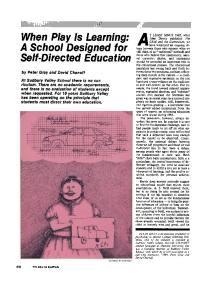
Figure 1 – A hierarchical tree of items for users to choose from is present in the pane along the left, and a set of panels to roughly model a Venn-diagram are present in the upper right. The “New group” button (circled) creates new query-panels.
AMIA 2003 Symposium Proceedings − Page 489
be used themselves for coding, and NDC codes that can be reused so that their meaning may change from year to year. Construction logic is the second challenge. Patient inclusion and exclusion criteria for most research studies are jumbles of different types of information. For example, a study may need patients of a certain age with a particular diagnosis but who are not on certain medications. Although the logic can be difficult, the Querytool needed to be able to accommodate it, and make it intuitively easy to construct. In this paper, we outline the details of the Querytool we developed and provide an analysis to support that it can be used successfully by novice users.
tree-view is not really necessary. However, the treeview was found to help orient users to the hierarchical structure of the items, and a common behavior was to use the tree-view for early queries, and then the “Find” for more specific queries.
METHODS The model for the user interface is shown in Figure 1. The hierarchical tree of items is the “vocabulary” of the database. There are fixed vocabularies and user created vocabularies. All the vocabularies appear in a typical tree-view. Even though the underlying structure of the database places the items in completely different tables and structures, to the user everything appears to be just another item in the tree to be dragged into the logic panels. Behind the scenes, each query item is associated with underlying metadata to help create the query statement that will be submitted to the database. The user’s only choice is what level in the hierarchy to select. Once an item is dragged to the query panels, the user is able to add constraints for the items. The nuances of the vocabularies are hidden at this stage, though they may be manipulated to some extent in the constraints. All items act by default to select the parent code and all its children. User-created vocabularies consist of “Custom Queries” and “Patient Sets.” Any previous query can be saved as a “Custom Query” and used as an item in a new query. “Custom Queries” may produce different numbers of patients when they are run within another query, based upon whether the RPDR data has been updated since the last time it was run. “Patient Sets” are slightly different than “Custom Queries”, because they represent a group of patients from a previous query that will not change when the RPDR is updated. There is also a simple “Find” function to allow a classical alphabetic lookup of items. This was used more often that the tree-view. One may argue that the
Figure 2 – The “Find” tab (circled) can be used to access a function that will alphanumerically search the vocabularies. Also shown is the “Constraints” options which allows dates and special characteristics associated with the semantic type (in this case diagnoses) to be chosen. Available for diagnoses are primary/secondary/admission status of the diagnosis, and an option to search based only upon the parent code (and not the children). Also circled (towards the right) is the timing option selector. Finally, there is a “Previous Queries” tab that allows users to bring up an old query in the Querytool and use it as a template for new queries. It was found that about half of new queries are based on old queries, making it an important feature of the Querytool. One could gain a similar functionality from the “Custom Query” feature, but apparently the “Custom Query” feature is conceptually more difficult to use. Items are dragged from the Query Items and Find panels on the left into the waiting Venn-diagram-like panels on the right. If items are dragged into the same panel, they are logically OR’d together. Items dragged into different panels are logically AND’d together. In this way, the panels are roughly a visual representation of a Venn-diagram. Up to 25 different query-panels are available by clicking the “New Group” button. If an item is associated with a value, like a laboratory test, then a Value selection box comes up instantly with the drag and drop, as shown in figure 3. The value selection box allows for “No
AMIA 2003 Symposium Proceedings − Page 490
value”, meaning all tests are considered valid, a “High/Low” selection where the flag (if it exists) from the performing lab will be used, or an inequality number, which allows the user to specify tests greater than, less than, or between specified values.
Figure 3 - The “Previous Queries” tab is selected on the left large panel in this figure. Also shown are the “Value” options, which are described further in the text. Note that units for the values may be selected in the lower drop-down selector. Enumerated test results are shown as a list of items, rather than the inequality number, which allows the selection of specific enumerated values. All items can be constrained through a “Constraints” box that is available by right-clicking an item. This allows constraints by dates or by coding system specific options. A Group can also be made into a logical NOT by choosing to invert the items. There is a timing specification that applies to the query in its entirety. Either all the Groups must have occurred in the same visit, or the Groups may have occurred in any visit. For example, if one drags “Diabetes” and “Emergency Room” into separate groups, and the user specifies they must have occurred in the same visit, then the patient must have been seen in the emergency room for diabetes. If they specify that the Groups could occur in any visit, then anyone who was seen in the emergency room for anything and also has diabetes will be selected from the database. As is shown in the analysis below, this appeared to be a difficult concept of the Querytool for our users to grasp. When the query is run, aggregate numbers about the patient population matching the query criteria are returned in the display widgets as described in a prior
publication (4). As described in (4), we obfuscate the results somewhat to prevent any possibility that a single individual may be identified through the Querytool interface. Once a set of patients is obtained with the Querytool and the user is satisfied they match the general characteristics required for their research study, the individual patients may be identified, provided the Institutional Review Board has approved the study. The identified list of patients is delivered to the researcher in tables that include all electronic data for those patients, including electronic data pulled from hospital systems not yet incorporated into the data warehouse. In this manner, data marts of electronic information on targeted patient populations can be obtained and distributed. To support the simple drag and drop visual model, as well as the identification and distribution of patient data, a three-tier software architecture was employed. The user interface was developed in Visual Basic and distributed as an ActiveX object embedded in an HTML page. The middle layer was developed in Java and Microsoft COM. The queries are represented throughout their lifetime as XML objects, and a Microsoft SQL 2000 database is queried and managed in standard SQL. RESULTS We performed a usability analysis of the Querytool. All queries submitted to the database are saved and thus can be analyzed. Because we were primarily interested in the naïve user, we analyzed only the first 10 queries per user. A number of important assumptions were made in performing the analysis: 1) That we could deduce the patient population the user was attempting to retrieve by just looking at the query itself. This was supported by the observation of commonly occurring patterns in “standard” queries. 2) That a user was not being “coached” by a more experienced user at the time of the queries. Due to the widely dispersed locations of our users, this was probably a reasonable assumption. 3) That the results do not simply reflect the high or low quality of our help and tutorial web pages. We indeed invested a considerable amount of time and effort in developing these two items. Overall about half the users accessed this material at some time.
AMIA 2003 Symposium Proceedings − Page 491
We analyzed the queries of 219 users. Because many users never performed the full 10 queries, the actual number of queries analyzed was 1,440 queries rather than the expected 2,190 queries. The results are shown in the table below. Errors were classified as logic errors, where the user did not construct the query logic properly; timing errors, where the user did not chose the correct timing specification for the query; and “other” errors. Other errors consisted mostly of inconsistent uses of date constraints, or obvious incorrect choices of proper items. We review queries submitted for Identified Patients with the user prior to returning the Identified Patients. These queries were not included in the analysis. Type of Error No error Timing error Logic error Other errors
Percent of Queries Before Fixes After Fixes 83.8% 89.4% 5.8% 1.1% 6.6% 5.7% 3.8% (no fixes applied) Table 1
As can be seen in Table 1, the greatest number of errors was made when choosing the timing model or when creating the logic for the query. We added some “hints” to the Querytool to force the users to rethink their choices before submitting the query. To fix timing errors, we created the screen in Figure 4. When a user pressed the “Run Query” button, a screen would always pop up to ask for a name for the query, and we modified it to include the explanation of the timing models and to give them the opportunity to change the timing model. As can be seen by
comparing the “Before Fixes” to the “After Fixes” columns, the number of errors became considerably smaller following the fix. For those people who still made errors, we followed-up to ask why (a regular part of our query review before they are submitted for identified patients). Most stated that they had read but did not understand the message. We tried several variations of the message on novice users, but could not arrive at an obviously better message. While analyzing large numbers of queries, we did find some heuristics, which may allow us to catch more timing errors. For example, when selecting the following sets of items, users probably intended that all the items should occur in the same visit: • if two encounter-type items such as location of service, or inpatient/outpatient are logically AND’d together; • if an encounter-type variable is constrained by dates and logically AND’d to other items; • or if an encounter-type variable is logically AND’d to a procedure that is constrained by dates; This would suggest that we could issue a special warning in these cases. Another set of frequent errors was logic errors. Occasionally a query panel was incorrectly inverted (a logical NOT), or a “Custom Query” was used incorrectly in a query, but usually the problem was that the Venn-diagram they had essentially created did not make sense. For example, often all items were simply placed in the first query panel, even though the items needed to be logically AND’d together. So a user would place “Emergency Ward” and “Diabetes” both in the first panel, essentially giving them everyone who ever went to the emergency ward OR who ever had diabetes, probably not what they wanted. In some ways, it is outstanding that people could even navigate the Querytool logic panels at all, considering that the help screens were only accessed about half the time. Of note, on the bottom of the query-panels were tiny help messages (see figure 1 for best view). When the query-panel is empty they state:
And when items are placed in a query-panel they state (in this example panel #1 states):
Figure 4 – Screen created to fix timing errors.
To combat logic errors we added two features. First, we placed the “New Group” button on top of querypanel #3, because using the top-placed arrow to get a
AMIA 2003 Symposium Proceedings − Page 492
new query panel was too obscure for many users, and when some users ran out of the 3 panels they would just put all remaining items in query-panel #3. Second, we used some heuristics so that if semantically dissimilar items were placed in the same query-panel, a pop-up message would appear. For example, placing “Emergency Room” and “Male” in the same query-panel would bring up a message box. The message box warns that these items are usually not logically OR’d together, reflecting that one belongs to the semantic group of Demographics and one belongs to the semantic group of Encounter detail. Most semantically dissimilar items that form illegal combinations will bring up the warning box. However, the users can override the warning, and interestingly, the logic errors were not found to significantly decrease before and after the warning box was added. Other than the two warning/explanatory panels discussed above, we did not make any further attempts to correct peoples actions in the course of running the tool. Users would occasionally select items lower in the hierarchies than items that had already been selected and drag them all into the same query-panel, but this did not affect the query results and so was of no consequence. Something that became apparent during the analysis but we did not quantify was that often the users would use the first few queries to experiment with the Querytool, often with errors, and thereafter would use it error free.
difficulty with this approach is that the granularity of timing varies widely in the data. Furthermore, coding does not generally specify when a diagnosis started, and some data such as demographics are fed to us as “timeless.” The ordered visit option virtually never gave satisfactory results to our users and was eventually abandoned. Querytools that need to focus on timing will probably need to take a different approach than that taken here, displaying a richer set of data so that judgement calls can be made regarding the timing of events. Most promising would be a timeline display of data that could allow for visual comparisons of events, as in the Lifeline software produced by Plaisant et al (5). The ability of a large institution such as Partners Healthcare Inc. to capitalize on its huge patient base for research gives it an enormous advantage in the research marketplace. The Querytool allows any investigator to be empowered to utilize this patient resource, rather than just those who can afford a team of database analysts. It has been a very rewarding experience to help the research teams in this regard. This work was supported by Partners Healthcare Inc. References 1. 2.
DISCUSSION 3. Overall the Querytool was extremely successful in directing users to choose the correct items, and especially after enhancements, getting them to construct the proper logic and timing for the queries. The necessary logic was generally learned quickly. The Querytool proved to be an excellent way for naïve users to obtain a first cut at their research cohort. When starting from a patient base of over 1.8 million, narrowing it down to around 100 - 1000 patients gives a manageable set of charts to go through in detail. The Querytool has achieved excellent acceptance at Partners Healthcare Inc. and is the most prevalent way of obtaining research cohorts.
4.
5.
Nigrin, D.J., Kohane, I.S. Data Mining by Clinicians. Proc AMIA Symp. 1998;957-61. Banhart, F., Klaeren, H. A Graphical Query Generator for Clinical Research Databases. Meth Inform Med 1995; 34:328-39. Murphy, S. N., Morgan, M. M., Barnett, G. O., Chueh, H. C. Optimizing Healthcare Research Data Warehouse Design through Past COSTAR Query Analysis. Proc AMIA Fall Symp. 1999; 892-6. Murphy, S.N., Chueh, H (2002). A Security Architecture for Query Tools Used to Access Large Biomedical Databases. AMIA, Fall Symposium 2002, pages 552-556. Plaisant, C., Mushlin, R., Snyder, A., Li, J., Heller, D., Shneiderman, B. LifeLines: Using Visualization to Enhance Navigation and Analysis of Patient Records, AMIA, Fall Symposium 1998, pp. 76-8.
A weakness in the Querytool is the lack of temporal resolution using the simple approach described in this paper. We tried to add a timing option of “ordered visit”, where the events in query-panel #1 needed to proceed the events in query-panel #2, which needed to precede the events in query-panel #3, etc. The
AMIA 2003 Symposium Proceedings − Page 493