A Subjective Study for the Design of Multi-resolution ABR Video Streams with the VP9 Codec Chao Chen, Sasi Inguva, Andrew Rankin and Anil Kokaram, YouTube, Google Incorporated, 1600 Amphitheatre Parkway, Mountain View, California, United States
Adaptive bit rate (ABR) streaming is one enabling technology for video streaming over modern throughput-varying communication networks. A widely used ABR streaming method is to adapt the video bit rate to channel throughput by dynamically changing the video resolution. Since videos have different ratequality performances at different resolutions, such ABR strategy can achieve better rate-quality trade-off than single resolution ABR streaming. The key problem for resolution switched ABR is to work out the bit rate appropriate at each resolution. In this paper, we investigate optimal strategies to estimate this bit rate using both quantitative and subjective quality assessment. We use the design of bitrates for 2K and 4K resolutions as an example of the performance of this strategy. We introduce strategies for selecting an appropriate corpus for subjective assessment and find that at this high resolution there is good agreement between quantitative and subjective analysis. The optimal switching bit rate between 2K and 4K resolutions is 4 Mbps.
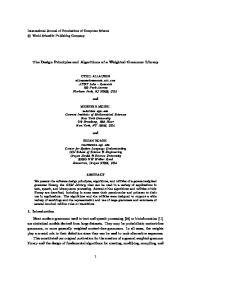
Another important advantage of multi-resolution ABR streaming is its rate-quality performance. In general, high resolution videos have better visual quality at high bit rates and low resolution videos have better quality at low bit rate (see next section for explanations). As shown in Figure 1, with multiresolution ABR streaming, users could always switch to the resolution with the best visual quality according to their available data throughput[4].
Quality
Abstract
4K 2K 1080p
INTRODUCTION Communication networks such as best-effort TCP/IP and wireless suffer from unpredictable variations of data throughput. To ensure the continuous playback of video streams at the user client, adaptive bit rate (ABR) video streaming can be used []. It allows video clients to dynamically request a video stream with an appropriate bit rate matching the available data throughput at any time. The Dynamic Adaptive Streaming for HTTP (DASH) standard issued by the Moving Picture Experts Group (MPEG) makes the large-scale deployment of ABR streaming possible [1]. A DASH-compatible video stream can contain multiple representations of a video, which are encoded at different bit rates for ABR streaming. In a communication network, the throughput can vary across a large range [2, 3]. Therefore, the representations in an ABR stream should also cover a wide range of bit rates such that clients can always request a stream of appropriate bit rate. However, given a fixed resolution, the range of achievable encoding bit rate is limited. For example, a 4K video can not be encoded to very low bit rate while maintaining picture quality and in contrast a 360p clip is not visibly acceptable even at a high bit rate because on average it simply does not have the spatial frequency energy of a 4K clip. To increase the range of accessible bit rates, multiresolution ABR streaming is used. Specifically, a video can be encoded into representations of different resolutions at different bit rates which balance picture quality with that bit rate more effectively. For instance, YouTube has provided DASH streams with resolution of 4K, 2K, 1080p, 720p, 480p, 360p and 240p since 2013, all at different bit rates.
Multi-resolution ABR Single-resolution ABR
Switching bitrate
Figure 1.
Switching bitrate
Bitrate
The rate-quality performance of single resolution ABR streams
are illustrated by the dashed lines. With multi-resolution ABR streaming, better rate-quality performance can be achieved, which is illustrated by the solid line. The cross-over points between these rate-quality curves determine the optimal bit rate range for switching between resolutions.
To fully take advantage of the superior rate-quality performance of multi-resolution ABR streaming, it is important to identify the bit rate at which the resolution should be switched (see Figure 1). The essential idea is to measure the rate distortion performance of different video resolutions and determine the rate at which the rate-quality characteristics cross over. In other words, within a viewing window at a particular resolution there exists a bit rate at which the lower resolution representation of the signal, up sampled to the window size, is visibly better than the original resolution signal at that bit rate. Using our example, we can generate a 2K representation from a 4K ingested clip by downsampling the signal, and then upsample the 2K representation to 4K to simulate its appearance at that higher resolution. Comparing the encoded picture quality of each of these signals at a series of bit rates allows us to determine that crossover rate. That rate then becomes the minimum bit rate target for 4K video, and the maximum target for 2K representations of the 4K original. Rather than determine this resolution switching birate per clip, we require instead to discover whether it is possible to determine a rate which is acceptable across a wide selection of ma-
Objective Analysis of Switching bit rate We collected 7966 short 4K videos (duration less than 5 minutes) uploaded to YouTube and encoded those videos into 2K and 4K resolutions at 10 different bit rates uniformly sampled from 0.5 Mbps to 15.5 Mbps. For each encoded video, we calculate the SSIM to obtain its bit rate-SSIM curve. Using these curves, we obtained the 2K/4K resolution switching bit rate of each video. The empirical cumulative distribution of the resolution switching bit rate is given in Figure 2. The average switching bit rate is observed as 4 Mbps. 70% of videos have switching bit rates lower than 4.5 Mbps, which means at encoding bit rate higher than 4.5 Mbps, most videos have better SSIM if they were encoded into 4K resolution. We also note that around 70% of videos’ switching bit rate is higher than 2 Mbps, which means most videos should be encoded to 2K resolution for better SSIM when the target encoding bit rate is lower than 2 Mbps. Since our analysis is based on SSIM, which does vary from human perception of video quality[10], we designed a subjective study to verify our analysis as presented above. The details are explained in the next section.
Design of Subjective Study In our subjective study, we carefully select a small collection of videos such that they can be representative of the videos uploaded to YouTube. Then, we encoded the selected videos into 2K and 4K resolutions at different bit rates. Lastly, we conducted a double-stimuli continuous quality scale (DSCQS)[11] subjective study to discover their resolution switching bit rates.
Video Content Selection for Subjective Study To avoid exhausting the subjects, the length of a subjective study session should not be longer than an hour[11] and the number of videos involved in the study is small. To select representative videos, we first analyze and extract the features of the videos that are relevant to the switching bit rates. Then, based on these features, we select 9 high quality video contents for the subjective study. Comparisons between 2 treatments at 4 different bit rates for each of 9 clips takes about 1 hour. Since a low-resolution video has lower spatial sampling rate than a high resolution video, it suffers from more spatialfrequency aliasing. The level of aliasing depends on the spatial complexity of the video because a video of higher spatial complexity tends to have more high frequency components and is thus more vulnerable to aliasing[12]. This therefore is one feature that can be used to examine the corpus. Another source of distortion in videos is quantization. An encoded video bitstream is composed of motion vectors and prediction residuals[8, 13]. Motion vectors indicate the trajectory of pixels and are compressed losslessly. Unlike motion vectors, the prediction residuals are compressed through quantization, which introduces distortions. Suppose a 4K video and a 2K video are encoded at the same bit rate. The 4K video has more macro blocks and thus allocates more bits for motion vectors. Correspondingly, 4K video has fewer bits for encoding residuals than the 2K video. Therefore, more quantization distortion is introduced for the 4K video. This disadvantage of 4K video is more obvious for videos with high temporal complexity because videos with high temporal complexity have more unpredictable motions and thus more prediction residuals to encode. Their quality is more sensitive to the number of bits allocated to residuals. This therefore gives a second feature for examining the complexity space.
Empirical cumulative probability distribution (%)
terial. This can be done by using objective quality metrics to assess quality across a large corpus. We may then choose the final switching bit rate as that rate at which say 90% of clips have a lower crossover rate. Existing objective video quality metrics such as MOVIE [5] or STRRED [6] can achieve satisfactory performance with respect to visual fidelity but their computational complexity is high. Instead we employ PSNR or SSIM[7] lower cost metrics. The final variable in these experiments is the codec used. In this paper we employ the VP9 codec [8] but the methodology is applicable to any codec and its configuration. We use the open source ffmpeg implementation of the VP9 encoder available at [9]. Despite the convenience of objective metrics, it is well accepted that they do not necessarily match human visual perception very well. What we propose in this paper is a strategy for using subjective assessment to directly measure the relevant rate-quality curves. Clearly we cannot do this for a sufficiently large selection of clips. However we additionally propose a strategy for selecting a representative set of clips from the larger corpus, suitable for subjective assessment. Our corpus is 7966 4K clips uploaded to YouTube in the last year. We first identify their average crossover bit rate using SSIM. Then we select just 10 clips from this corpus using a quantitative representation of the complexity space. That set is used to conduct a subjective study to measure the rate-quality performance directly. We find reasonable agreement between SSIM and our subjective experiments. In addition the significance of our findings shows that the subjective study is indeed meaningful, which lends some validity to our pre-processing step for clip selection. Although our experiments present analysis of 2k/4k switching bit rate with the VP9 codec, the methodology of this paper can be used to find the resolution switching bit rate for other resolutions and other codecs. The rest of the paper is organized as follows: The next section shows our analysis on the resolution switching bit rates based on SSIM. Then we explain our design for the subjective study and presents the experimental results of the study. The last section concludes the paper and discusses the future work.
100 90 80 70 60 50 40 30 0 1 2 3 4 5 6 7 8 9 10 11 12 13 14 15 Encoding Bitrate (Mbps)
Figure 2. The empirical cumulative distribution function (CDF) of the resolution switching bit rate of all 4K videos uploaded to Youtube.
Quality
High resolution video Low resolution video depends on spatial complexity
depends on temporal complexity
Switching bitrate
Figure 3.
Bitrate
The quality gap between high and low resolution videos at low
encoding bit rate depends largely on the temporal complexity. The quality gap at high encoding bit rate depends mainly on the spatial complexity.
that the values of the I frame size and normalized P frame size are scattered widely and loosely coupled. We partition the space of I frame size and normalized P frame size using the percentile of their marginal distributions, respectively. In particular, we calculated the 33% and 66% percentile of the marginal distribution of I frame size and normalized P frame size, respectively. Then we partition the space of spatial-temporal complexity using these percentiles into 9 regions as shown in Figure 4. In each region, we selected 20 videos that is closest to the centroid of the region (shown by the 5 markers in Figure 4). We manually reviewed each of these 20 clips and selected one video that was free from artifacts such as out-of-focus and over-exposure (shown by 4 markers in Figure 4). The chosen videos are shown to be close to the centroid of the respective regions. Using a final visual assessment together with the initial analysis of the space allows us to have confidence that the set represents the space in some sense.
1.6
4k videos in Youtube selected video in study
1.4
centroid of the partitions 1.2 P frame size/I frame size
Figure 3 illustrates the typical rate-quality performance of a video which is encoded into a high-resolution version and a low resolution version. At low encoding bit rate, the amount of bits for encoding motion vector is comparable to the amount of bits for encoding residuals. The high resolution video thus allocate much fewer bits for prediction residuals and suffers from significant quantization distortions. The quality gap between high resolution and low resolution video is mainly determined by the temporal complexity of the video content. The larger the temporal complexity, the larger the performance gap. At high encoding bit rate, the amount of bits allocated to the residual of low resolution video and high resolution video are both high. The gap of video quality is mainly caused by the frequency aliasing of the low resolution video. Video contents with higher spatial complexity will cause more quality degradation in low resolution video. In sum, the spatial and temporal complexity of a video determine the quality gap between low-resolution video and highresolution video and thus determines the resolution switching bit rate. Based on this observation, we extract spatial-complexity and temporal-complexity features from our corpus then uniformly sample videos from the spatio-temporal feature space for our subjective study. The easiest way to assess the spatial/temporal complexity is to measure the average size of their I frames and P frames. However, videos with large I frames tend to have large P frames because high spatial complexity also give rise to more prediction residuals in motion compensation. In our study, we would like to sample video with different level of spatial and temporal complexity independently. To decouple the correlation between I frame size and P frame size, we normalize the size of frame size P frame by the I frame size and use PI frame size as the indicator for the temporal complexity. We selected 3226 video clips from our corpus such that their encoding bit rates are all higher than 100 Mbps, hence ensuring that they were of reasonably good quality at source. Since long videos may contain different scenes and have drastically different spatial/temporal complexities, the clips are selected such that their duration is less than 5 minutes. We then encoded them using the H.264 encoder with ffmpeg. To make the frame size comparable across different videos, we apply a constant quantization parameter of 28 to all videos. The distribution of spatial-temporal features is shown in Figure 4. It is seen
1.0
0.8
0.6
0.4
0.2
0.0 0.0
0.2
0.4
0.6
0.8
1.0
I frame size/Maximum I frame size
Figure 4.
The joint distribution of I frame size and
P frame size I frame size
of 3226 high
quality 4K videos uploaded to YouTube.
Settings of Subjective Study Each selected clip at 4K was converted to 2K representations. These were both encoded at the bit rates of 2 Mbps, 4 Mbps, 6 Mbps, 11 Mbps. This range was chosen to encompass the range indicated by the objective study discussed previously. In all, we have 9 × 4 = 36 pairs of videos in our subjective study. Each pair of videos has a 2K video and a 4K video of the same content and encoding bit rate. To compare the 2K videos with the 4K videos, we up-sampled the 2K video into 4K using bi-cubic interpolation and then conducted a Double Stimulus Continuous Quality Scale (DSCQS) subjective study following the guidance of ITU[11]. We use a 55 inch Samsung TV for our study and the participants sit 3.5m away from the screen. The screen of the 4K display was equally split into two parts. The 2K video and 4K video were synchronously played in the two parts such that the subjects could view and compare the two clips easily. There were 40 subjects involved in the subjective study. After each pair of clips was played, the subject was asked to give two scores for each video on a continuous scale of 0-100. The subject is also asked to report their preference between the two clips. In the subjective study, the subjects are unaware of the resolution and bit rate of the
60
prefer 4K no preference prefer 2K
1.2 55
Proportion
Mean Opinion Score
1 50 45 40
0.6 0.4
35 4K videos 2K videos
30 25 0
0.8
2000
4000
6000 8000 Bit rate (kbps)
10000
0.2
12000
0
2000
(a) Mean Opinion Scores
4000
6000 bit rate (kbps)
11000
(b) Preference
Figure 5. Experimental results. Figure 5(a): The mean opinion scores for all the videos in the subjective study. Figure 5(b): The distribution of the preference between 4K and 2K videos for all the videos in the subjective study.
videos they are viewing and the presentation sequence is randomized both in terms of the presentation sequence and whether the higher bit rate sequence is displayed on the left or the right of the split screen.
EXPERIMENTAL ANALYSIS We grouped the 36 pairs of videos according to their resolution (2K and 4K) and encoding bit rate (2 Mbps, 4 Mbps, 6 Mbps, and 11 Mbps) into 2 × 4 = 8 groups. Each group involves 9 different videos with the same resolution and encoding bit rates. Then we follow the same procedure as [5] to calculate the mean opinion score (MOS) for each group of videos using the scores collected from the subjective study. The obtained rateMOS curve along with the 95% confidence interval is shown in Figure 5(a). To show the overall rate-quality performance, we fit a logarithmic model to the measured MOS data at different bit rate. Using the model, the fitted MOS m at bit rate r is given by m(r) = a log(r) + br + c, where a, b and c are model parameters. The fitted curves for 2K and 4K videos are shown in solid lines in Figure 5(a). From the figure, it is seen that the optimal resolution switching bit rate is around 5 Mbps, which is larger than but close to the average switching bit rate (4 Mbps) obtained from the SSIM-based analysis. In this sense, SSIM is probably a good quality index for the purpose of estimating the average resolution switching bit rate for large amount of videos. Although SSIM may overestimate or underestimate the quality for a particular video, its estimation error will be averaged out when we estimating average quality for a large collections of videos. To test whether the difference of MOSs between 2K and 4K videos are significantly different, we conducted T-tests to check whether the scores given to 2K videos and 4K videos have different average values. We found that, at the encoding bit rate of 2 Mbps, 4K videos has significantly worse quality than 2K videos. At 11 Mbps, 4K videos has significantly better visual quality than 2K videos. However, the MOSs of 2K and 4K videos at the bit rate of 4 Mbps and 6 Mbps are statistically inseparable. We also calculated the proportion of subjects’ preferences between 4K and 2K videos. The results are shown in Figure 5(b).
It is seen that as the encoding bit rate increases, the population favoring 4K video increases while the population preferring 2K video decreases. Furthermore, for all the encoding bit rates, there is always a big fraction of subjects who cannot tell the difference between 2K and 4K videos. This is due to the fact that 2K and 4K videos both have very high resolution such that their quality difference is not obvious.
CONCLUSION AND FUTURE WORK This paper studies the resolution switching bit rate for multiresolution ABR streaming. We presented a framework for estimating this bit rate using both objective and subjective analysis. Our subjective analysis proposes a methodology for selecting a representative corpus for the subjective study and enables the direct measurement of rate-quality curves where D matches exactly human visual perception. For selecting a representative sample of 9 clips we show that the bit rate of I and P frames is a good indicator of complexity in this case. Our distribution of these features gives an interesting complexity summary of much of the 4K material uploaded to YouTube. Using SSIM as an objective quality metric, we found the average resolution switching bit rate for our 4K corpus is around 4 Mbps. The experimental results of the subjective study showed that the average resolution switching bit rate is around 5 Mbps, which is higher but close to our analysis. This paper only focuses on the resolution switching bit rate between 4K video and 2K videos for VP9 video codec. But the methodology used in this paper can also be applied to identify the resolution switching s between other resolutions for other video codec in the future.
References [1] MPEG Requirements Group, “ISO/IEC FCD 230016 Part 6: Dynamics adaptive streaming over HTTP (DASH).” http://mpeg.chiariglione.org/working_ documents/mpeg-b/dash/dash-dis.zip (Jan. 2011). [2] Tse, D. and Viswanath, P., [Fundamentals of Wireless Communication], Cambridge University Press (2005).
[3] Bertsekas, D. and Gallager, R., [Data Networks (2Nd Ed.)], Prentice-Hall, Inc., Upper Saddle River, NJ, USA (1992). [4] Toni, L., Aparicio-Pardo, R., Pires, K., Simon, G., Blanc, A., and Frossard, P., “Optimal selection of adaptive streaming representations,” ACM Trans. Multimedia Comput. Commun. Appl. 11, 43:1–43:26 (Feb. 2015). [5] Seshadrinathan, K. and Bovik, A. C., “Motion-tuned spatiotemporal quality assessment of natural videos,” IEEE Transactions on Image Processing 19, 335 – 350 (Feb. 2010). [6] Soundararajan, R. and Bovik, A. C., “Video quality assessment by reduced reference spatio-temporal entropic differencing,” IEEE Transactions on Circuits and Systems for Video Technology 23, 684–694 (April 2013). [7] Wang, Z., Simoncelli, E. P., and Bovik, A. C., “Multiscale structural similarity for image quality assessment,” in [Conference Record of the Thirty-Seventh Asilomar Conference on Signals, Systems and Computers ], 2, 1398–1402 (Nov. 2003). [8] Mukherjee, D., Bankoski, J., Grange, A., Han, J., Koleszar, J., Wilkins, P., Xu, Y., and Bultje, R., “The latest opensource video codec vp9 - an overview and preliminary results,” in [Picture Coding Symposium (PCS), 2013 ], 390– 393 (Dec 2013). [9] The WebM project, “VP9 Video Codec.” http://www. webmproject.org/vp9/ (2015). [10] Seshadrinathan, K., Soundararajan, R., Bovik, A. C., and Cormack, L. K., “Study of subjective and objective quality assessment of video,” IEEE Transactions on Image Processing 19, 1427 –1441 (Jun. 2010). [11] ITU-R Recommendation BT.500-13, “Methodology for the subjective assessment of the quality of television pictures.” http://www.itu.int/dms_pubrec/itu-r/rec/bt/ R-REC-BT.500-13-201201-I!!PDF-E.pdf (Jan. 2012). [12] Seo, G., Lee, J., and Lee, C., “Frequency sensitivity for video compression,” SPIE Optical Engineering 53(3), 033107 (2014). [13] Sullivan, G., Ohm, J., Han, W.-J., and Wiegand, T., “Overview of the high efficiency video coding (HEVC) standard,” IEEE Transactions on Circuits and Systems for Video Technology 22, 1649–1668 (Dec 2012).